GaWx
-
Posts
17,544 -
Joined
Content Type
Profiles
Blogs
Forums
American Weather
Media Demo
Store
Gallery
Everything posted by GaWx
-
Keep in mind that this Dec 7th warming has been well modeled for awhile and I assume you realize this is not anything close to a major SSW, which I figure you know requires the mean 60N winds at 10mb to reverse/drop to <0. As one can see on the EPS run below, the 10 mb wind is still way up at ~+30 m/s as of 12/7. So, the current warming is at best considered a “minor” warming. Per this EPS, the first chance for an actual major SSW isn't for another 3 weeks with the best chance not til January. That’s when the real deal may come:
-
I agree that phases 4-7 have tended to be underestimated for the last few years due largely to the tropical warm WPac per met. Brad Harvey. As I’ve said, he looks at the tropical WPac area N of Australia. That area actually remains cooler than it has been since 2015 and significantly cooler than 2021-3. But what’s happened over the last 7 days? Have the forecasted phases 4-7 strengthened? A. 1) GEFS (bc) run from 11/30: 2) GEFS (bc) run from today: So, today’s GEFS is actually slightly weaker in 4 and significantly weaker in 5-7. ——————————————— B. 1) EPS (bc) run from 11/30: 2) EPS (bc) run from today: So, today’s EPS unlike GEFS is a bit stronger in 4/5 and the first part of 6 vs the 11/30 run. However, it then curls back into the COD beyond where the 11/30 run ended. So, it is a wash over the last week between the changes of the two models. But note that neither of today’s models has it strong at the end with GEFS just outside the COD in 8 and EPS weak inside the COD of 7. Hopefully, the models won’t trend stronger then and that the actual trek into 8/1/2/3 will end up weak. That’s because weak MJO would mean a much better shot at cold late month into Jan vs mod to strong MJO per this diagram of DJF MJO for E US cold shots:
-
Yeah, per last few extended GEFS and Euro Weeklies, the chance for a major SSW (say when 10 mb winds actually go <0) in late Dec is quite low as of now. The Euro has pulled back substantially on late Dec chances vs earlier runs. But just a few days into Jan, the chances pick up substantially meaning the 2nd week of your two week window has a far greater chance than your 1st week. The EPS is showing right now the best chances for 10 mb winds to first go <0 Jan 2nd-20th. The GEFS suggests best chances Jan 4th or later. Of course, getting one at all is still far from certain. But the signals are there and are probably about as strong as they’re going to be on models still this far (3.5+ weeks) out.
-
Absolutely awesome and as weak an SPV as on any Euro Weeklies run yet in early Jan! Still, we need to always make sure there’s no can kicking/mirage effect. There’s been some of that in mid to late Dec with not as weak a SPV vs earlier runs. OTOH, for now, I’m not seeing slippage for ~Jan 11th potential, which is where the greatest potential is currently centered. This run appears to have ~~50% of the members with a major SSW between 12/27 and 1/20! The mean EPS gets as low as a mere 12 m/s on Jan 11th vs a climo normal of 33 then! I’ll compare the Jan 11th mean to prior runs to see if there’s can kicking then: today’s run (12/6): 12 m/s 12/5 run: 17 m/s 12/4 run: 14 m/s 12/3 run: 15 m/s 12/2 run: 15 m/s 12/1 run: 18 m/s 11/30 run: 23 m/s 11/29 run: 23 m/s So, no slippage and if anything the opposite with the 12 m/s the weakest yet for Jan 11th. I count 19% that dip to the extreme level of sub -15, which would be near a record low for the entire 12/27-1/20 period. There are 9% that drop to -20, 8% to sub -25, and 5% that go sub -30. Combine that with favorable weak MJO and there would appear to be so much potential for January in the E US, especially mid-Atlantic south:
-
I was curious and decided to do a Google search to see if I could find any study of the relationship of MJO amplitude and E US temperatures and this is what I found: https://scholarsarchive.library.albany.edu/cgi/viewcontent.cgi?article=1007&context=honorscollege_daes It backs up what I've been saying about weak MJO (including inside COD) as opposed to strong MJO tending to be supportive of cold anomalies in the E US! That's why I'm hopeful for a much colder outcome late Dec onward than 2015-6 and many other winters. Figure 13 (shown just below) in this study suggests that cold anomaly events in the eastern U.S. tend to have weak (amplitude <1) RMM signals. But this includes ALL seasons. All but one of the 17 strong MJO phase 7, 8, 1, and 2 events seen in figure 13 actually occurred OUTSIDE of winter as you'll see in figure 14 shown further down. Figure 14 below is the same except just for DJF. In this, I count a total of 47 cold E US events. A whopping 85% (40) of the cold DJF events had the MJO either just outside, on, or within the COD! A mere one of the 47 (in phase 7) had strong MJO! If you want a cold E US period in winter, your best bet by far is if the MJO is near or inside the COD, which is where model consensus says we're headed. A picture is worth a thousand words: .
-
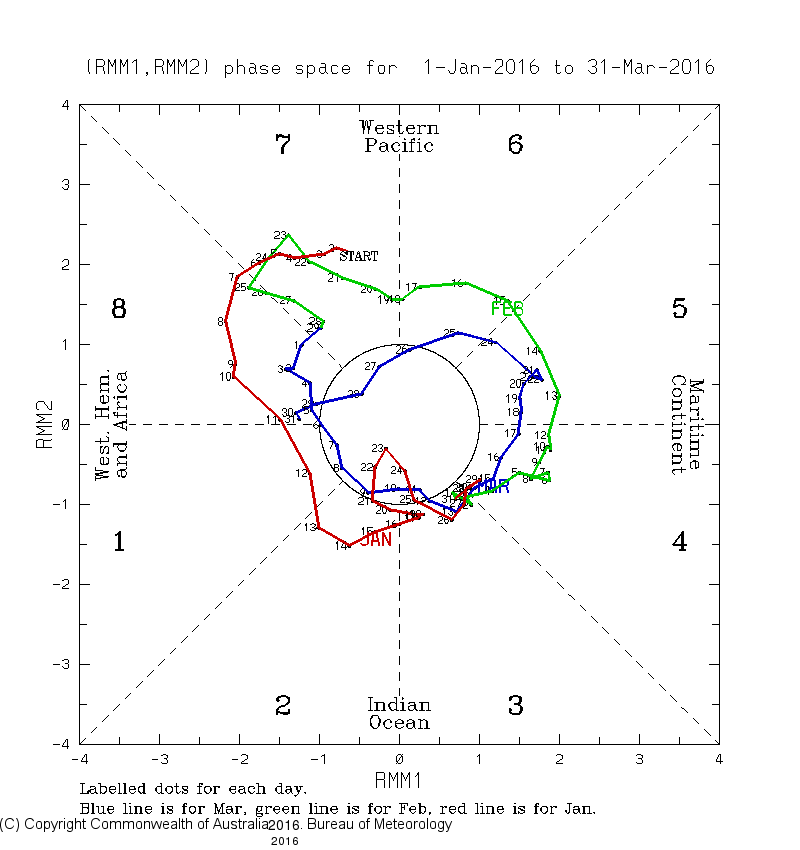
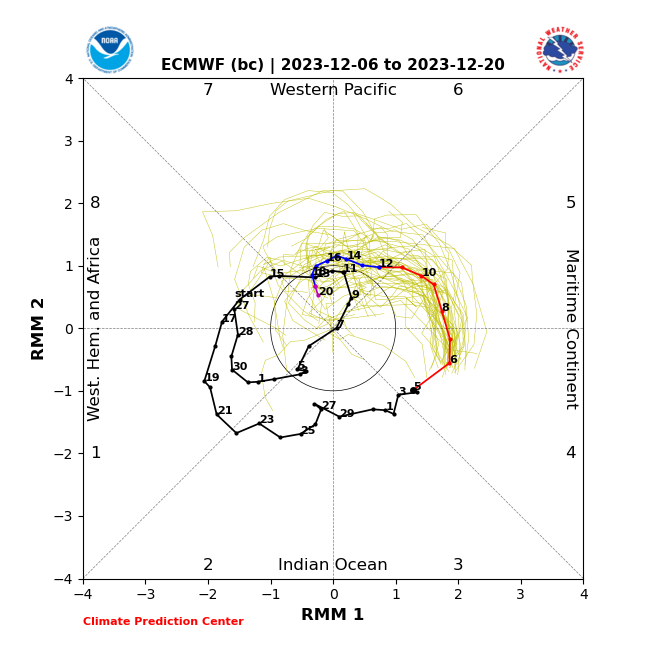
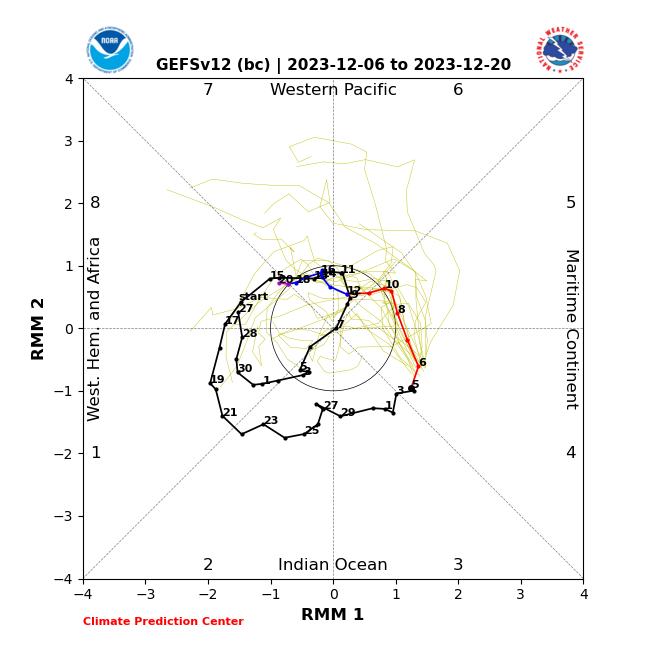
Not only Dec, but the entire DJF of 2015-6 was dominated by much stronger MJO than is being suggested this time at least from mid Dec into Jan. Stronger MJO generally translates to a warmer E US. Many of the coldest spells during El Niño have occurred during weak MJO, especially left side. I posted/reposted 15 occurrences with MJO/temps at NYC/ATL in an earlier post to back up my idea. From this point forward, there were only ~10 days of winter near or within COD MJO during 2015-6, with most of that Jan 18-25. The sole big snow of 2015-6 was on Jan 23rd, which was smack dab in the middle of that weak MJO when the MJO was inside the COD phase 2 (red line): In stark contrast to the stronger MJO of 2015-6, the following 2 week progs have a weak phase 8 MJO on Dec 20th with extended model progs suggesting it will remain weak and slowly traverse 8/1/2 going into Jan: 1) GEFS: very slow move in weak MJO 8 at end 2) EPS: slow move in weak MJO 8 at end

-
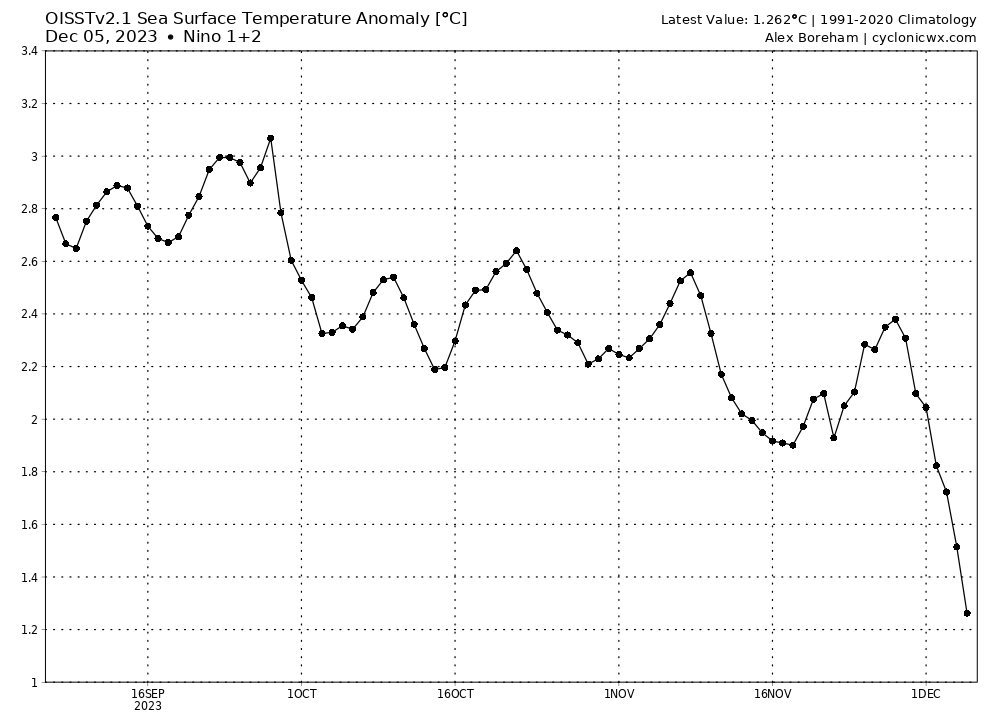
Look at this OISST plunge of Nino 1+2! Did anyone foresee this?
-
1. The Nov +PNA means that for only the second time since 1950, there was a +PNA in all of June-Nov. The only other time was 2021. But 2009 was a very close call. I consider +0.25+ a +PNA month. 2. The Nov -NAO means that for only the 3rd time since 1950, there was a -NAO in all of June-Nov. The only other years were 2012 and 2010. I consider -0.25- a -NAO month.
-
Nov: The NOAA PDO of -1.79 compares to the WCS PDO of ~-1.00. Oct: The NOAA PDO of -2.26 compares to the WCS PDO of ~-1.10. So, the NOAA continue to be more negative though the gap narrowed a decent amount in Nov.
-
Today’s Euro Weekly for Jan 1-8 has about the strongest E US cold signal of any run yet (runs for Jan 1-8 go back nearly two weeks):
-
Not much. The heaviest concentration is early to mid Jan for a possible major SSW.
-
I absolutely have been saving a bunch of the Euro Weeklies SPV progs. I was the one repeatedly mentioning the can kicking that went on between the Nov 1 and 19th runs. Remember? After that, they suddenly got much more bullish about a weak SPV. In recent days, I’ve noticed not as weak of an SPV in early to mid Dec as in runs from a few days ago and in late Nov. We have to make sure this won’t turn out to be a mirage just like with all model progs for anything. Today’s isn’t as weak as the three prior runs of 45+% of members with major SSWs. Today it is ~38%. Also, the # of members with a sub -10 is only ~18%. That was way up at ~30% a couple of days ago.
-
-
I’ve posted many examples of weak left side MJO during El Niño showing that this combo during winter is often cold in the E US, especially SE US-Mid Atlantic. And that’s not necessarily even requiring a weak SPV. Throw a weak SPV on top of this and then cold is even more favored.
-
I wouldn’t bet on a combo of El Niño, WEAK (including inside the COD) 8/1/2/3 MJO, and a weak SPV being mild in the E US in winter.
-
Dec 4th Euro Weeklies look similarly impressive with numerous EPS members (~45%, which is similar to prior two days) with major SSWs 12/28-1/18. A year ago (~12/31/22) the SPV was in stark contrast near a record high strength! Strongest SSWs: ~27% <-10 vs 25% prior run 8% <-20 vs 5% prior run 7% <-25 vs 3% prior run 5% <-30 vs 0% prior run
-
SON ONI (ERSST based) came in at +1.78. So, ONI-RONI gap dropped in SON but only slightly to 0.44 from 0.49 in ASO. Nov ERSST input to ONI was +2.02. Nov OISST was +1.90 due to different base climo because absolute SSTs came out the same (28.72).
-
Thus, El Niño is about as flat/basin wide as can be. Neither EP nor CP but a blend instead.
-
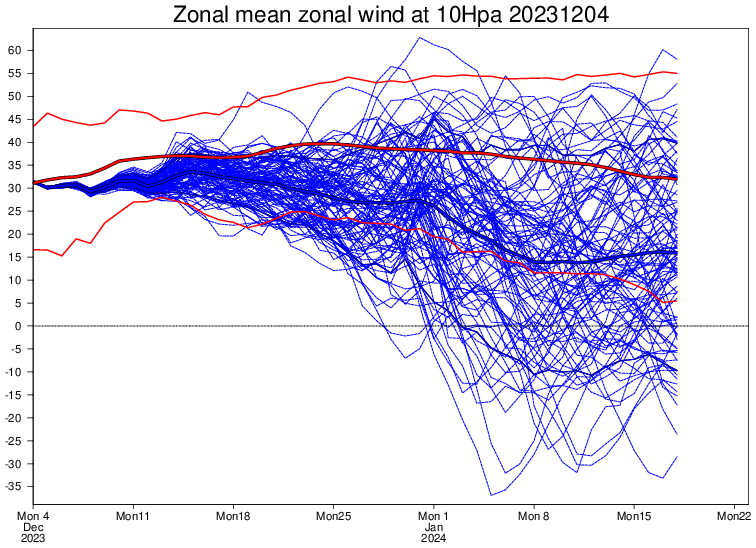
From EPS at 10 mb for 1/1-1/8:
-
OISST Nino 3.4 was down sharply in both of today’s updates: -WCS from +2.09 to +1.97 -cyclonicwx from +2.09 to +1.95 The other three cyclonicwx regions also dropped and keeps 3.4 the warmest just ahead of 3.
-
No clearcut answer as the timing varies a lot and they sometimes don’t work their way well down into the troposphere or don’t always focus on the E US. Sometimes it is already cold in the E US because of an +PNA or cold MJO phase. And then sometimes like for last winter there’s a strong -PNA in place that mutes the cooling or delays it more. But keeping these caveats in mind, the rough average lag to see the start of the major effects is ~2 weeks afterward. So, that would mean a wild guess of a start between ~Jan 8th and Jan 29th, way earlier than the mainly mid March cooling from the 2/16/23 major SSW.
-
Thanks for posting. The potential of a major SSW is every winter lover’s baby! 1. I roughly estimate that a whopping ~48-50% of these 101 EPS members have a major SSW (vs ~45-48% yesterday and ~38% two days ago) meaning the highest % yet! They occur 12/25-1/16 or ~3-6 weeks from now. I’d venture to guess that ever getting much more than 50% of members that far out is rare meaning I believe that this is just about as strong a signal for a major SSW as you’re going to get 3-6 weeks out. On Jan 13th, the EPS mean is a mere 15 m/s, vs climo of 35 m/s (similar to yesterday). 2. Although the # of major SSW members increased slightly, the # of extreme dropped some though still the #s are still significant: -sub -10: ~25 vs ~30 yesterday -sub -20: 5 vs 12 yesterday -sub -25: 3 vs 8 yesterday -sub -30: 0 vs 2 yesterday
-
Wow! The chance for a major, and possibly even an extreme SSW in early Jan is even higher! On Jan 9th, the EPS mean of 101 members shows a mere 14 m/s vs climo way up at 35! There are so many members with a major SSW that it will be tough to count! This appears to be at a whopping 45%+ for a major, easily the highest yet beating yesterdays ~38%. Dates are from 12/25 through 1/16. This has ~~30% of the 101 members down to sub -10 m/s (vs 20 in prior run), 12 sub -20 (vs 10 in prior), 8 sub -25 (vs 4 in prior), and 2 sub -30 (vs none in prior):
-
More on the above. 2022, 2009, and 1985 were the only sub -2 AO 12/1-16, where 2023 is possibly headed. The most -AO winters in order were 2009-10, 1976-7, 1968-9, 1962-3, 1969-70, and 1985-6. So, 2 of the 3 most -AO 12/1-16 ended up within top 6 most -AO winters of 73 winters! Only 2022-3 didn’t. Of those 6, only 1962-3 and 1985-6 weren’t Nino but they were neutral. 2022-3 was a solid Niña. Not being La Niña and being El Niño changes things tremendously. Despite difficulty in getting -NAO winters since 1979, -AO winters haven’t been overly tough and this along with progs for weak SPV for at least first half of winter tell me that a -AO winter is now looking likely. Don’t know if that would drag the rare winter -NAO along with it, but that sure would increase its chances.
-
But big diffs -we're in El Nino (favor PNA) vs 2022's La Nina, which favors -PNA -there was record strong SPV late Dec 2022 vs progs for weak SPV late Dec 2023 -mid to late Dec was in warm MJO; then much of Jan-Feb was in strong often right sided MJO vs progs for weak left sided MJO late Dec into Jan