jconsor
-
Posts
1,027 -
Joined
-
Last visited
Content Type
Profiles
Blogs
Forums
American Weather
Media Demo
Store
Gallery
Everything posted by jconsor
-
Can you please send a source confirming those wind gusts? What altitude are they measured at? Montauk Airport has seen gusts to 52 mph.
-
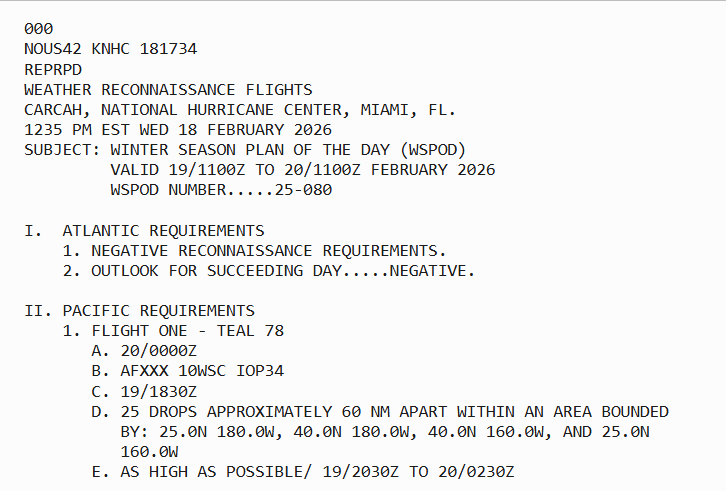
This a good summary of where we stand IMHO, though it was written before the 12z cycle. https://x.com/ContentWxGuy/status/2024528387927097369 Recon data may help the models gain clarity, though the recon mission prior to Fri 0z run is significantly further west into the central Pacific than the recon mission whose data was ingested into today's 0z cycle.
-
All that said, I think the best potential for a significant event e.g. 6"+ is from the Delmarva to southern and coastal NJ, and especially from eastern LI to southeast New England. As others have mentioned, given the upper level setup and strong indications of bombogenesis, as well as enhanced baroclinicity with anomalous cold SST near the mid-Atlantic coast butting up against above normal SST along the Gulf Stream, this storm needs to be carefully monitored. A small change in synoptics opens up the potential for a much more impactful storm, especially from coastal NJ to LI, but possibly a little further NW as well e.g. NYC, southern CT.
-
This article speaks more about skill of AI models in medium range (beyond day 5), but I believe same applies in the 3-4 day range - AIFS ensemble has superior skill to EPS and other physics-based ensembles. AI-GEFS has superior skill to GEFS but isn't as skillful as AIFS ensemble. https://x.com/Brady_Wx/status/2021333729088585882 Given that GEFS and GEPS are closer than the EPS to AIFS ensemble (as well as AI-GEFS) in terms of more amplified trough initially over Ohio Valley/Great Lakes with more downstream ridging, and deeper upper low closer to the mid-Atlantic coast, I would weight them more than EPS in this setup. All models shifted in that direction (when compared to yesterday's 0z run) after ingesting a new batch of upper air data from recon. It appears to me that the EPS under-amplification bias may be at play here and it is most likely playing catch-up here, like the AI summary that Sacrus posted intimated happens sometimes in NE US winter storms.
-
Basically agree with Brooklynwx. From past experience given the run to run consistency and cross-model agreement amongst the various ML models including AIFS and its ensemble, WeatherNext, GraphCast and Pangu, I would expect the EPS to shift closer to their scenario in the next 24-36 hours.
-
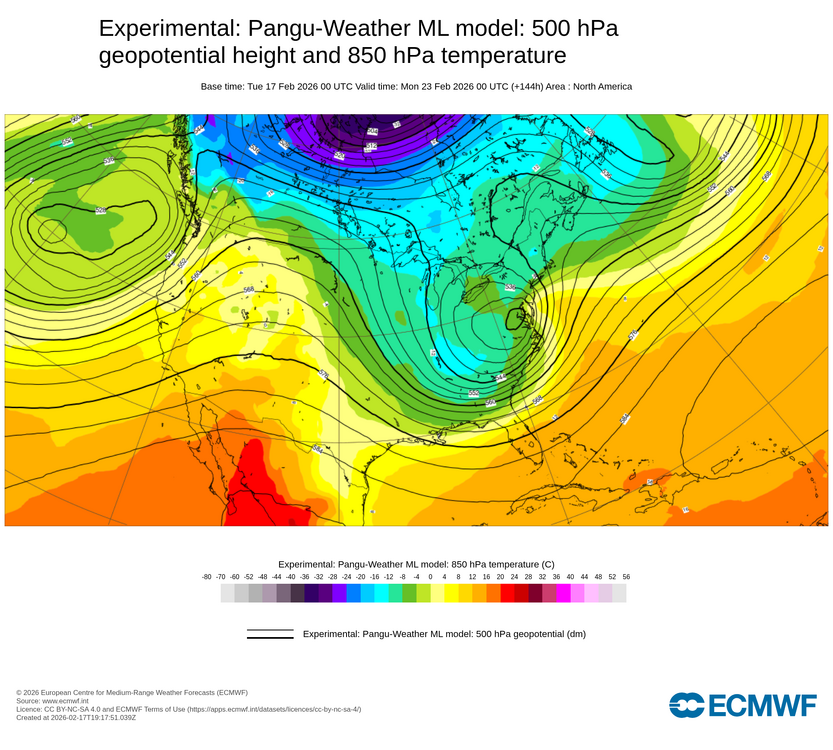
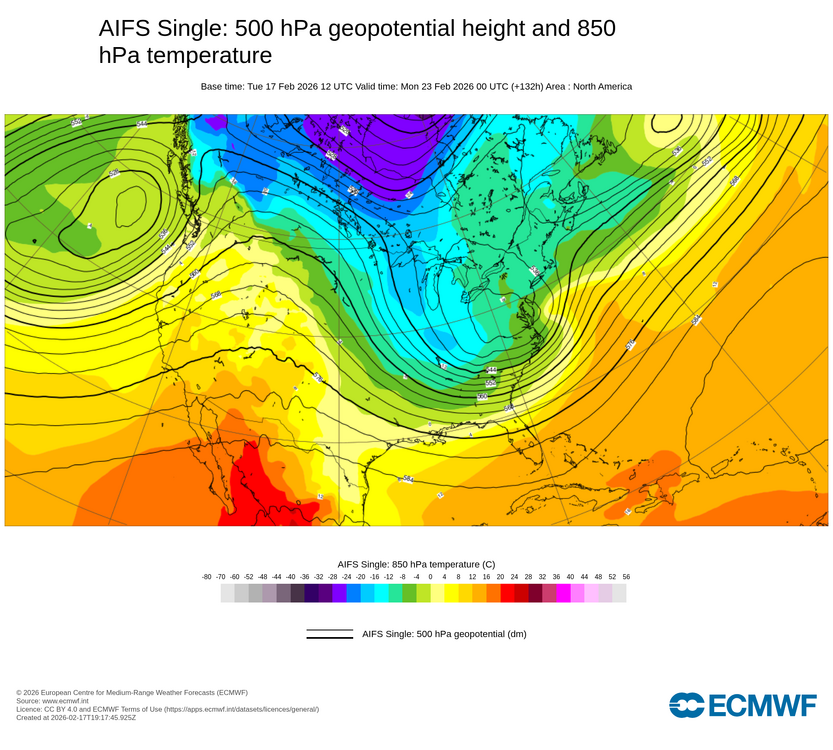
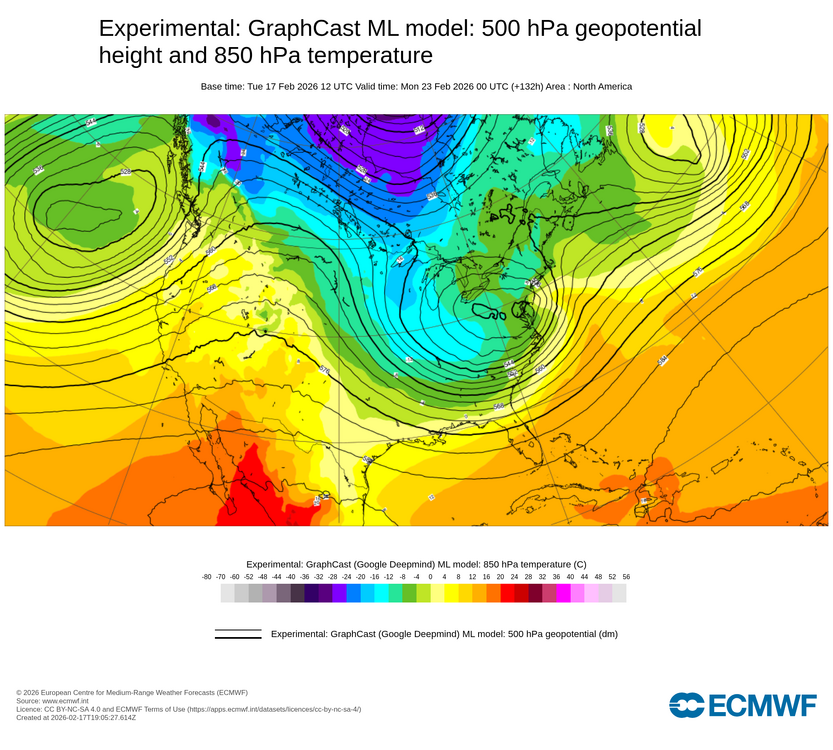
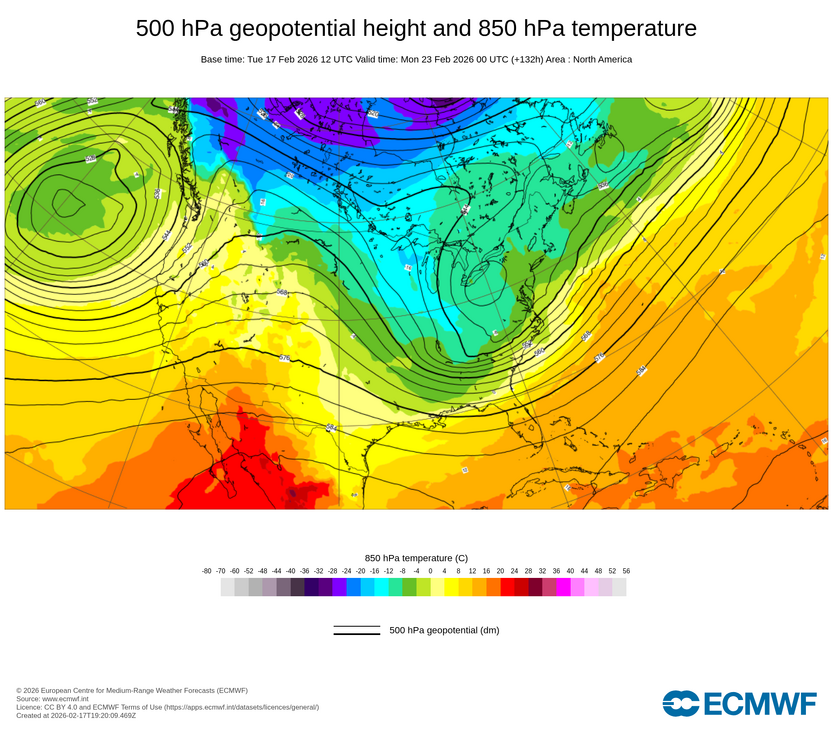
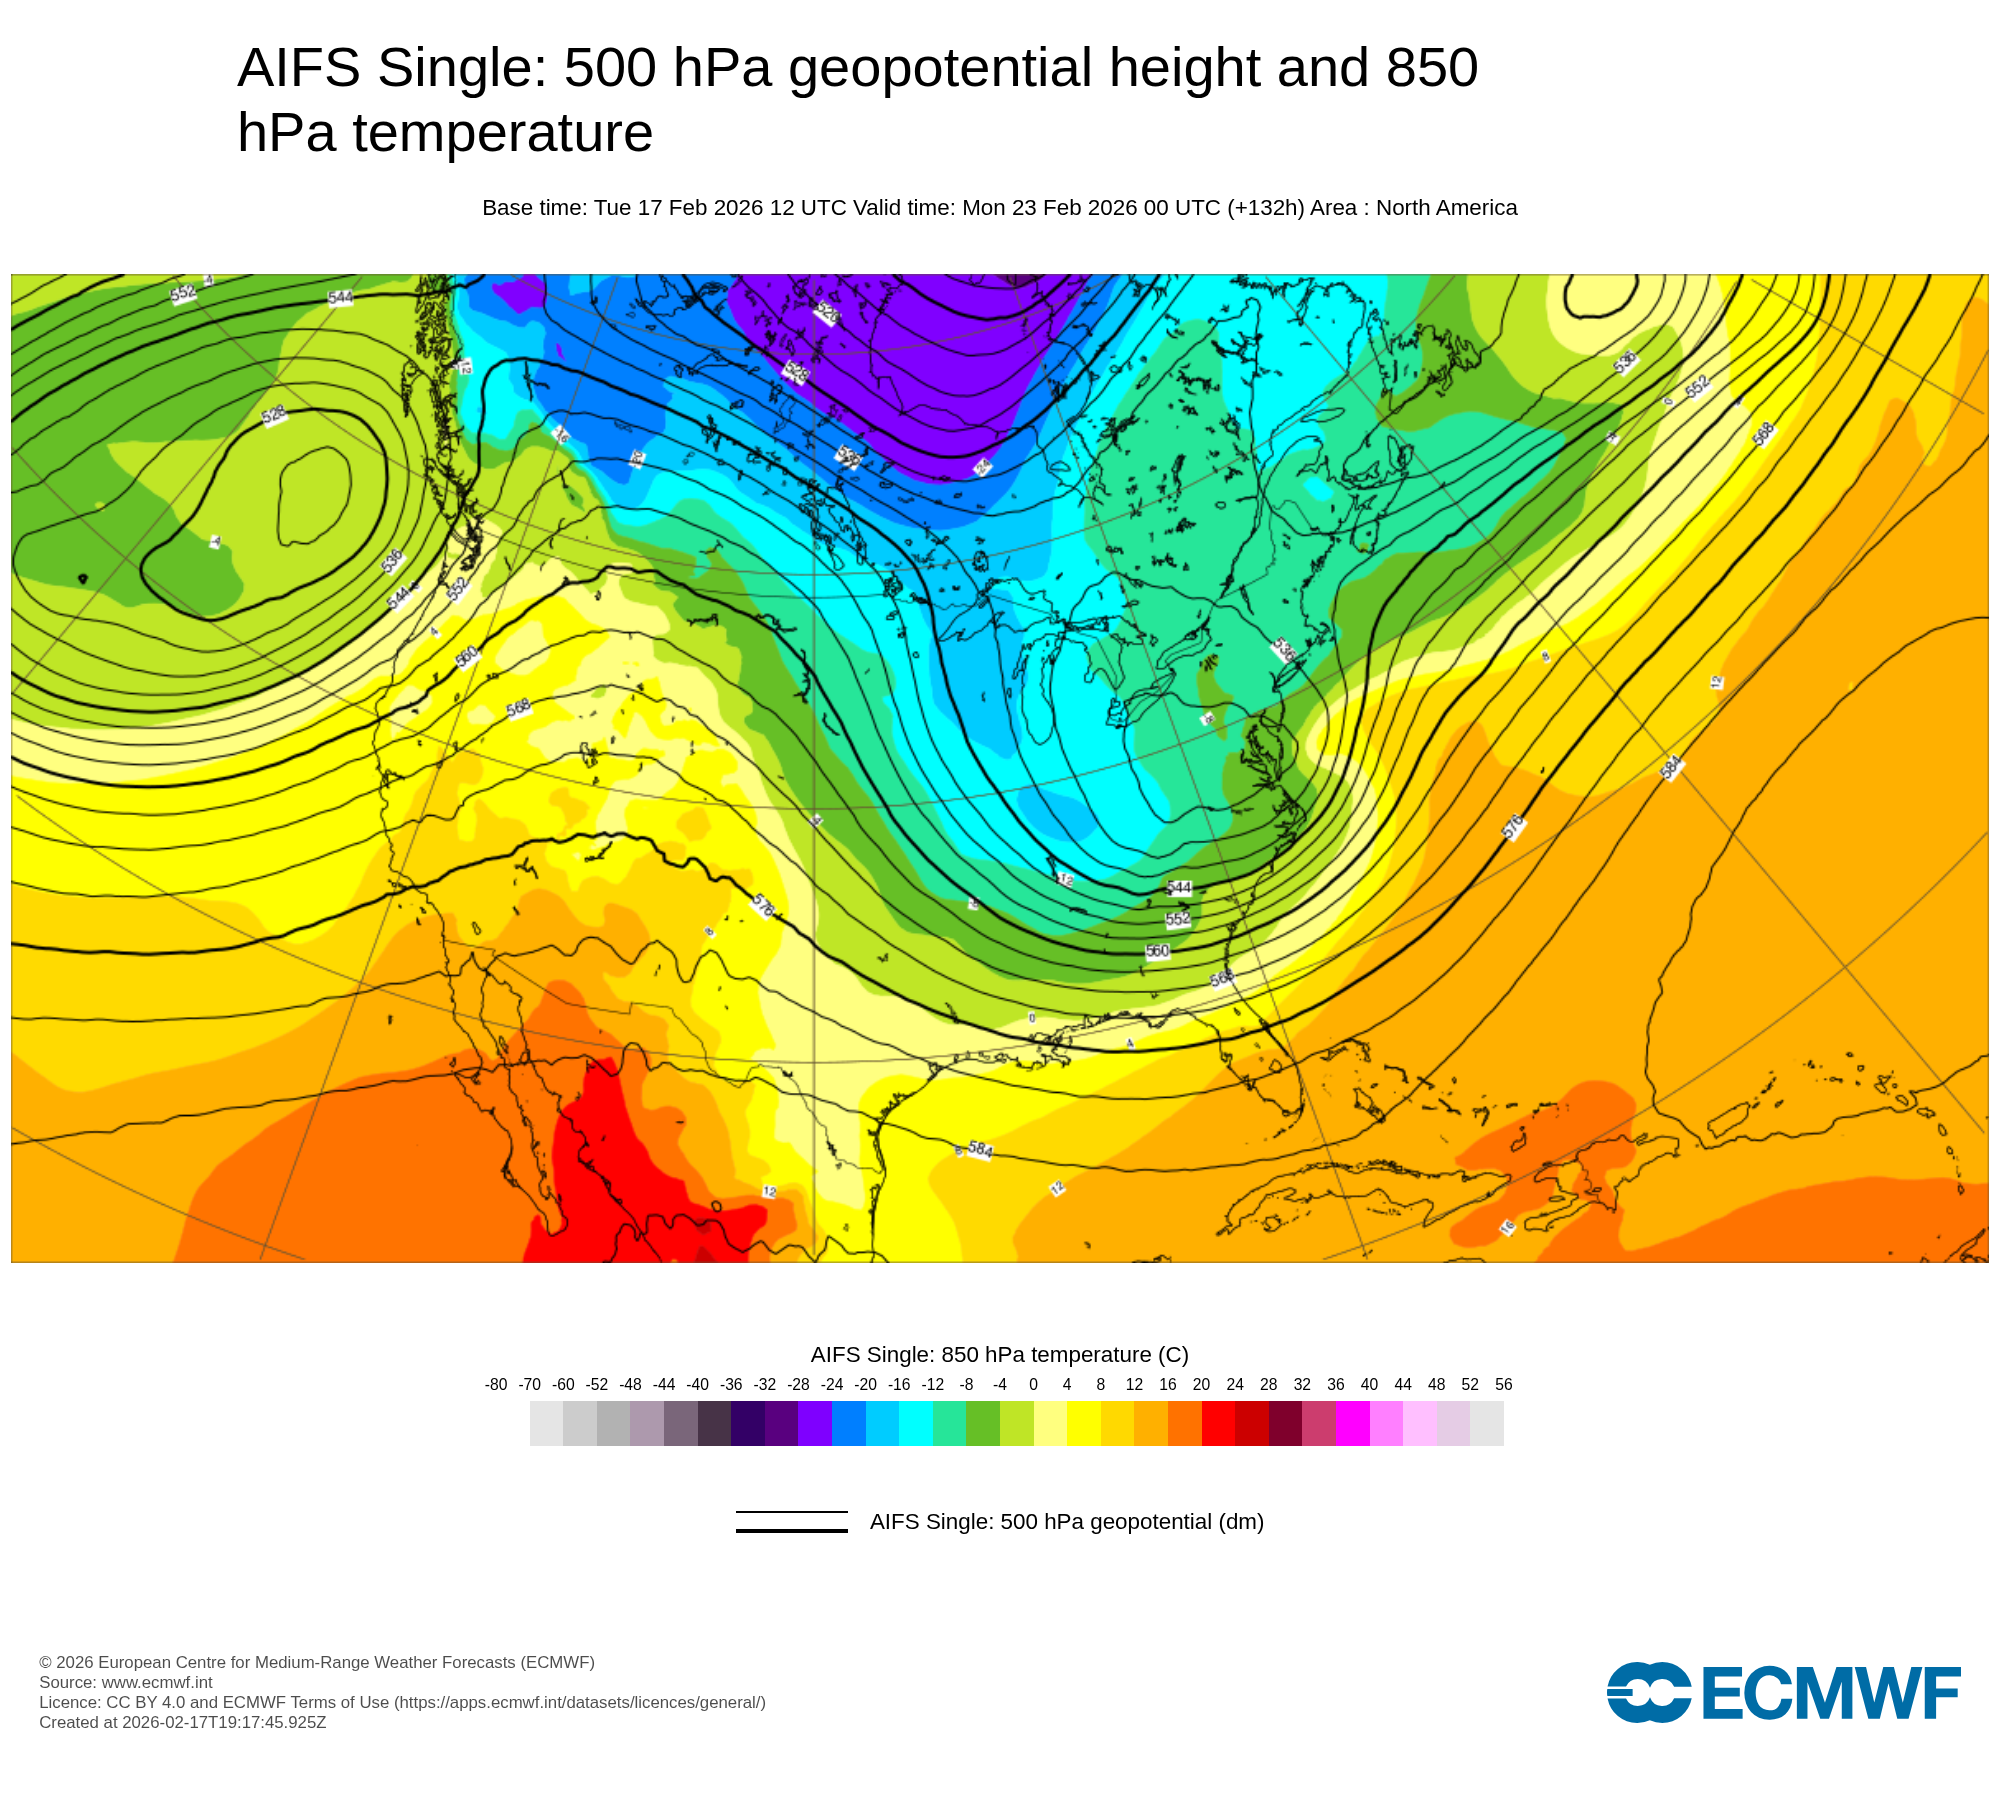
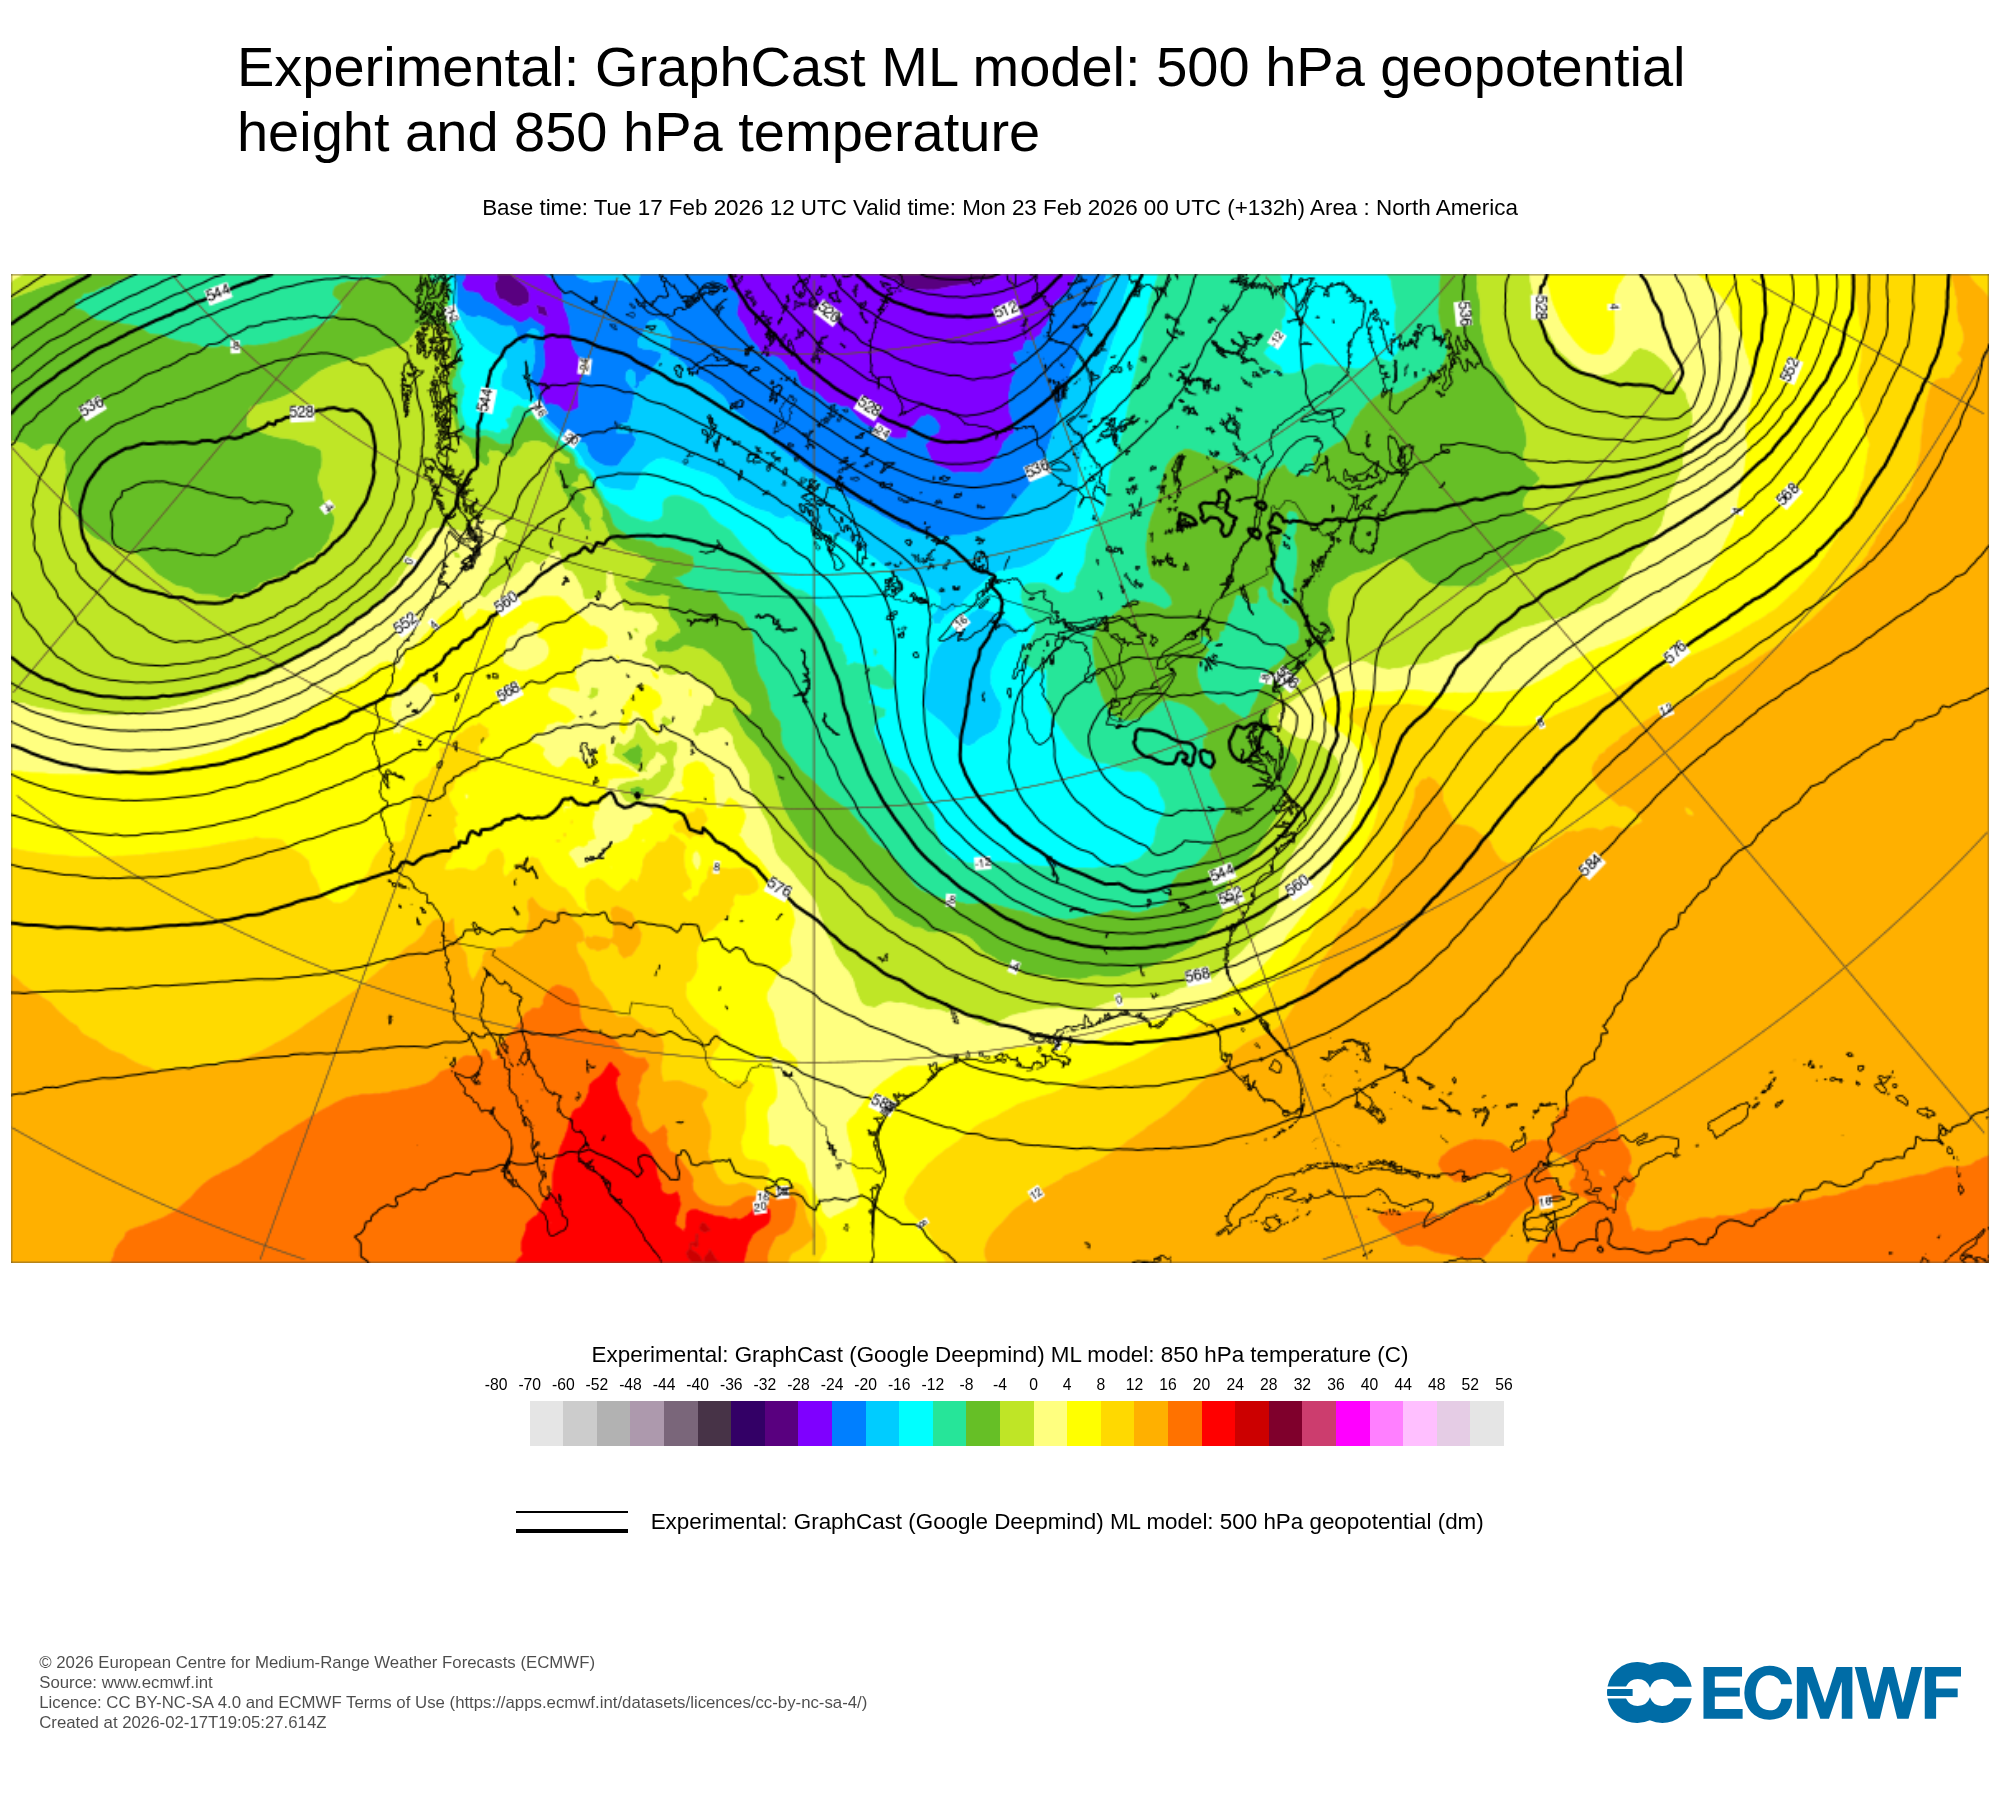
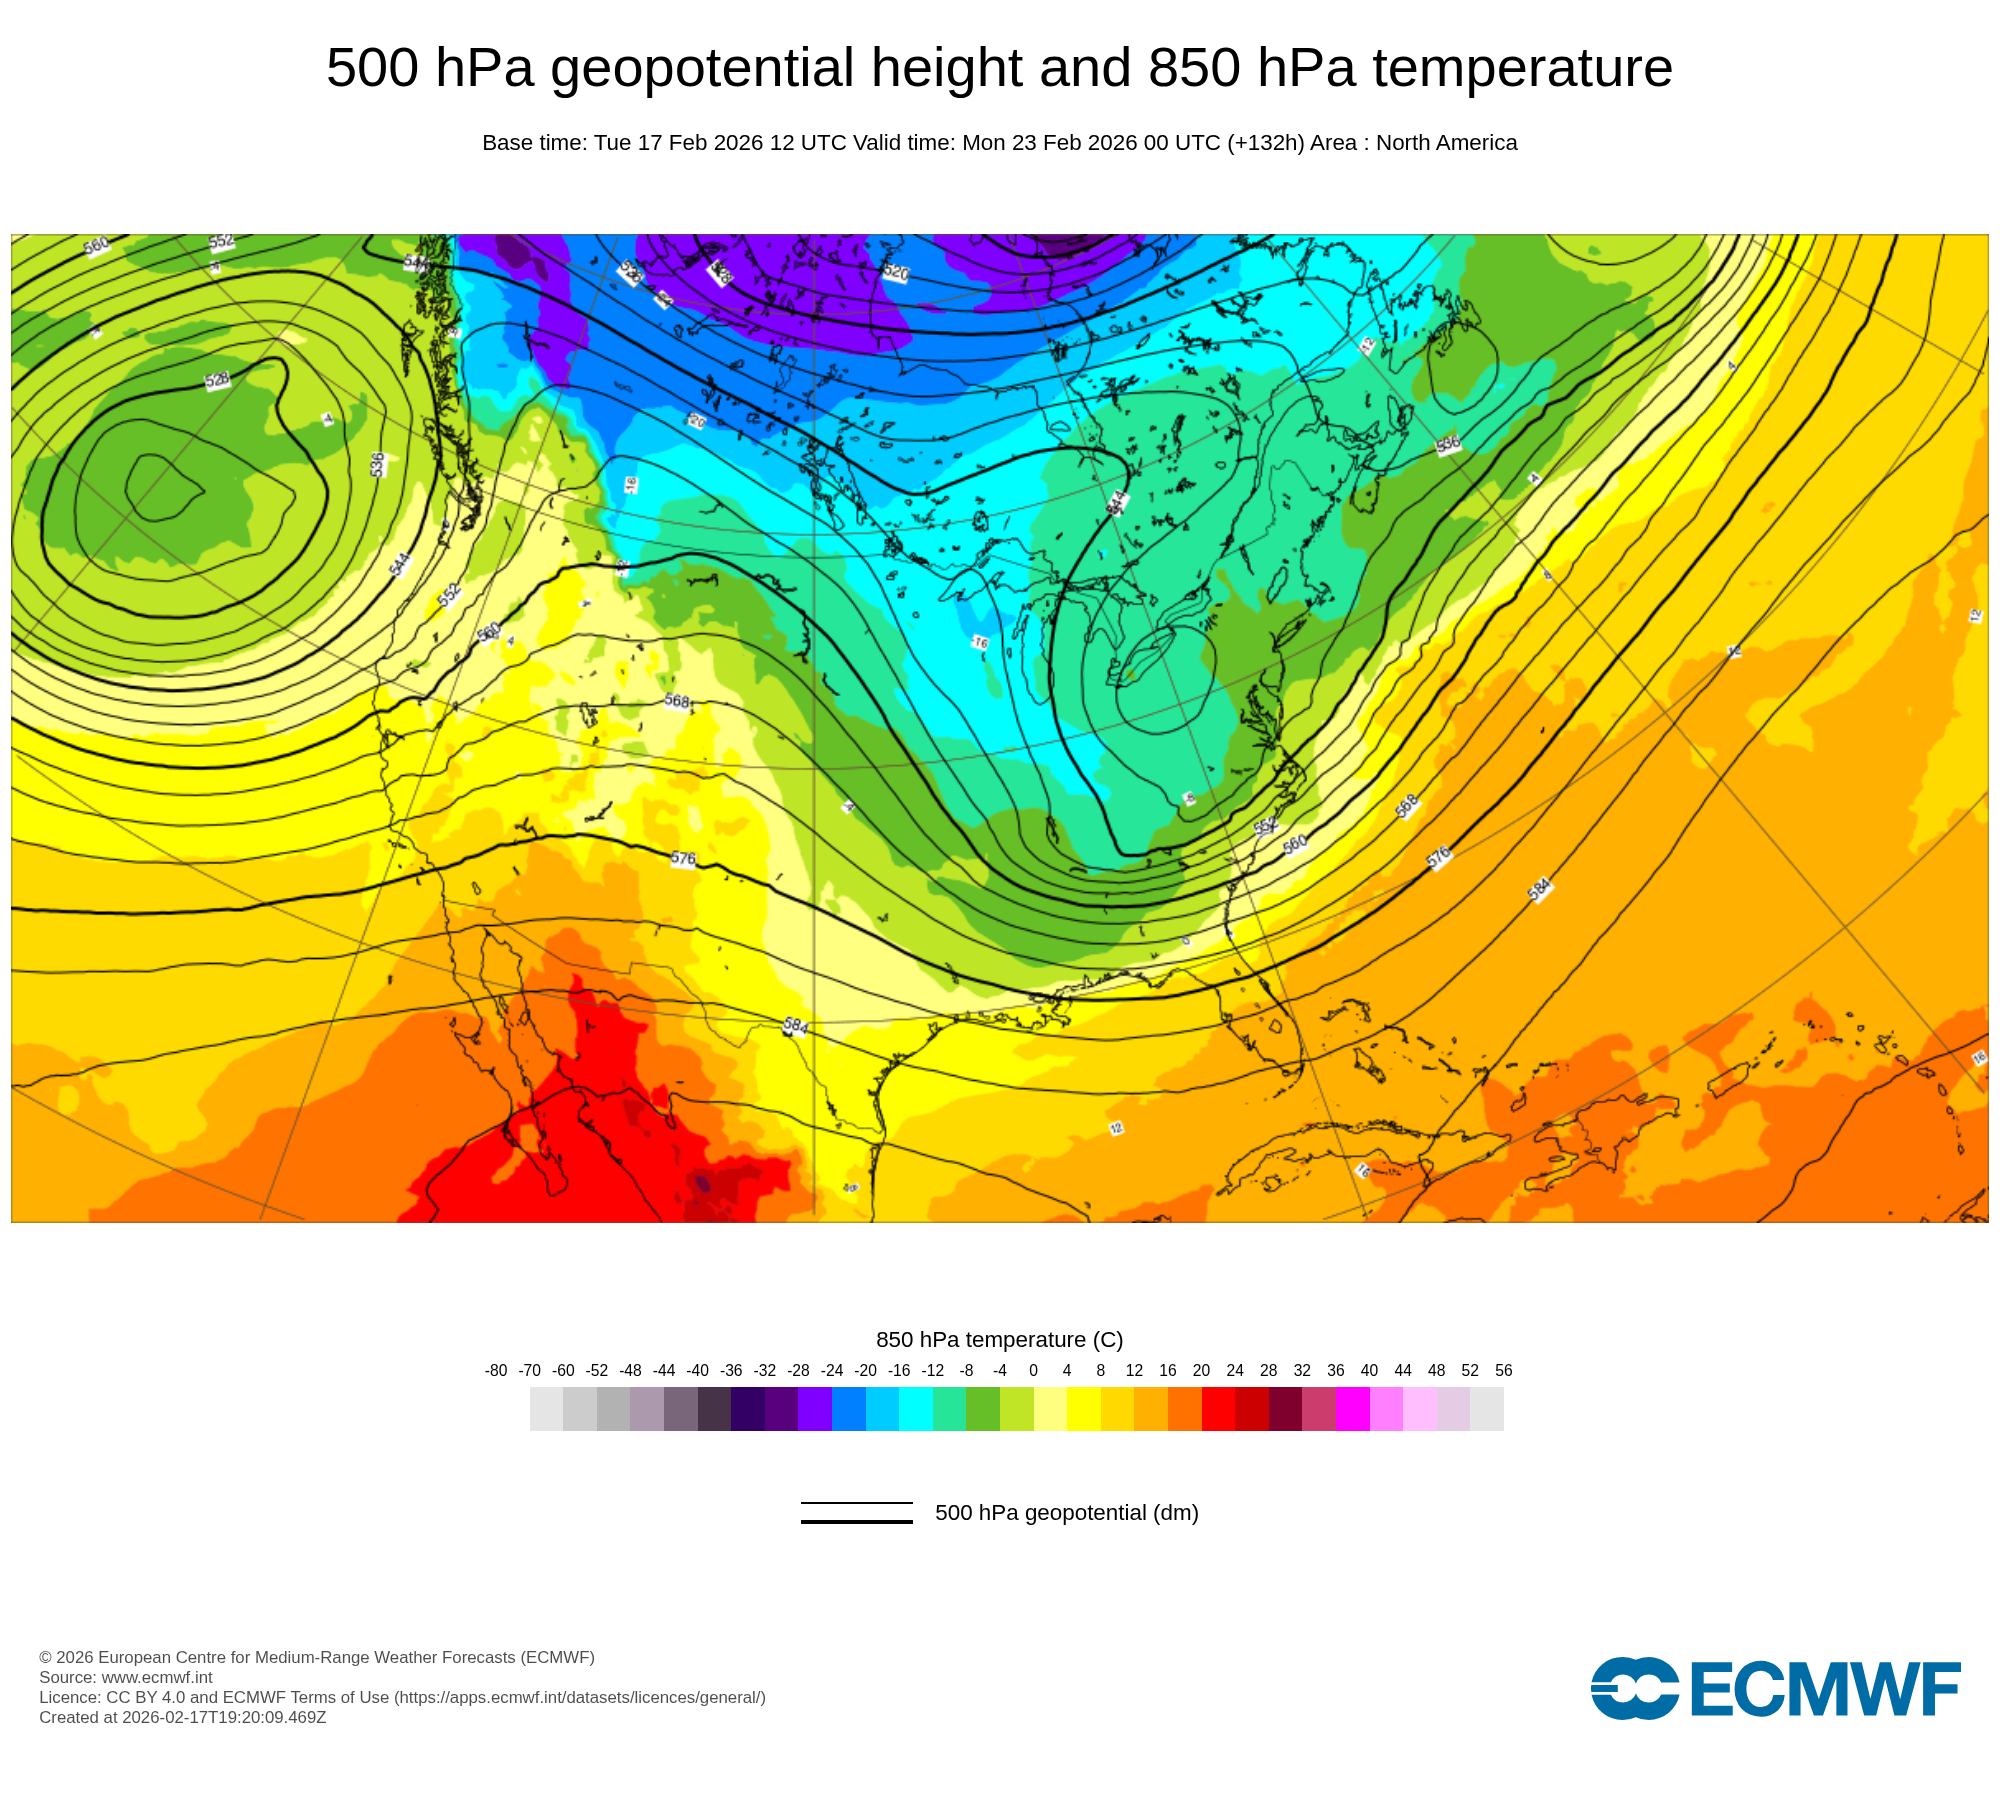
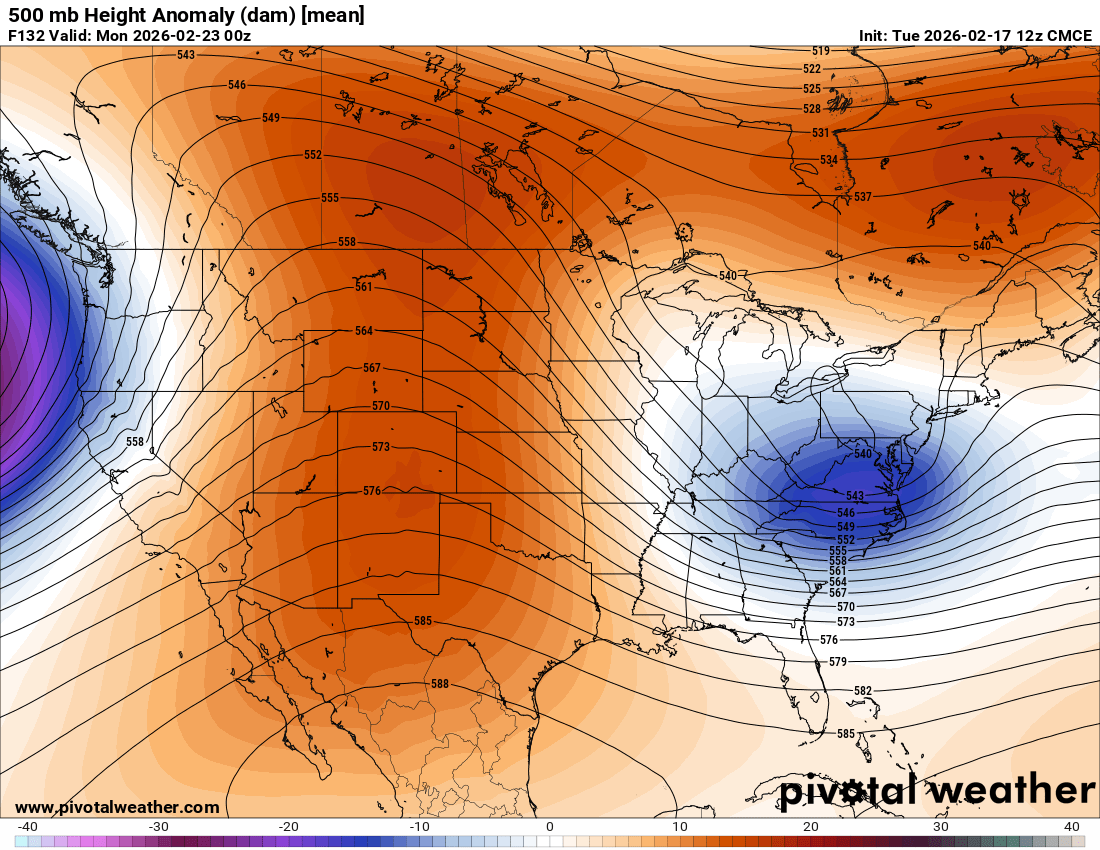
It is encouraging to see two other highly skilled ML models (GraphCast and Pangu) show an outcome very similar to the AIFS and also similar to AIFS ensemble mean, without the entanglement of the the Sun-Mon system with the system ahead of it across SE Canada shown by the operational ECMWF (last image).
-
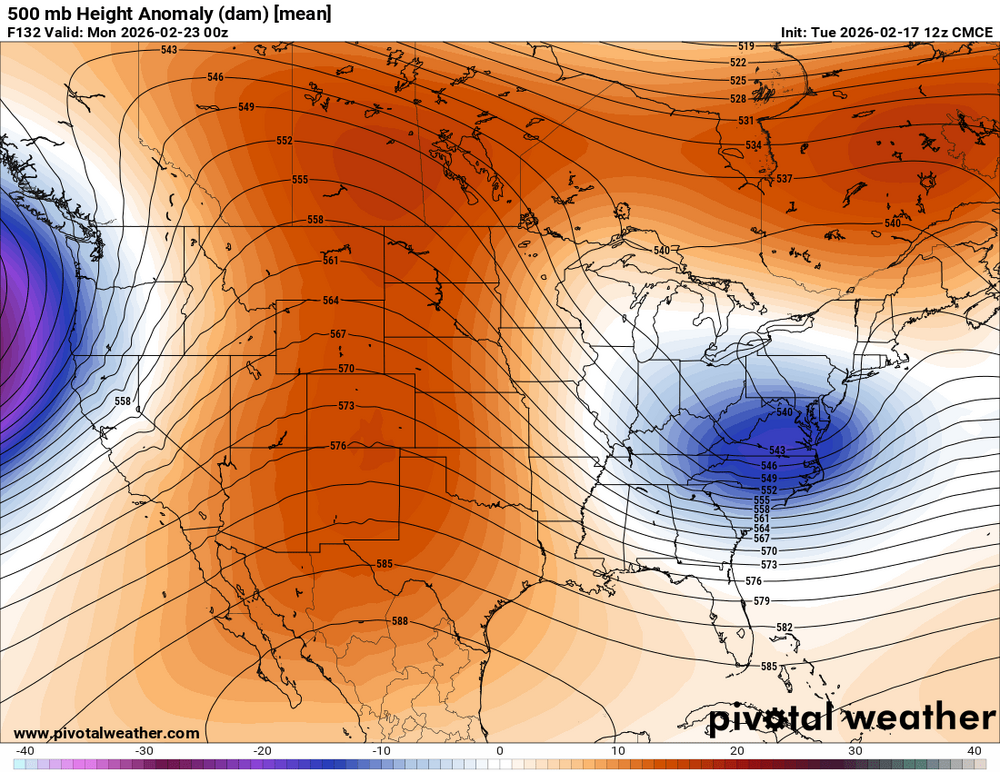
The GEPS showing similar trends to the AIFS ensemble, though today's 12z run is a bit more suppressed than the 0z as the trough turns negative tilt near the NE US coast.
-
Impressive four run trend from the AIFS ensemble. Note the western ridge trending further west and more amplified. Meanwhile the combination of the ridging east of Hudson Bay and trough over SE Canada exerts less of a suppressive influence, allowing the Sun-Mon trough to amplify more.
.thumb.gif.0e2c4df72f4ea87ea3b84db85b610251.gif)
-
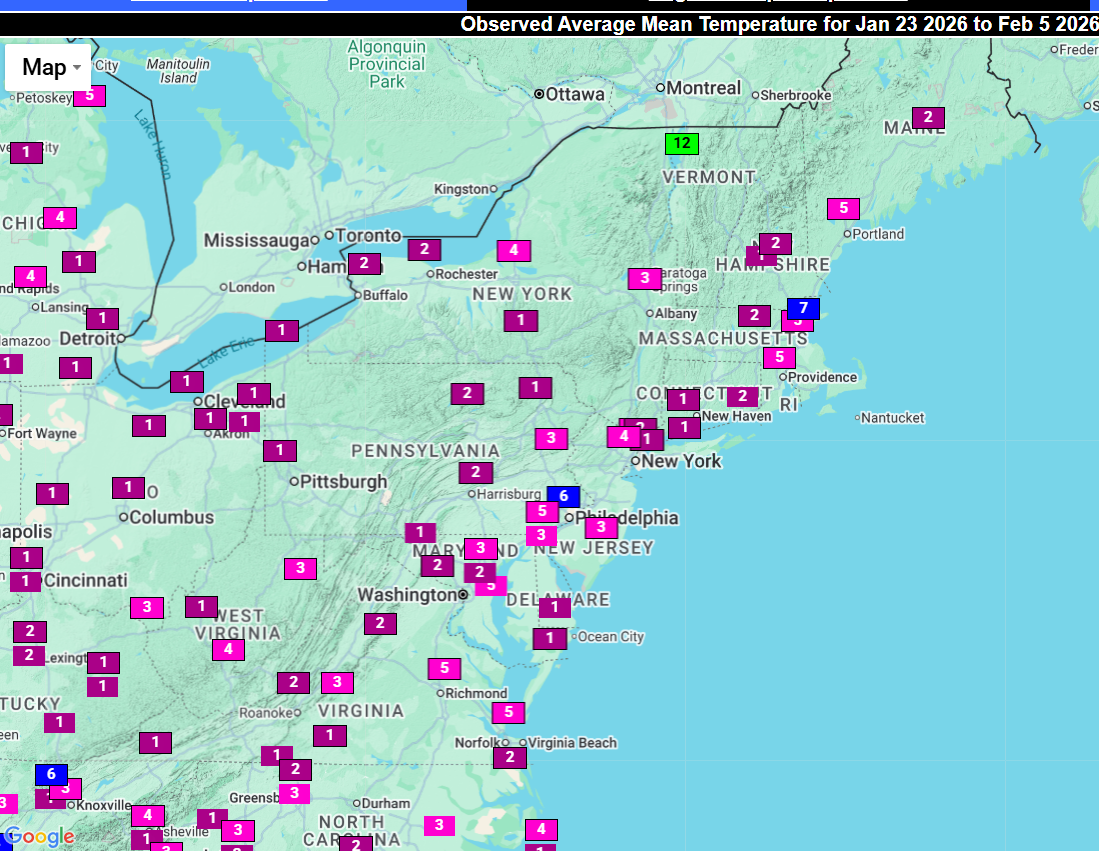
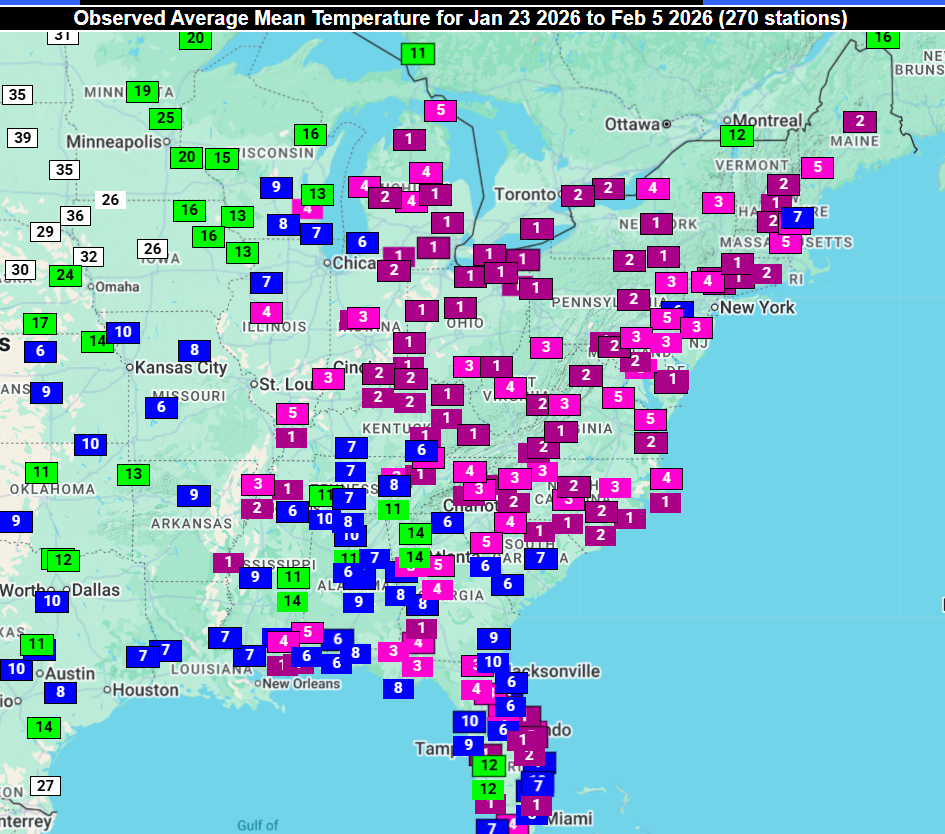
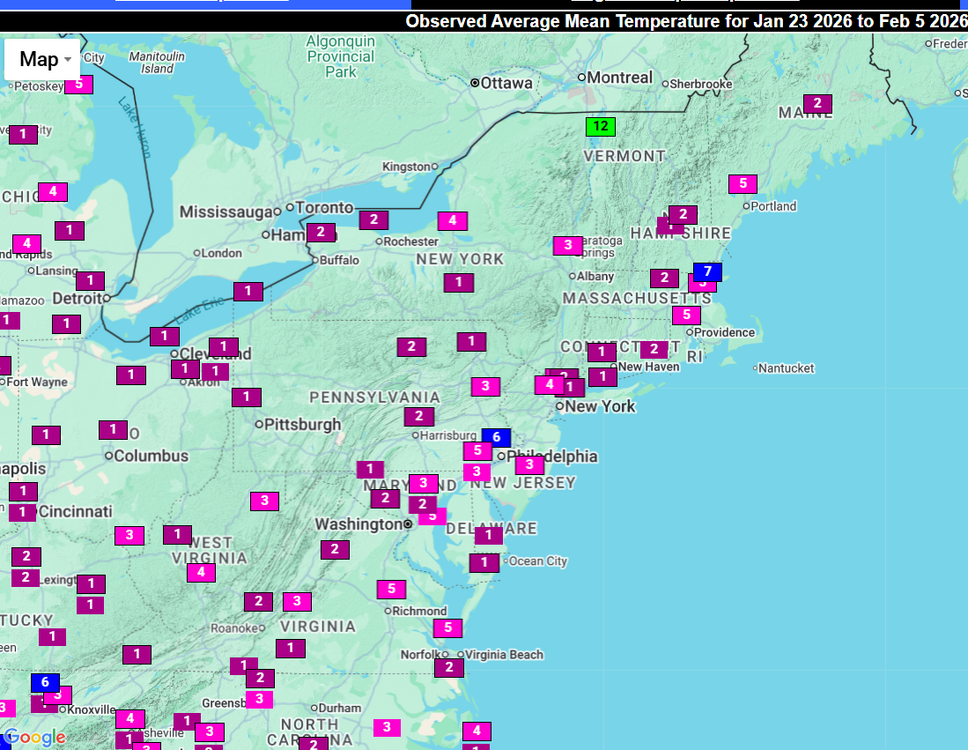
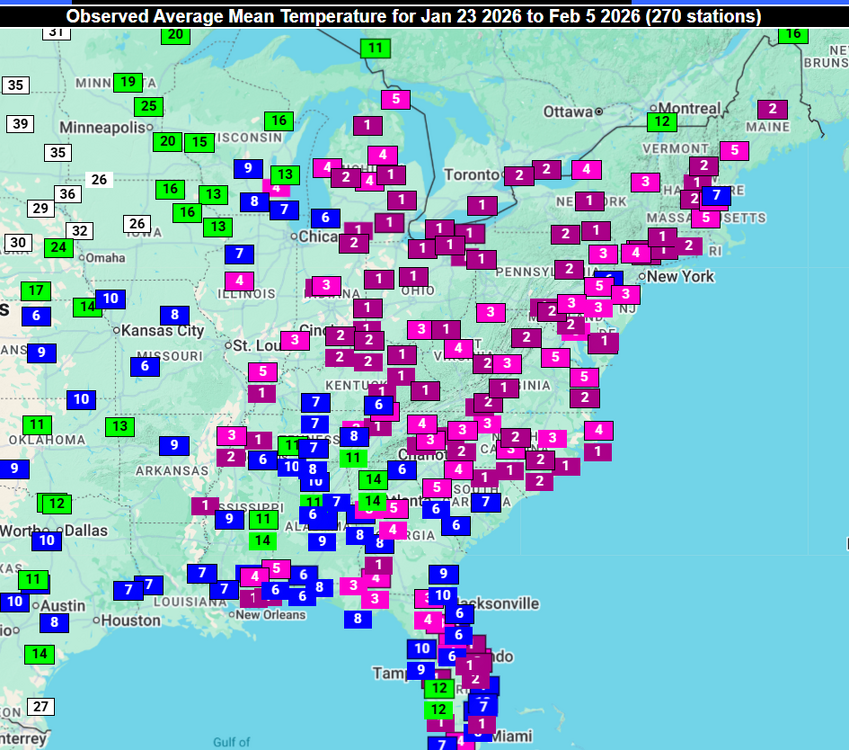
Most of the NE US is in the lowest 5 percentile for cold past two weeks, with many stations in the lowest 1 to 2 percentiles.
-
Top 10 cold period past two and a half weeks for eastern US: https://x.com/wxjerdman/status/2019729810914992195
-
I think mid-next week (Feb 11-12) definitely bears watching. UKMET hinting at it too now. https://x.com/yconsor/status/2019130515606155376
-
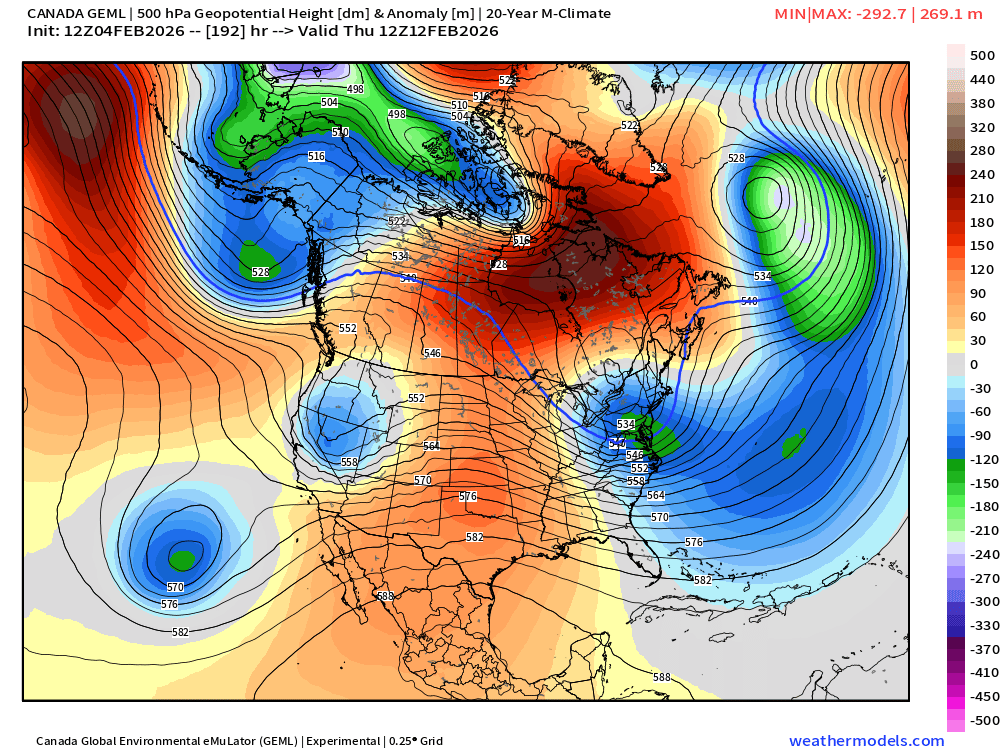
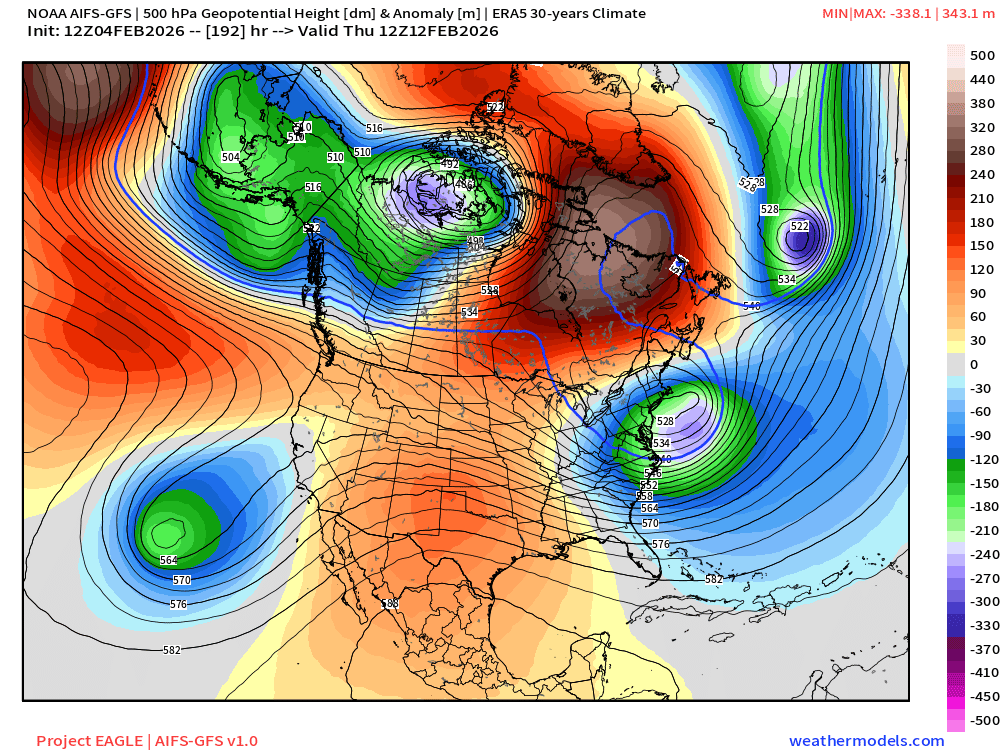
Some of the AI models are now starting to suggest a scenario where the northern stream system on Feb 11-12 cuts off and slows down, underneath a block over NE Canada (held in place by the upper low east of Newfoundland) which connects with ridging in the central US. Low probability scenario for now, but most ensemble guidance at least suggests a northern stream system passing through with light precip during that time.
-
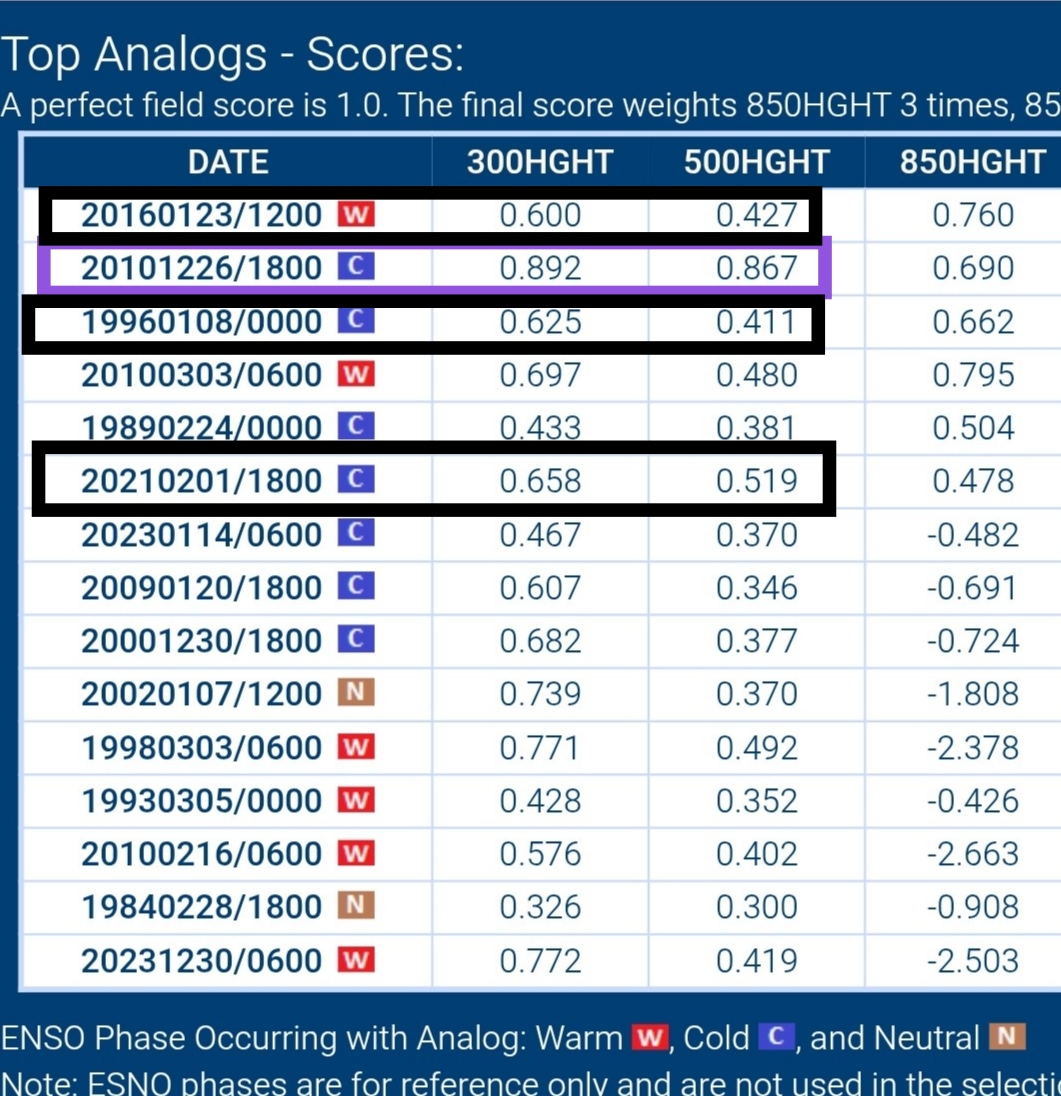
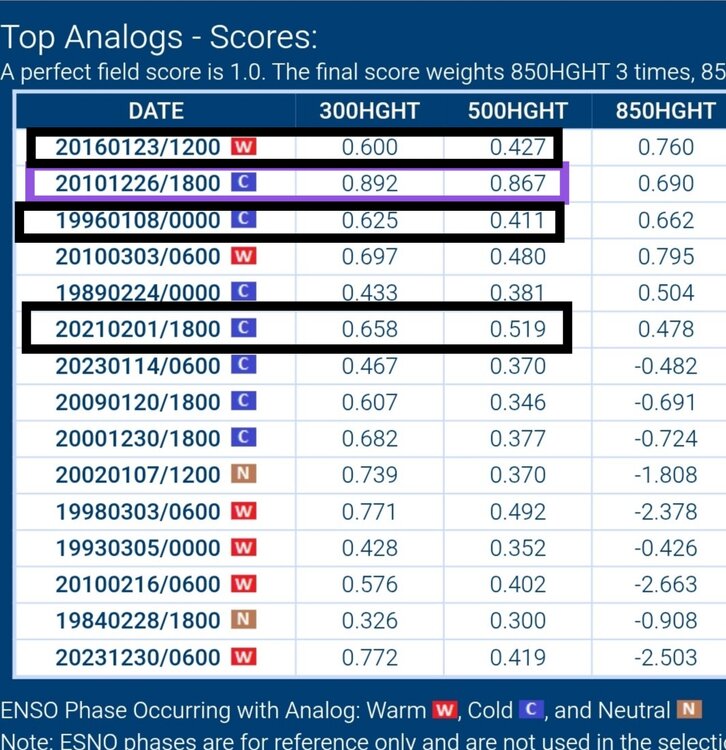
Nice find! For context, this analog set is based on the 0Z GFS run. Feb 1989 was a very heavy (in some cases) record snowstorm from GA to the eastern Carolinas and Delmarva, with heavy snow extending up to coastal NJ. It missed NYC and western LI. Two other MECS are in the top 10: Dec 30, 2000 and Feb 1, 2021. At 500 mb the best match (closest analog) to the setup at day 4 is by far the Boxing Day Blizzard of 2010. Jan 1996, Jan 2016 and Feb 2021 are also respectable matches at 300 mb. https://www.eas.slu.edu/CIPS/ANALOG/DFHR.php?reg=EC&fhr=F096&rundt=2026012800
-
EPS 6z today vs 0z today and 12z yesterday... Baby steps toward a more impactful storm closer to the mid-Atlantic coast. Notice the western US ridge shifts slightly further west and stronger in more updated EPS runs, while the "kicker" shortwave from Hudson Bay to Manitoba/Ontario and MN shifts weaker. Also the TPV drops down further west and the departing upper trough over SE Canada is a little weaker, allowing better height rises over the W. Atlantic and New England ahead of the TPV.
.gif.a04df27f93a15a79ca628ae09ad2bad2.gif)
.gif.affcaf990ac1d64806ea35037ae4b73a.gif)
.gif.b46e6e96633988d43016186cba2842ff.gif)
-
Tomer notes high-end potential here: https://x.com/burgwx/status/2016008474656649645
-
I hear ya. Especially given the perigee on Thu and full moon on Sat (thus astronomically high tides), a slow moving, intense coastal storm could cause serious coastal flooding and beach erosion for NJ and LI.
-
Extreme Cold, Snow & Sleet: SECS 1/24 - 1/26
jconsor replied to TriPol's topic in New York City Metro
RRFS has been doing well overall with the advance of the sleet. It shows the sleet stalling and then retreating slightly next few hours, with mainly snow hanging on for North Shore of LI until around 0-1Z and northern parts of NYC even until 2-3Z. The additional snow it shows from 17Z on is likely slightly overdone, but the idea that central-eastern LI catches up vs. most of NYC makes sense.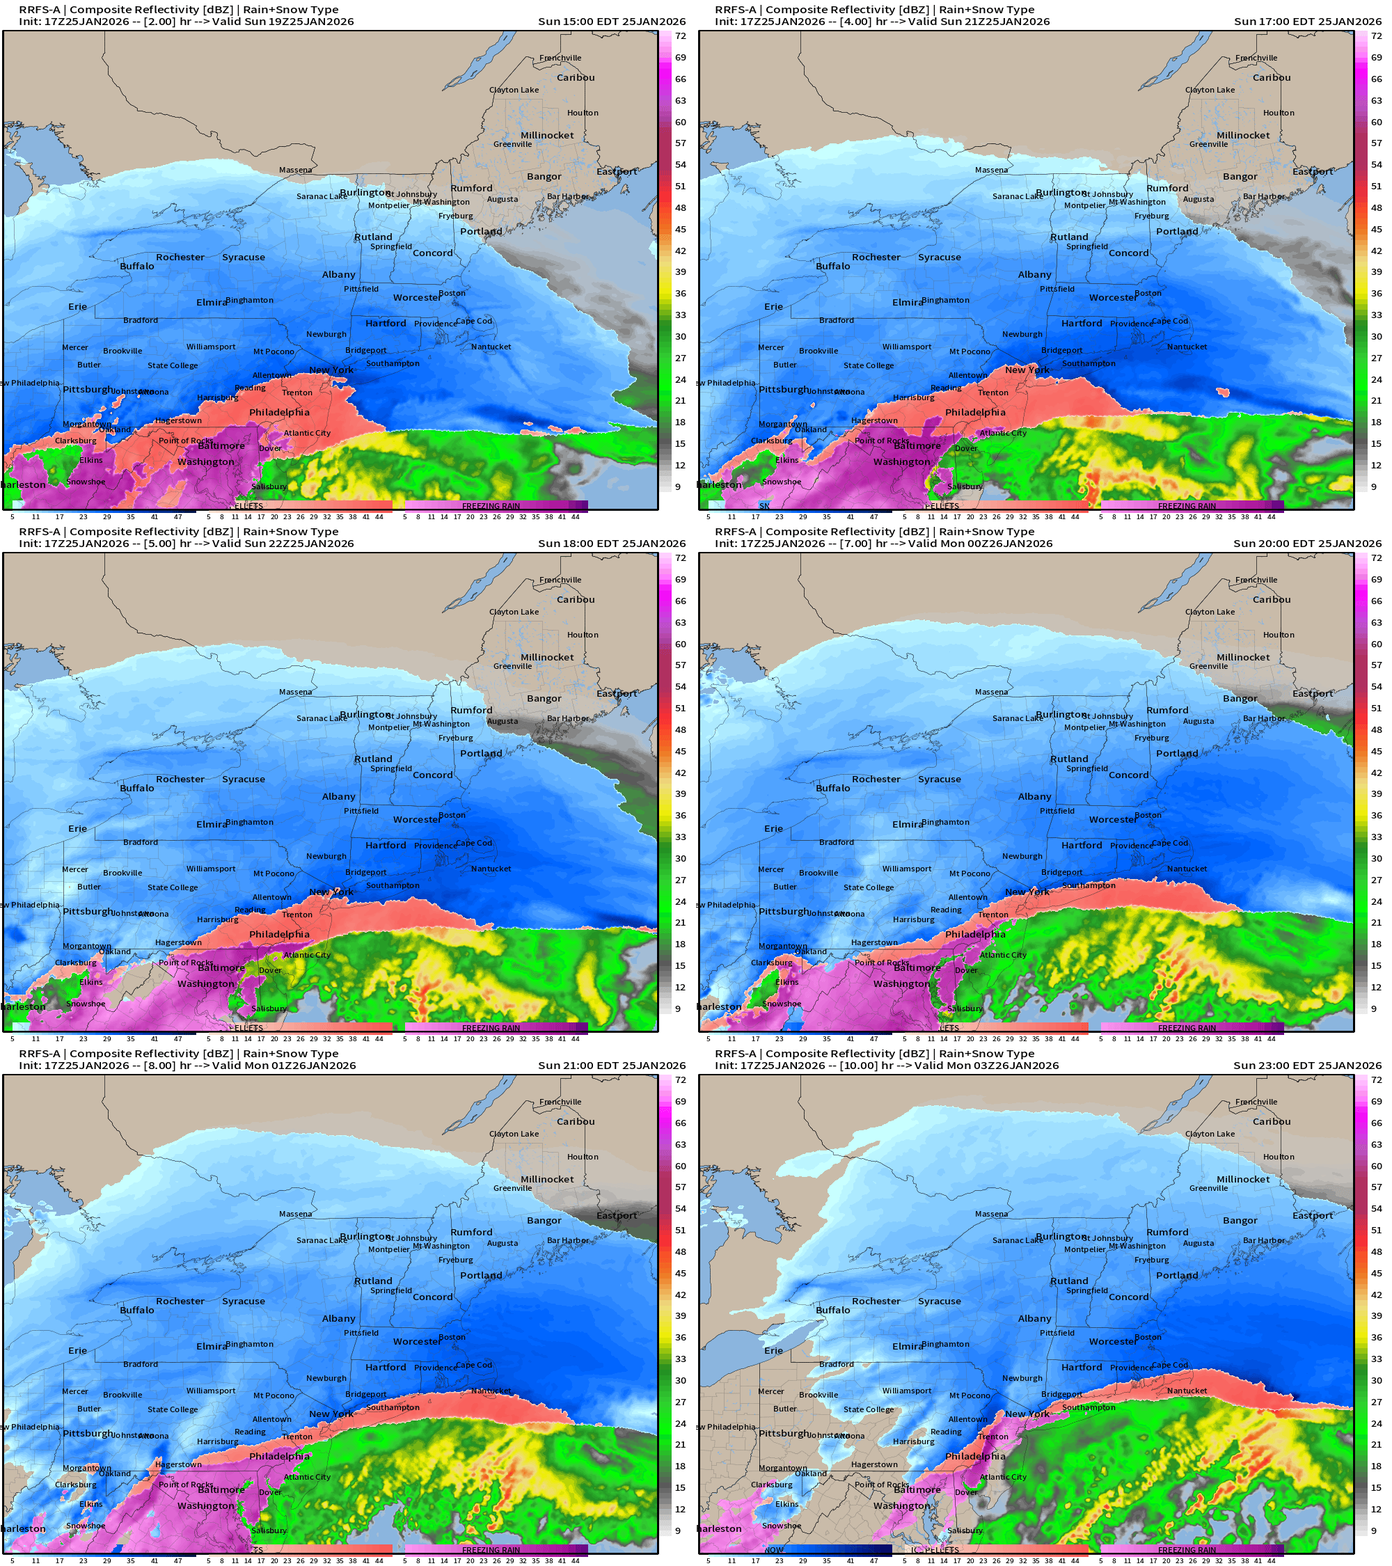
.png.deb1f5c18d0a34294f60612947a4f89d.png)
-
Extreme Cold, Snow & Sleet: SECS 1/24 - 1/26
jconsor replied to TriPol's topic in New York City Metro
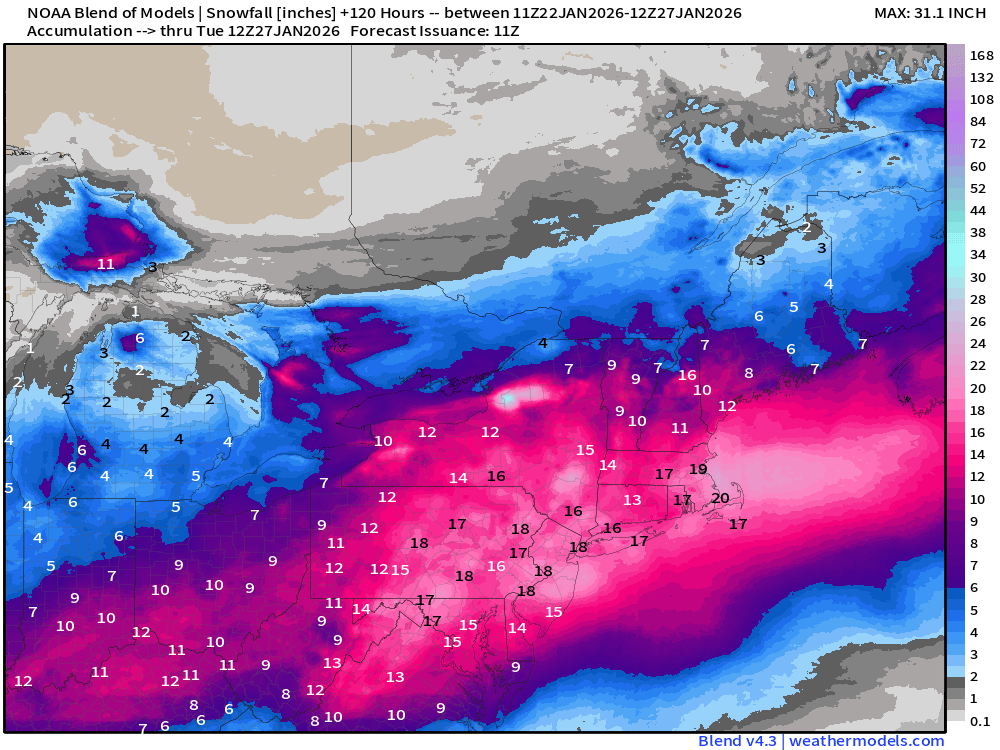
The NBM you posted seems to be using inflated snow-liquid ratios. Compare the NBM version 5 (experimental) with the 4.3 (operational), the same as what you posted. The experimental version 5 snowfall amounts make more sense given the model QPF.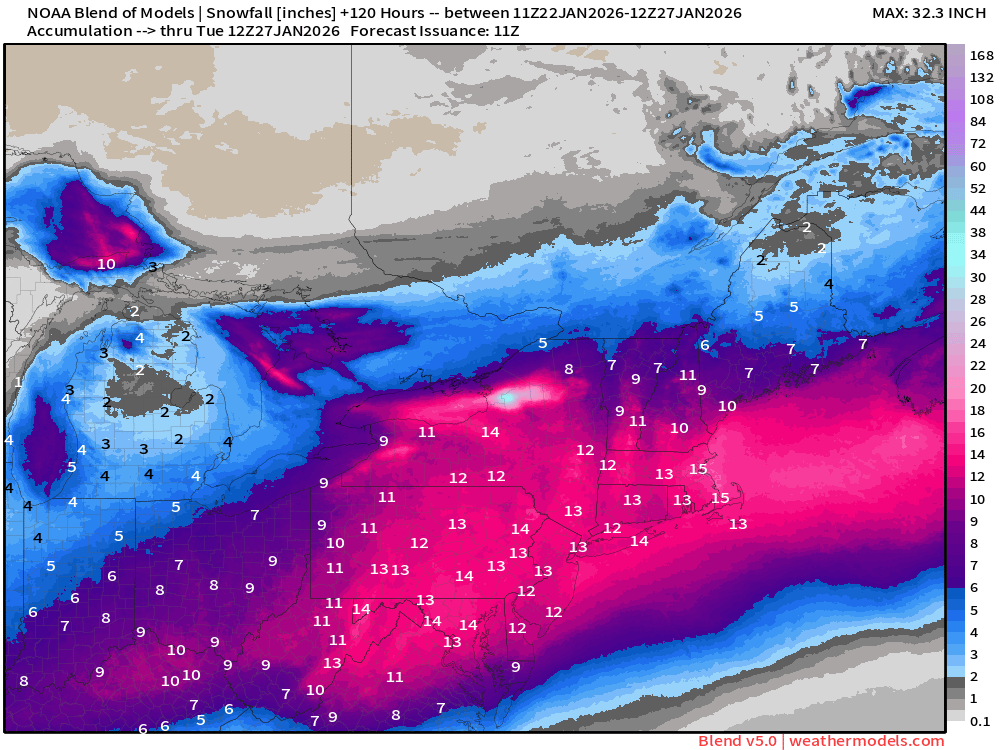
-
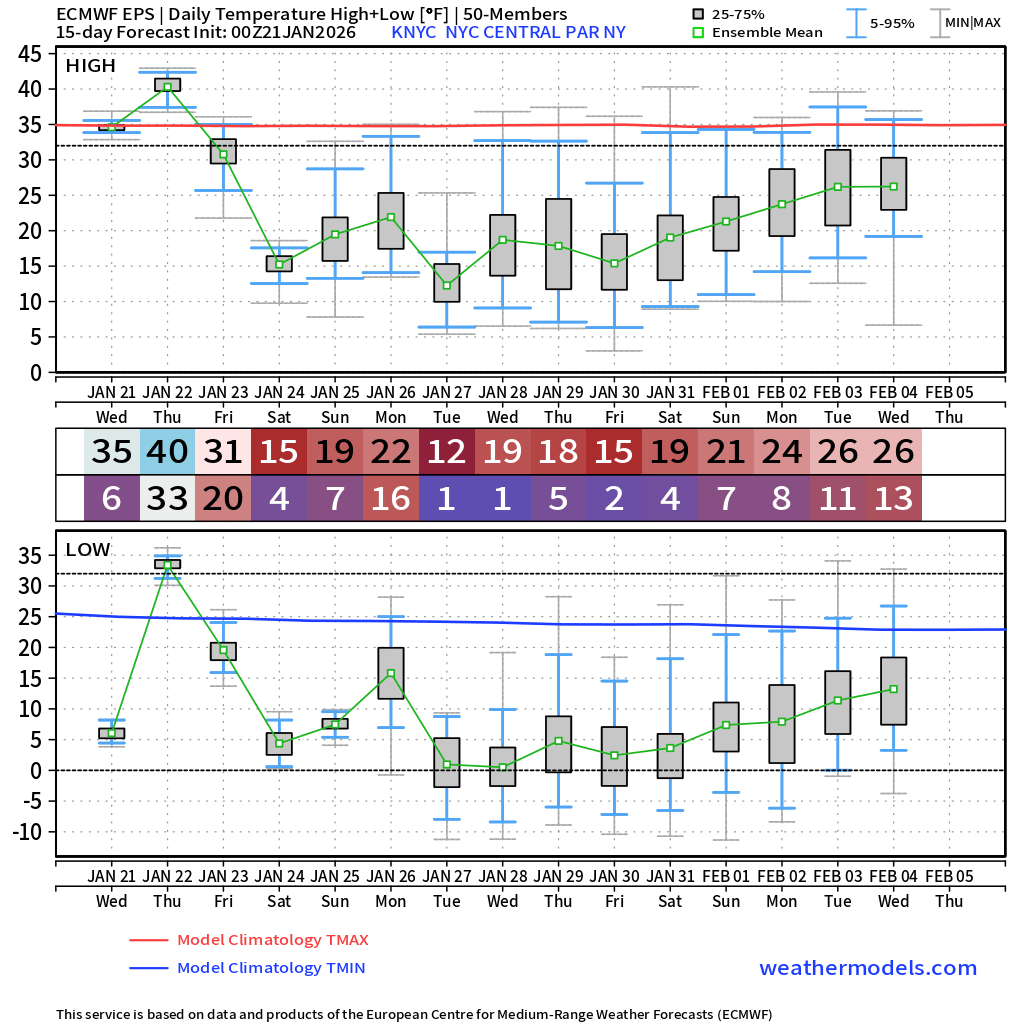
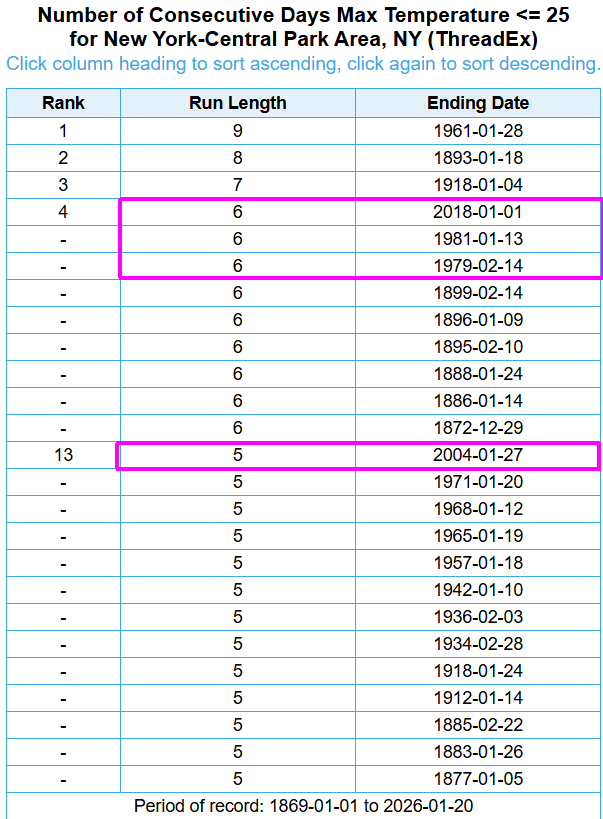
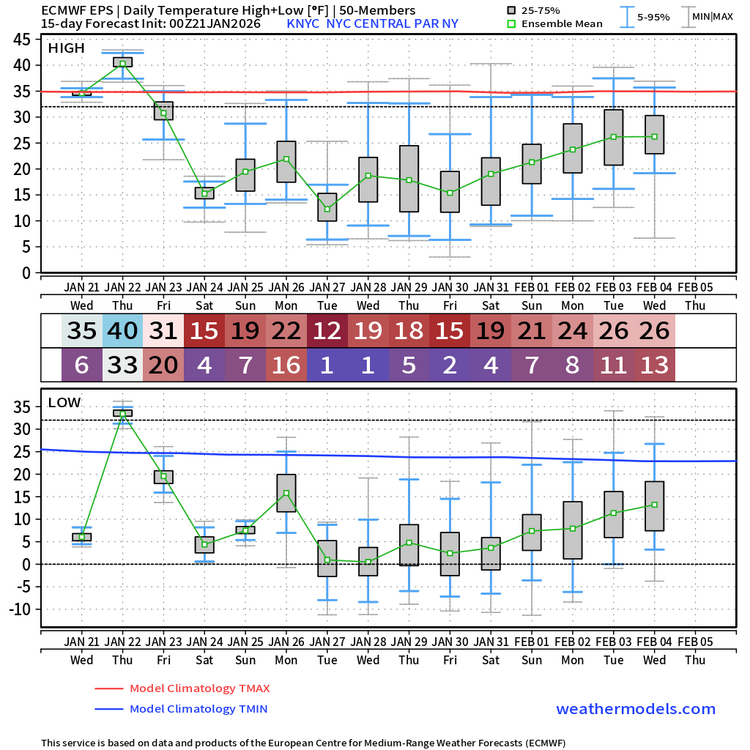
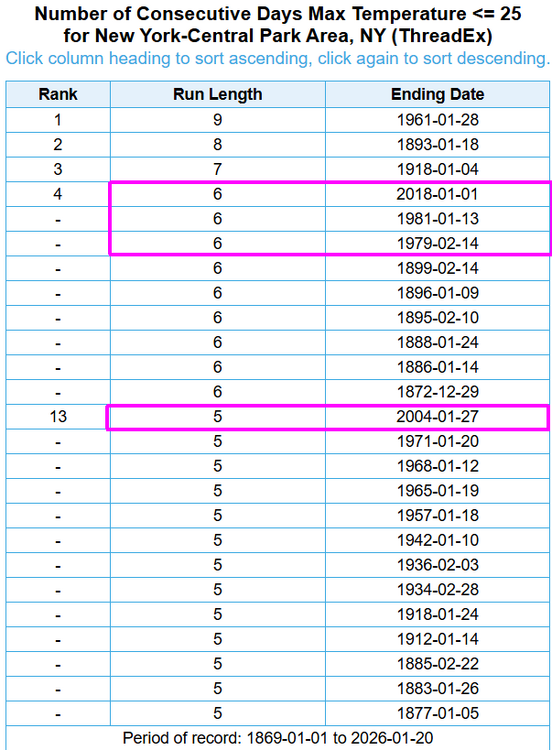
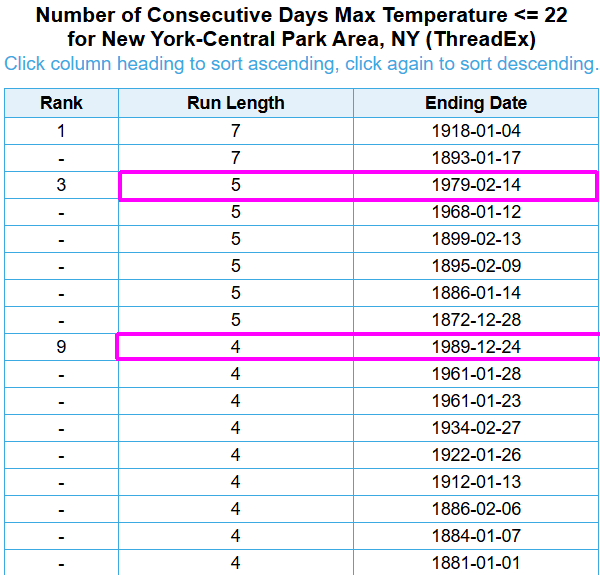
Additionally, we could see several days with highs below 20F behind the Sun-Mon storm at Central Park. Mon's high is highly uncertain - could end up close to 30F if the storm trends further north. Any streak of 5+ days at/below 25F and 4+ days at/below 22F would be quite notable. There have only been four such streaks of <=25F and two such streaks of <=22F at Central Park in the past 50 years!
-
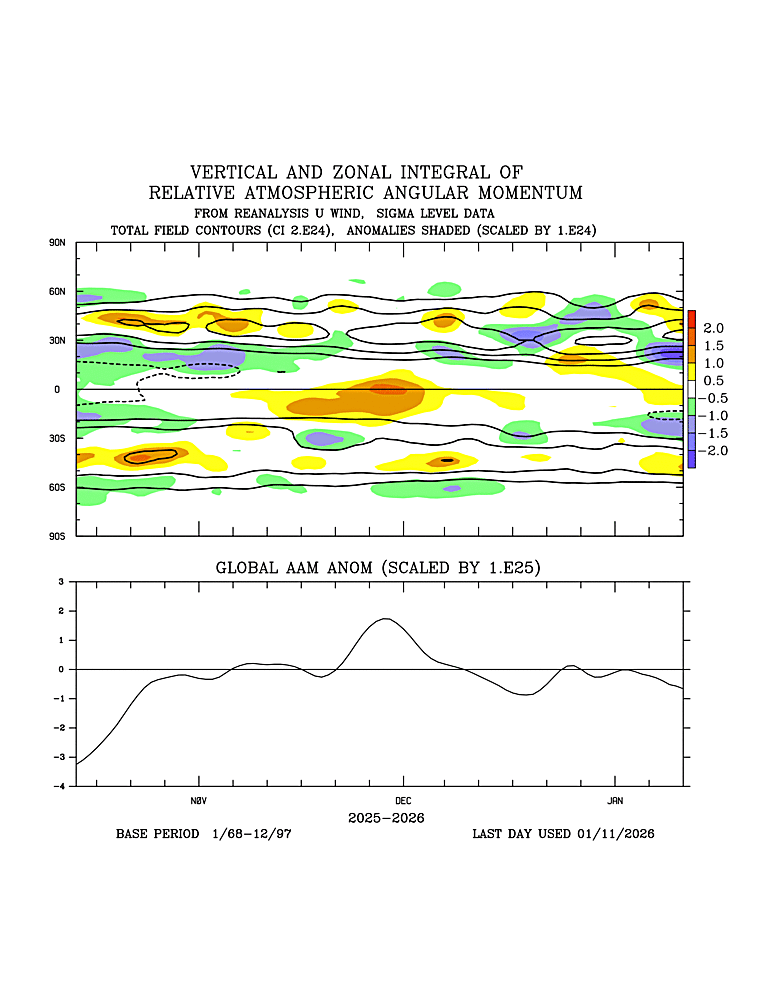
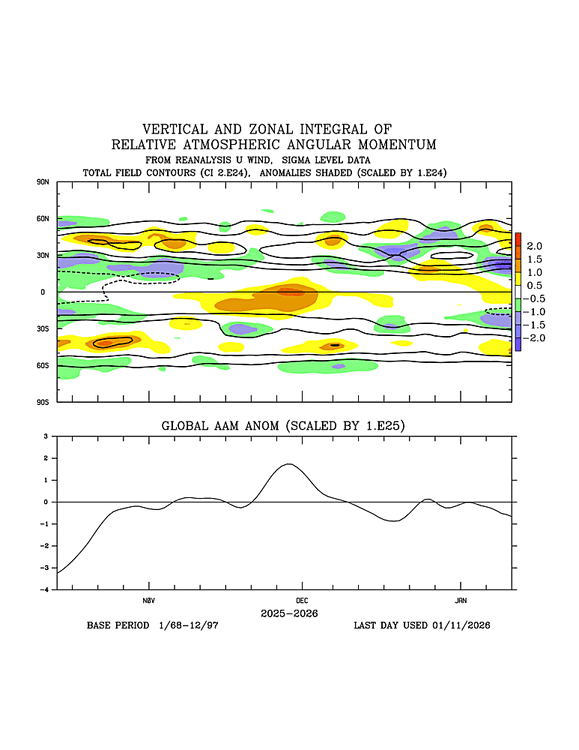
I would say the atmospheric coupling with the La Nina event has been uneven. The AAM has averaged near neutral since Nov, with a notable spike from late Nov to the first few days of Dec. I agree with your last three sentences about La Nina's continued influence in the next month or two. Also, in my experience, the CFS is known to be highly +AAM biased.
-
Getting MJO to phase 7 by mid to late Jan would be helpful. Here are composite for strong MJO phase 7 in Jan - note strong blocking signal from north of AK to NW Canada to Greenland: https://x.com/WorldClimateSvc/status/2006751440753316061


-
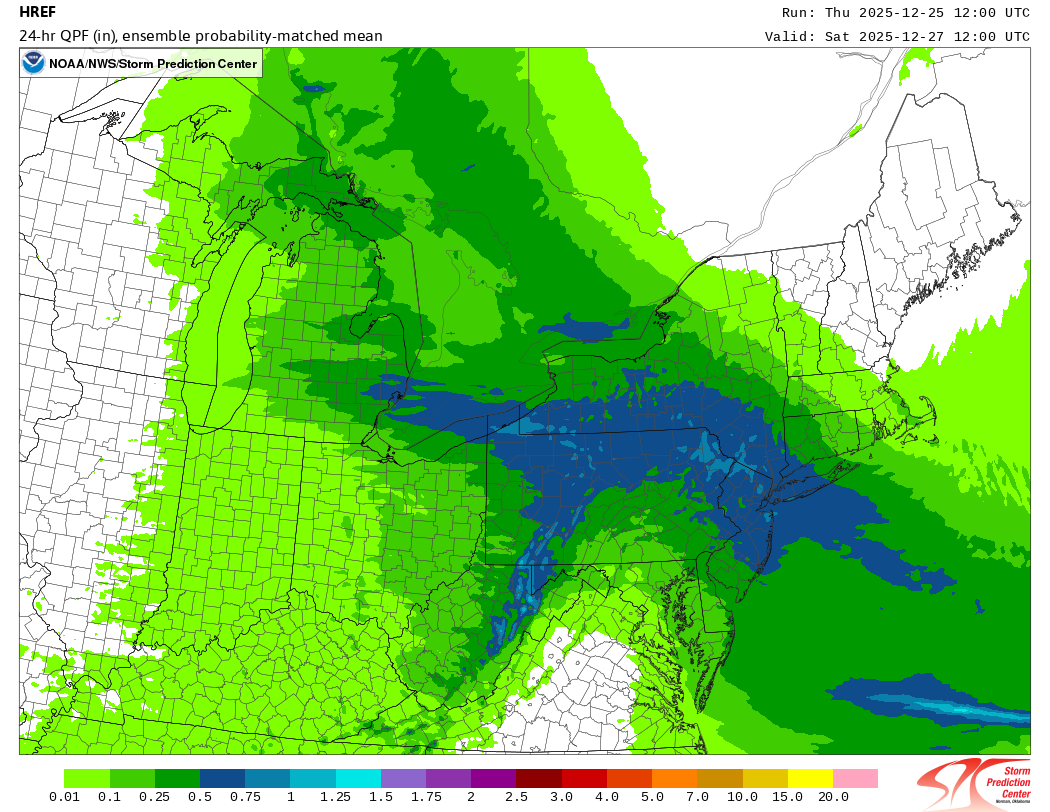
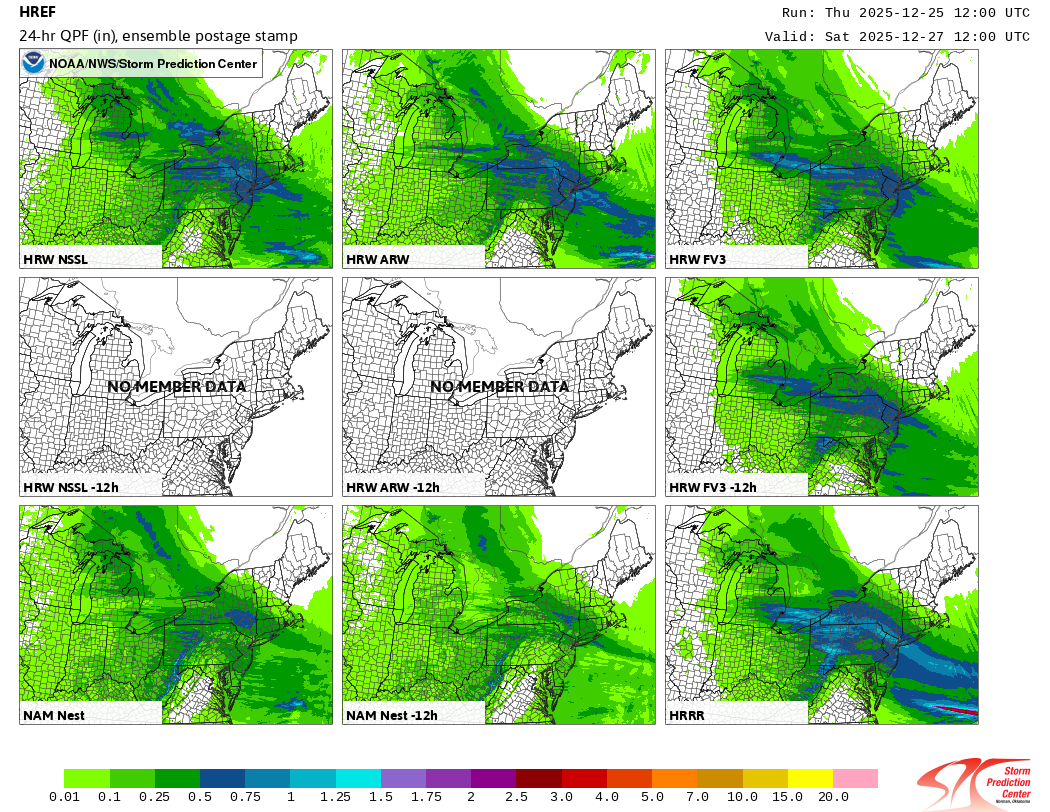
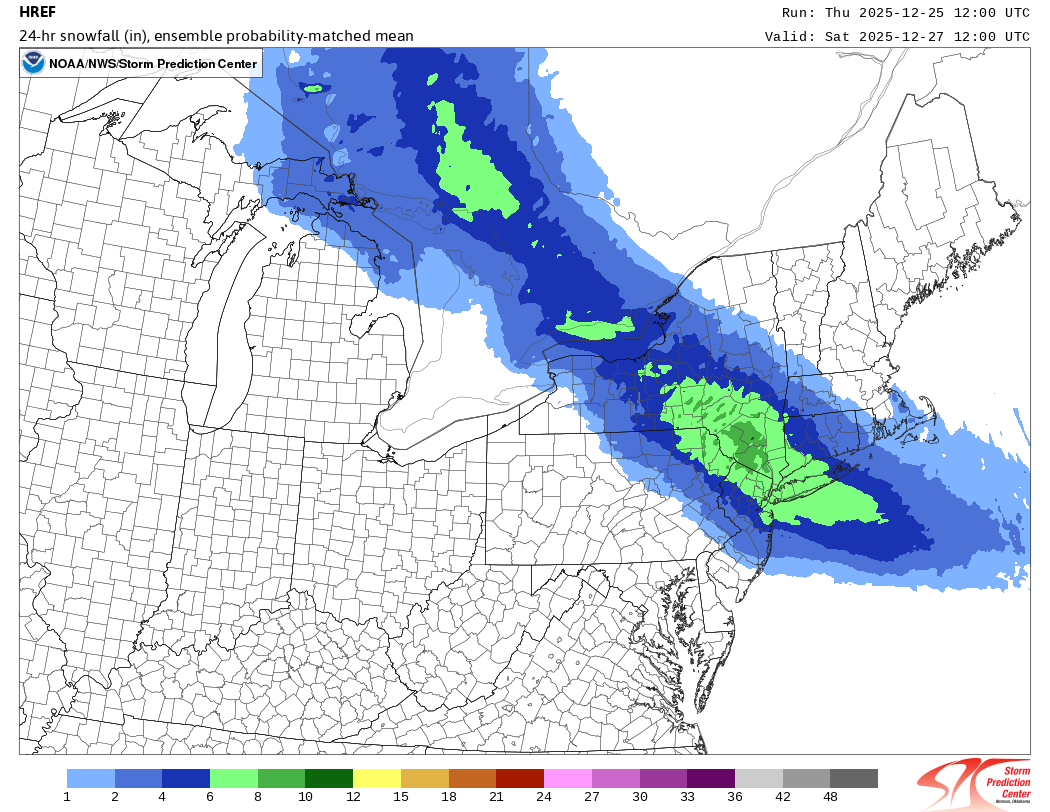
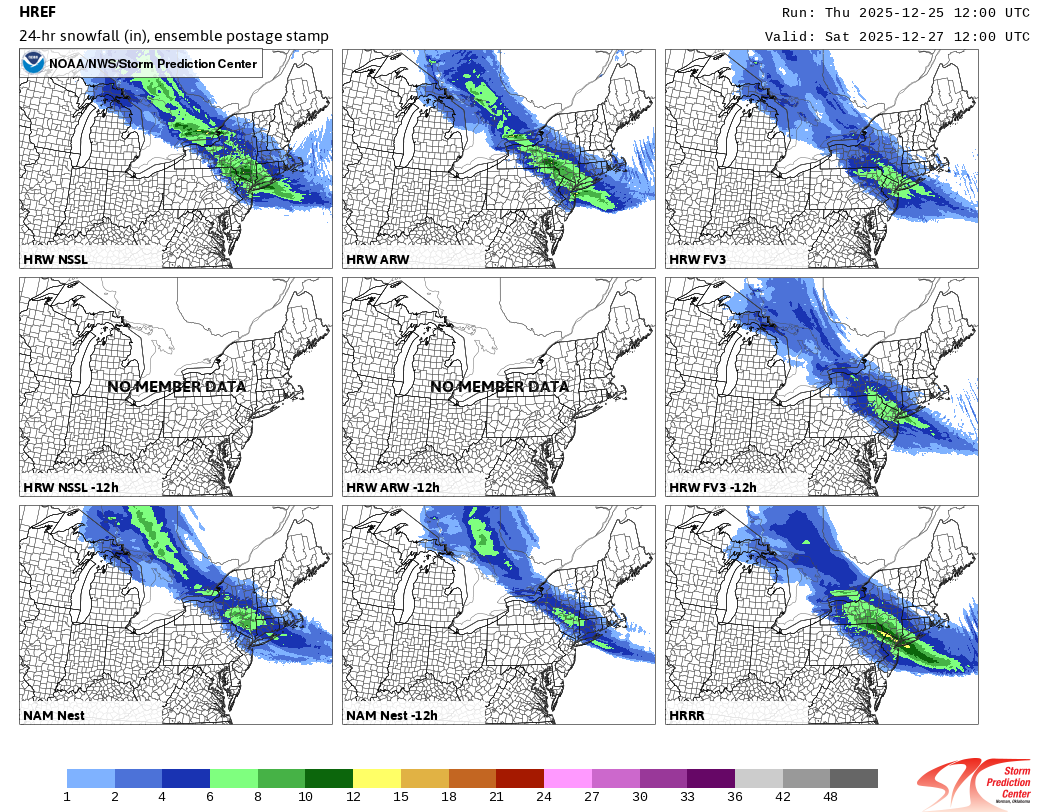
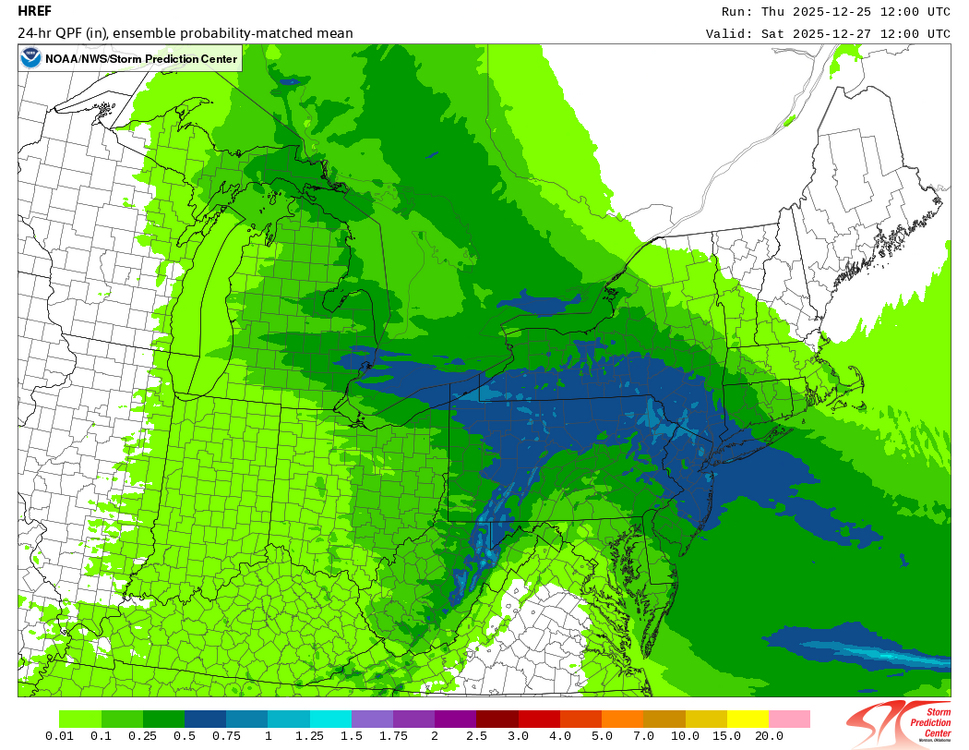
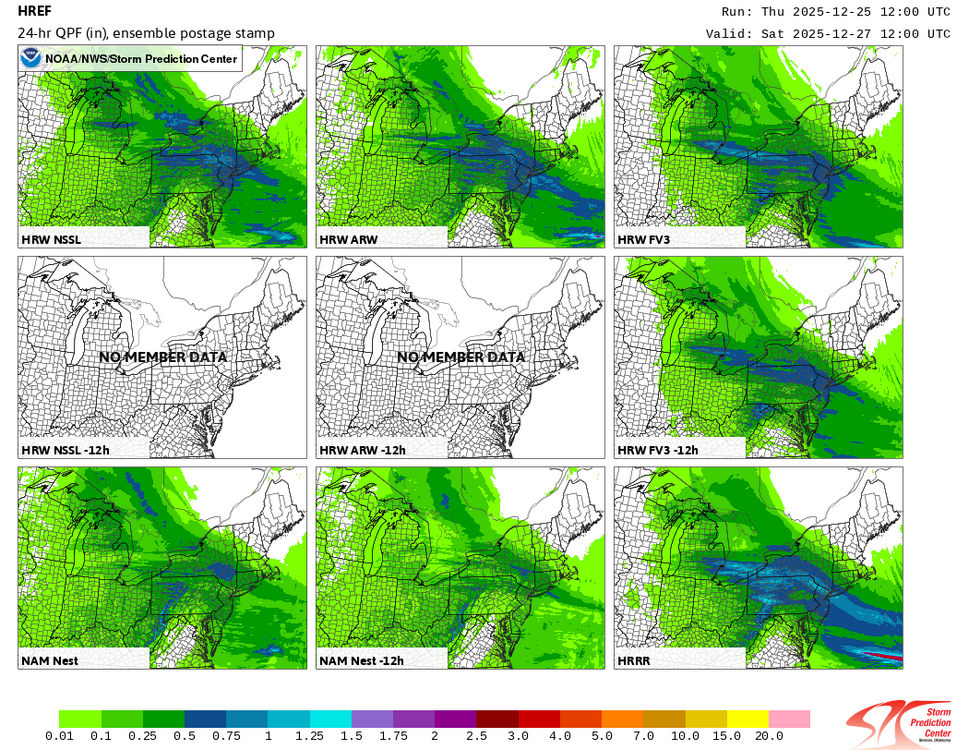
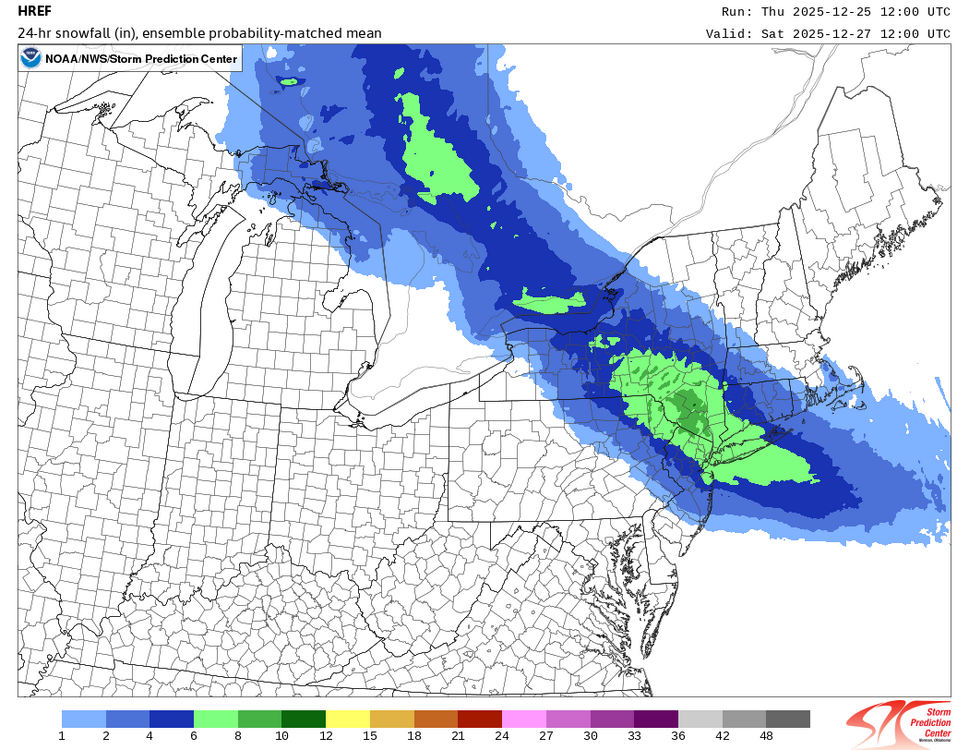
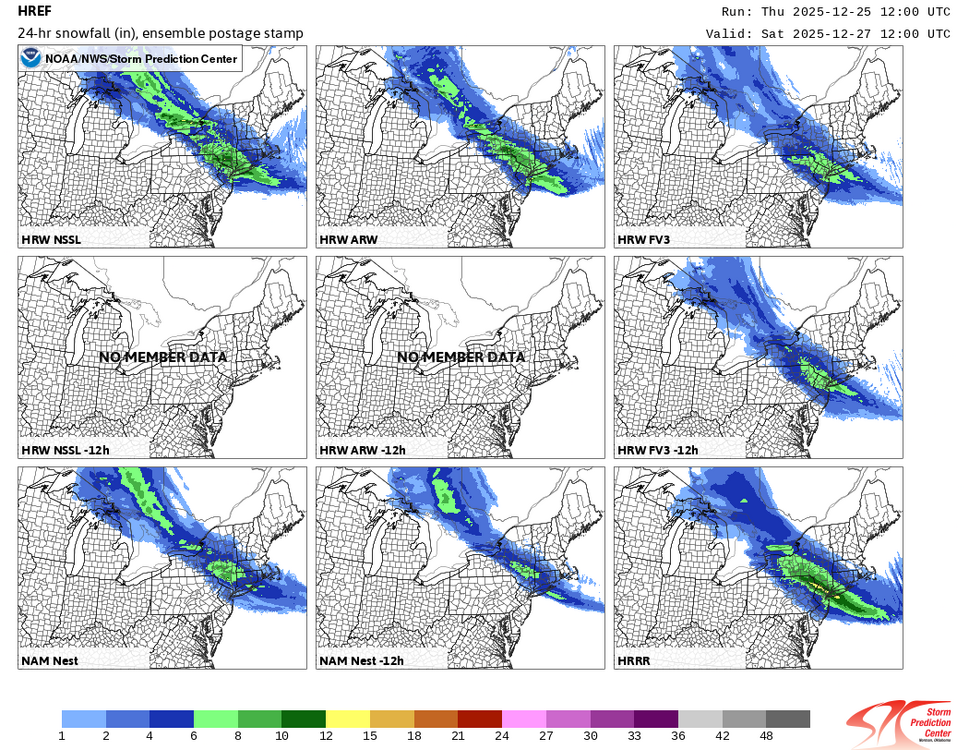
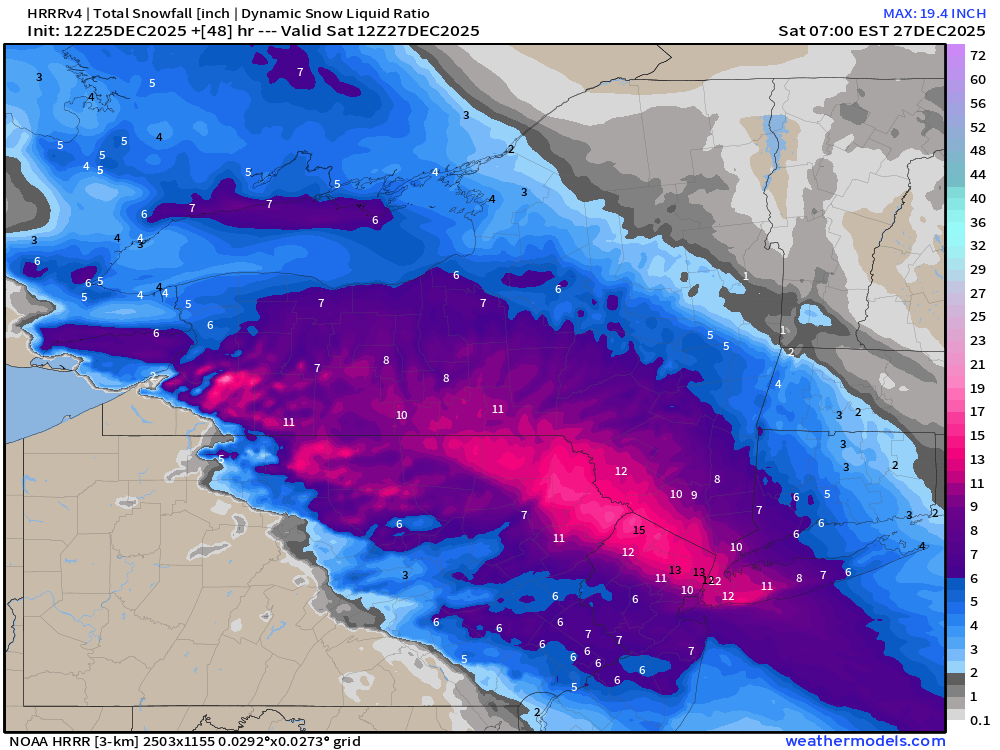
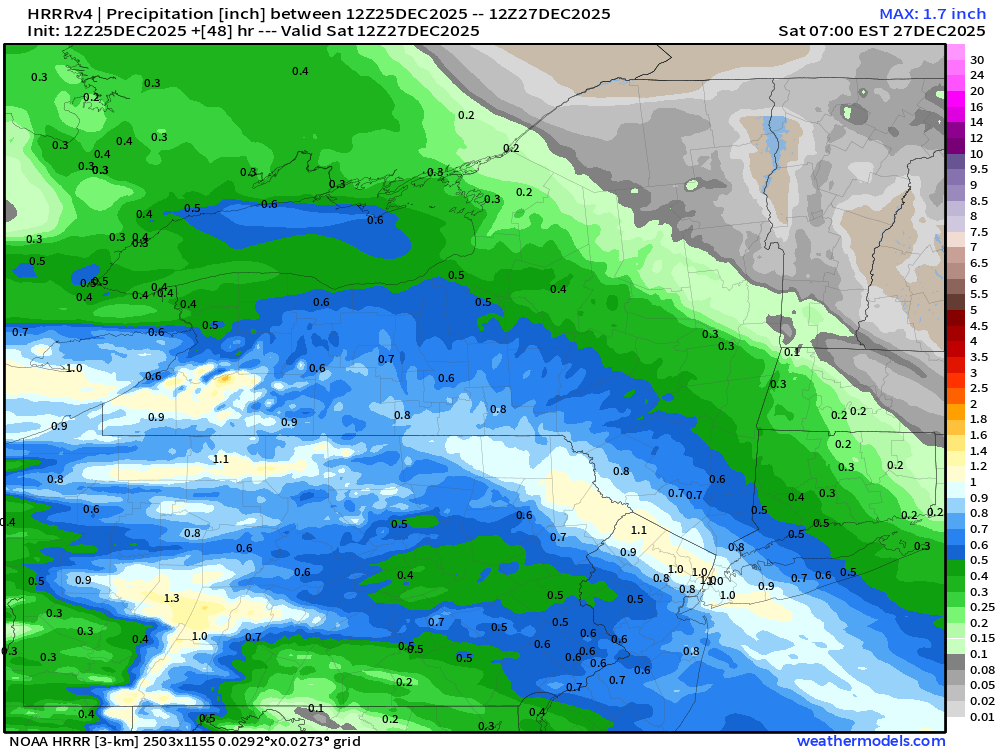
Aside from the 12z and 0z NAM, which look unreasonable and lack a focused WNW-ESE area of heavier precip, there is a good consensus of a peak QPF axis around 0.75-0.8" extending from roughly the PA/NJ/NY border ESE toward NYC and the western third of LI. However in reality the peak QPF axis will likely be more narrow than shown by the HREF. The HREF snowfall amounts are often overdone, but given that I expect ratios of 12 to 13:1 even in NYC and Nassau County, I think they are overall pretty reasonable here. I would conservatively go with 5-8" from Orange, Rockland and Westchester counties SE into Bergen and Passaic Counties in NJ, NYC, Nassau and W. third of Suffolk. Could see local amounts up to 10-12" where best banding sets up (likely N of NYC).
-
The HRRR tends to be too wet at this range, so precip amounts are likely somewhat overdone. The snow map is using dynamic snow:liquid ratio calculated by the HRRR. What is interesting is the 12 to 13:1 ratios from western LI and NYC to NE NJ.
-
https://lab.weathermodels.com/models/blend/blend_precip.php has it if you have a subscription.
-
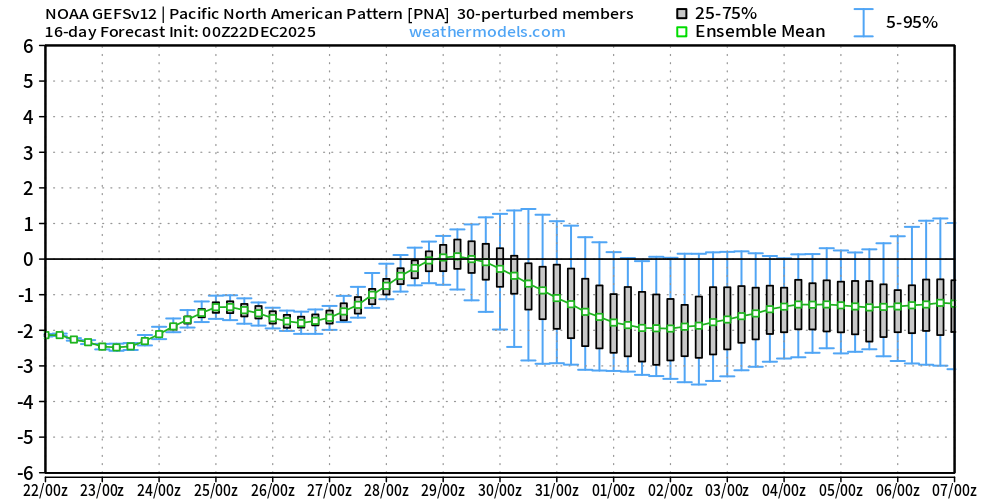
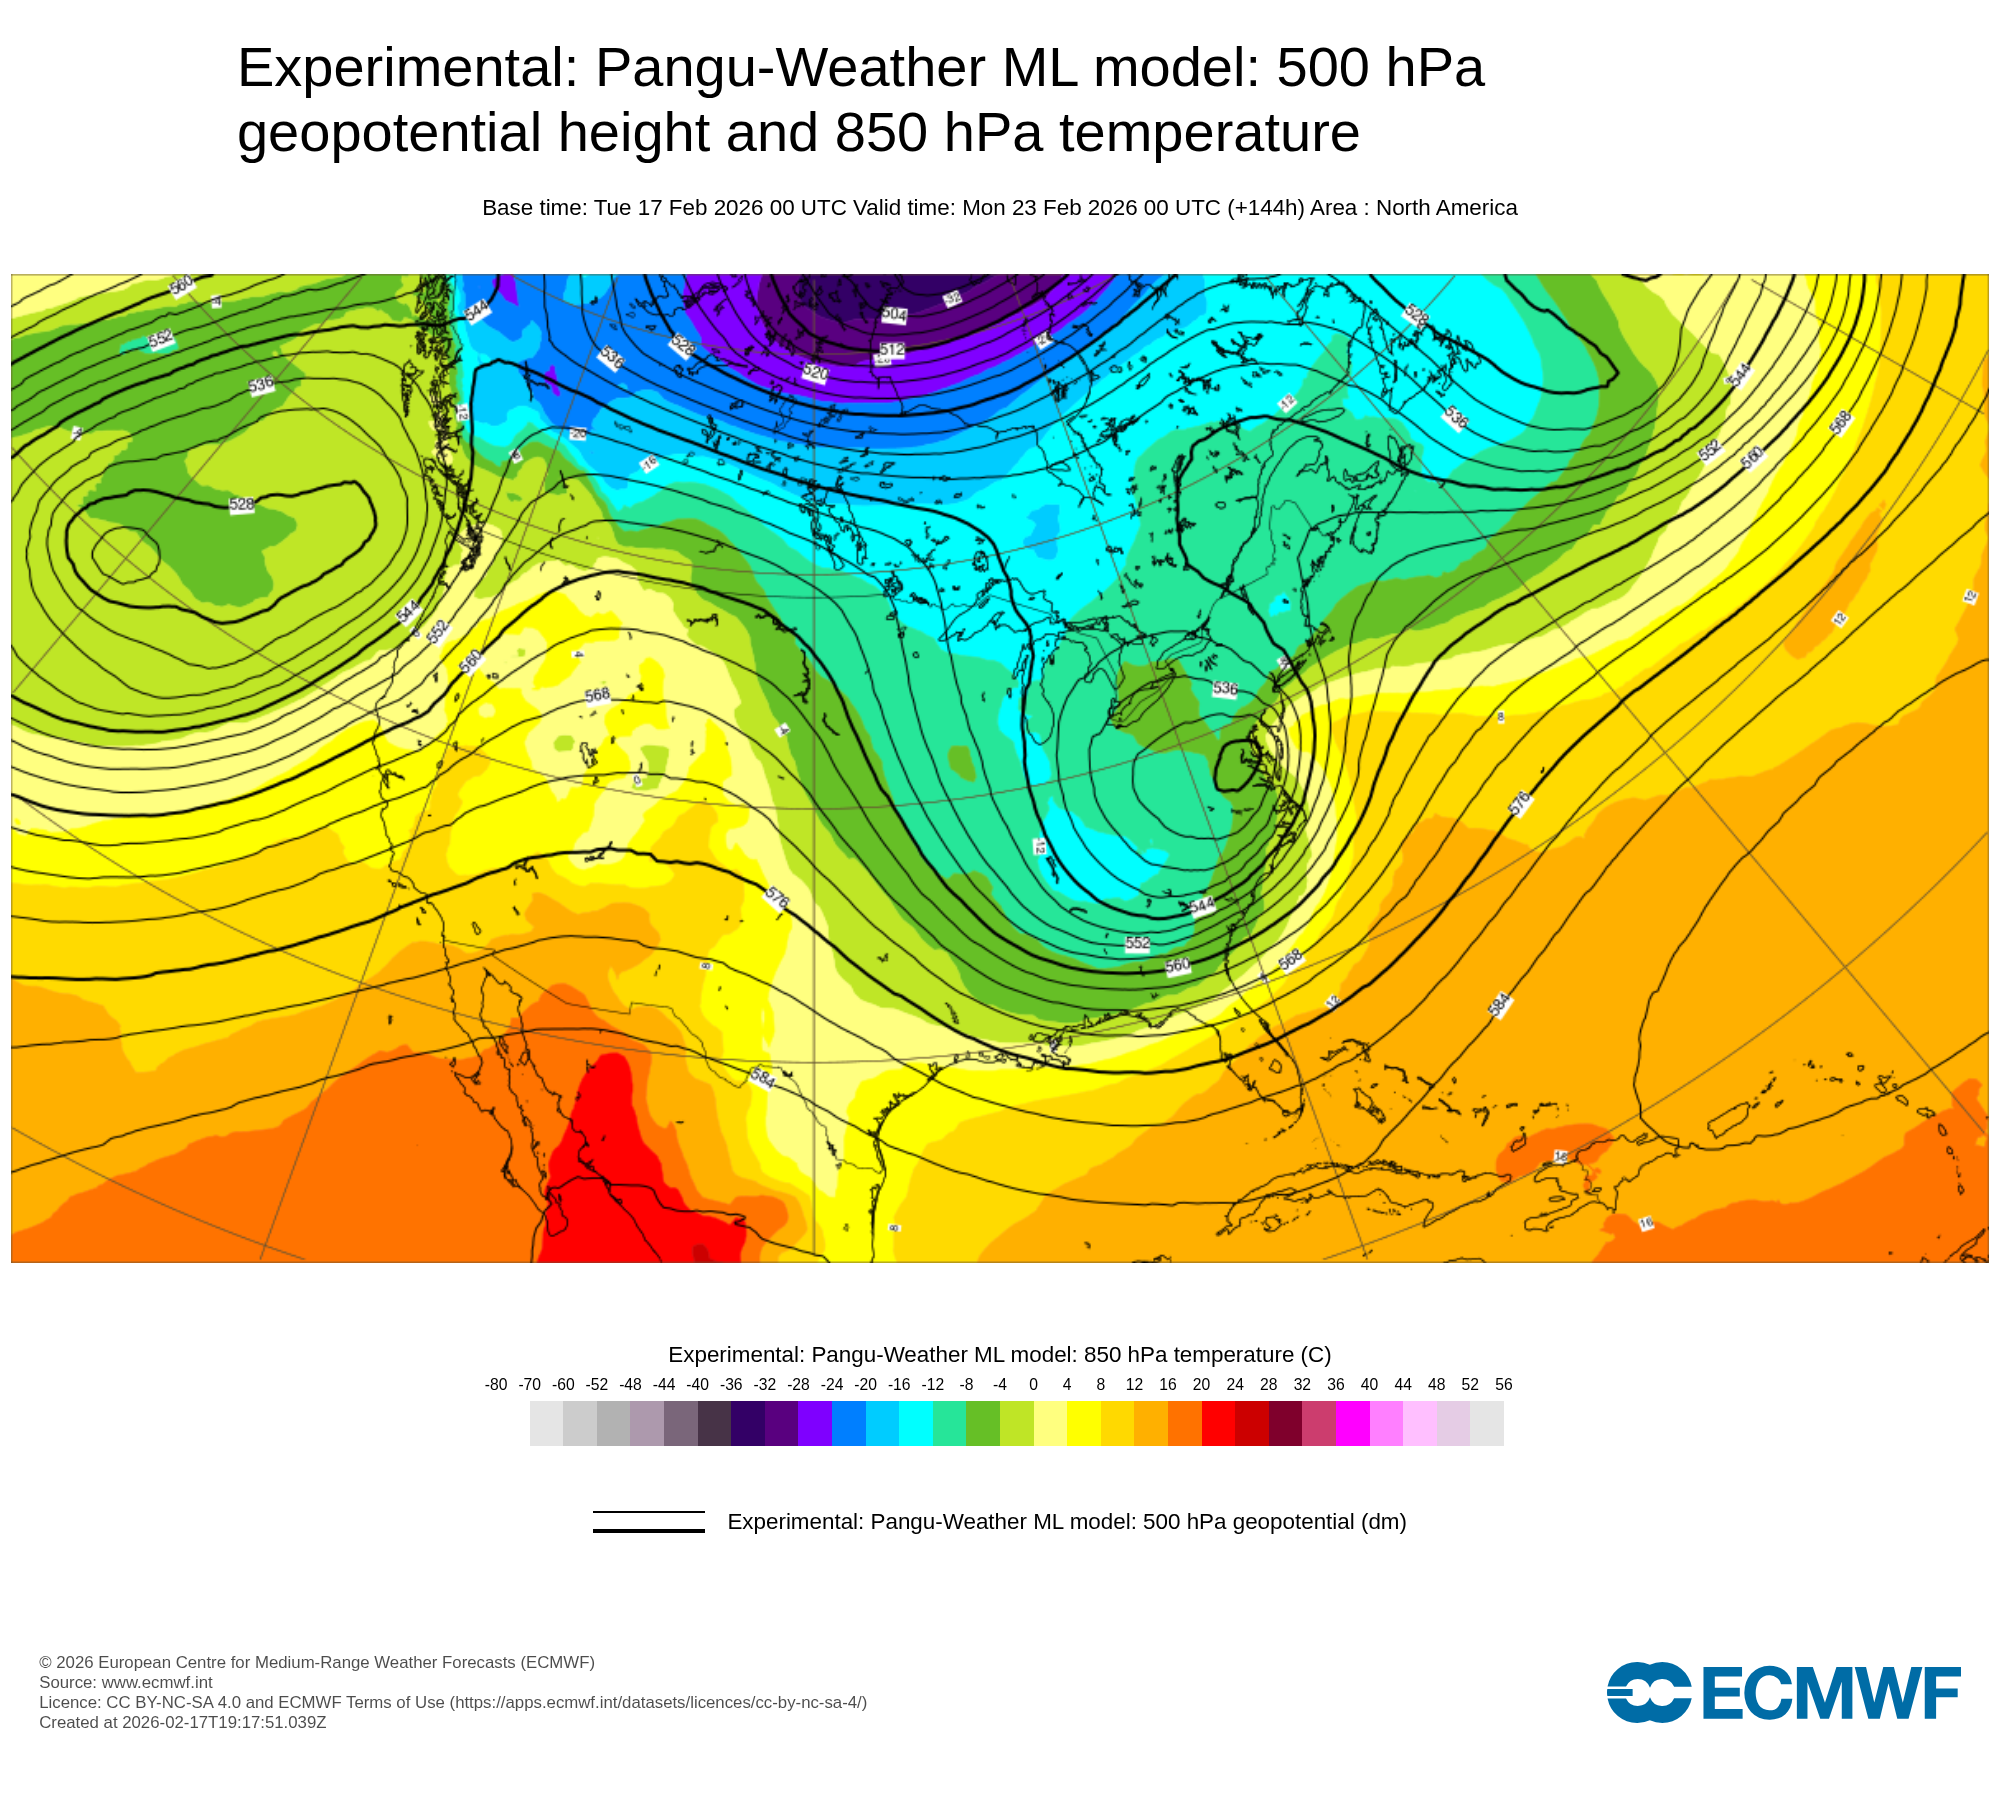
Firstly, I have noticed that the CPC charts often run a day behind. And yesterday's GEFS had the PNA significantly more negative than today's in the Dec 29-Jan 3. Secondly, the WeathermModels PNA chart looks very similar to the WeatherBell one.


.gif.f47dc26460d8986c855b15b25da5fe37.gif)