jconsor
-
Posts
1,016 -
Joined
-
Last visited
Content Type
Profiles
Blogs
Forums
American Weather
Media Demo
Store
Gallery
Everything posted by jconsor
-
MJO phases 5 and 6 are far from a guarantee of warmth in the eastern US. https://x.com/commoditywx/status/1866191470287286392 https://x.com/bamwxcom/status/1866093279948763384
-
Per Eric Webb, the PDO has limited influence and limited usefulness for subseasonal predictability (especially in a winter like this with a strong Indo-W Pacific warm pool). https://x.com/webberweather/status/1864088518886322455 https://x.com/webberweather/status/1864091992386605400 https://x.com/webberweather/status/1864095069449699705 https://x.com/webberweather/status/1864150597710369022 Also interesting comments on PDO's limited usefulness as a teleconnection here: https://x.com/_WxPhil_/status/1864148237403263157
-
2024 Atlantic Hurricane Season
jconsor replied to Stormchaserchuck1's topic in Tropical Headquarters
https://x.com/yconsor/status/1850618329804730523 -
Some short-term drought relief possible this weekend: https://x.com/yconsor/status/1848326240068837640
-
Thread on important short-term northward/stronger trends noted regarding Beryl, and how this influences her potential TX/MX impacts: https://x.com/yconsor/status/1808853711629746332
-
@bluewave Nice model bias charts! Can you please provide the link for them? Thanks.
-
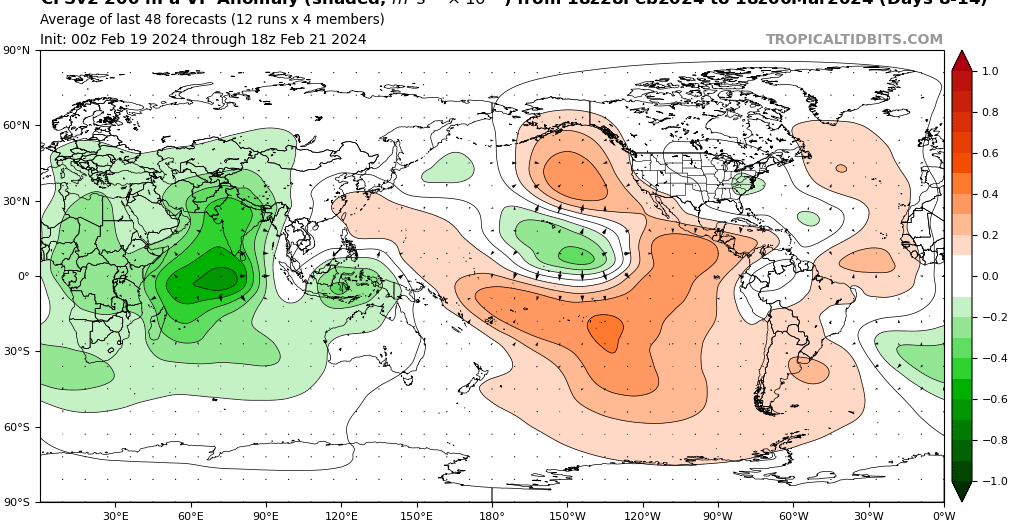
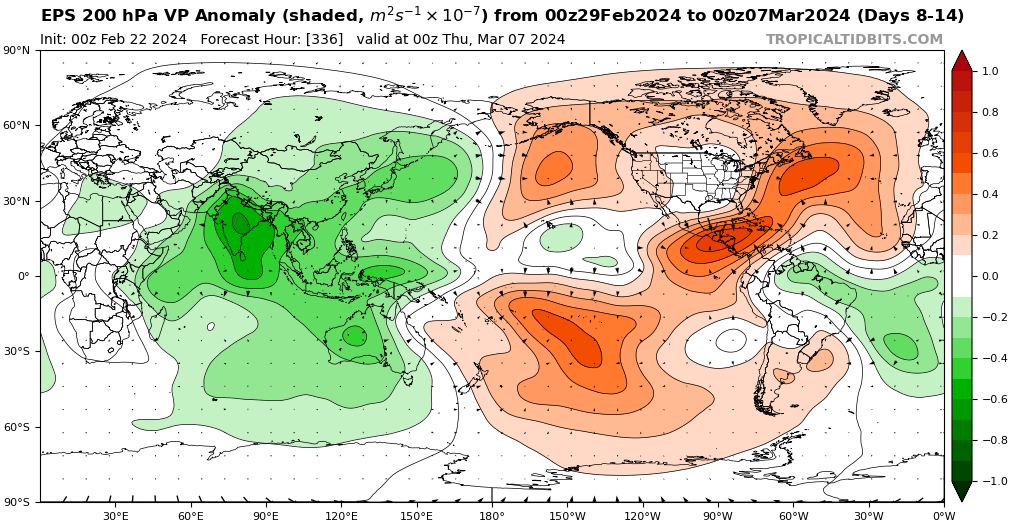
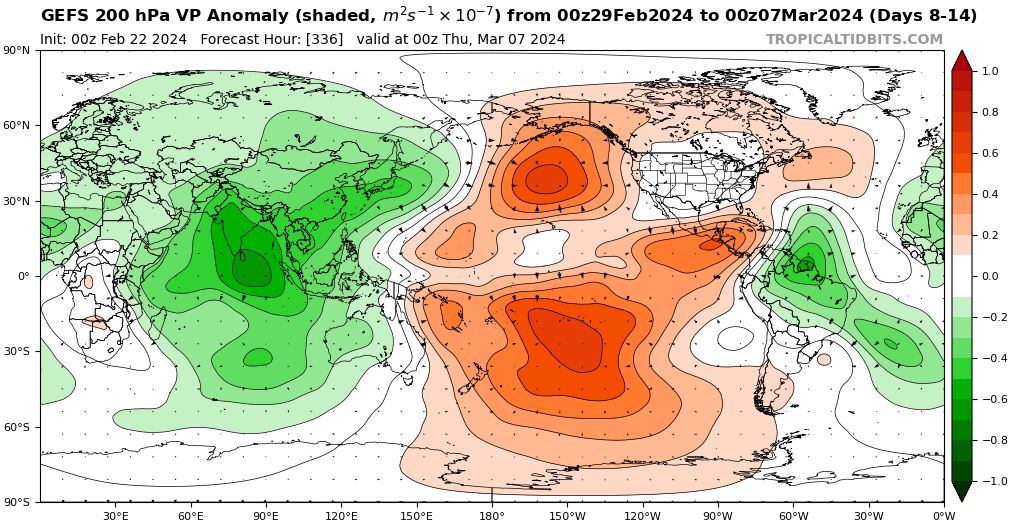
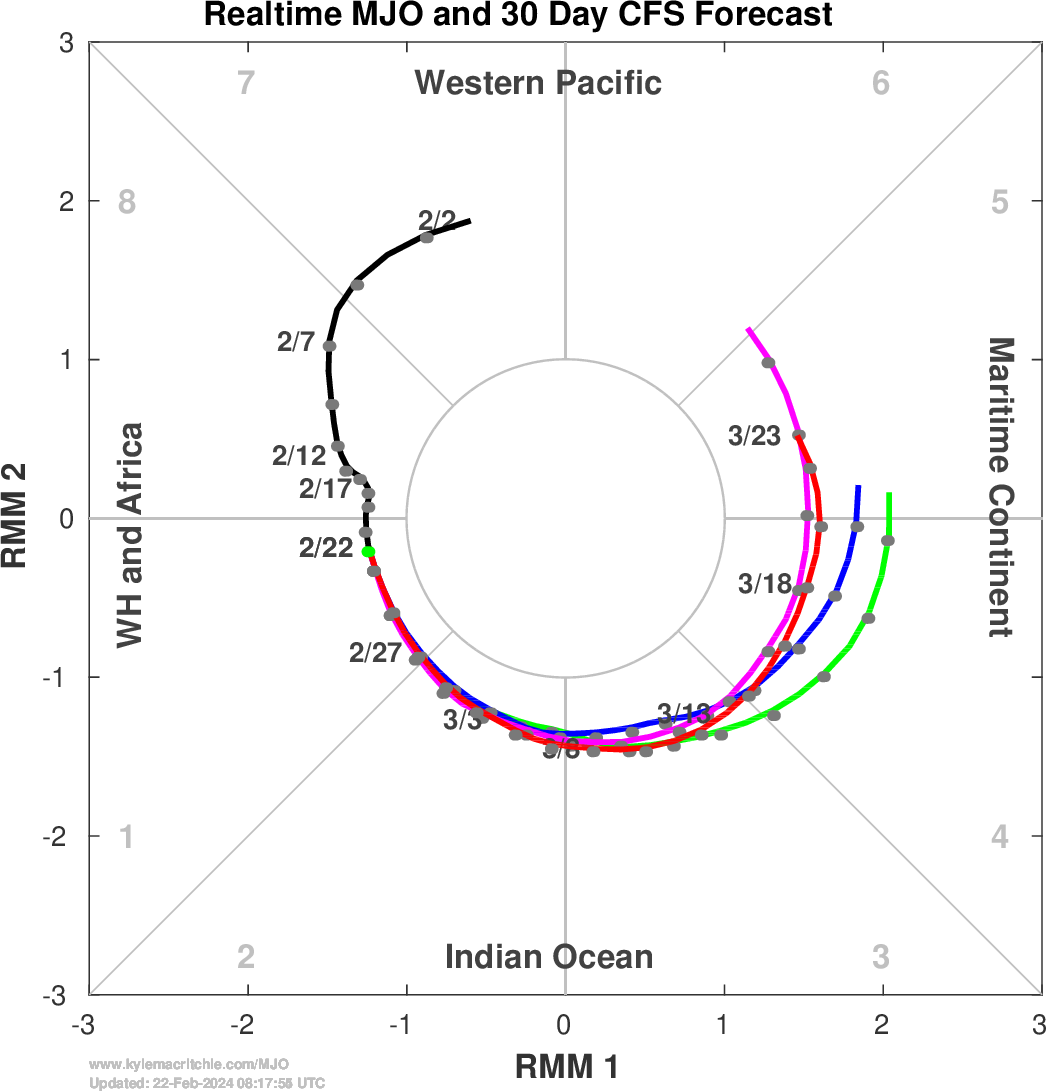
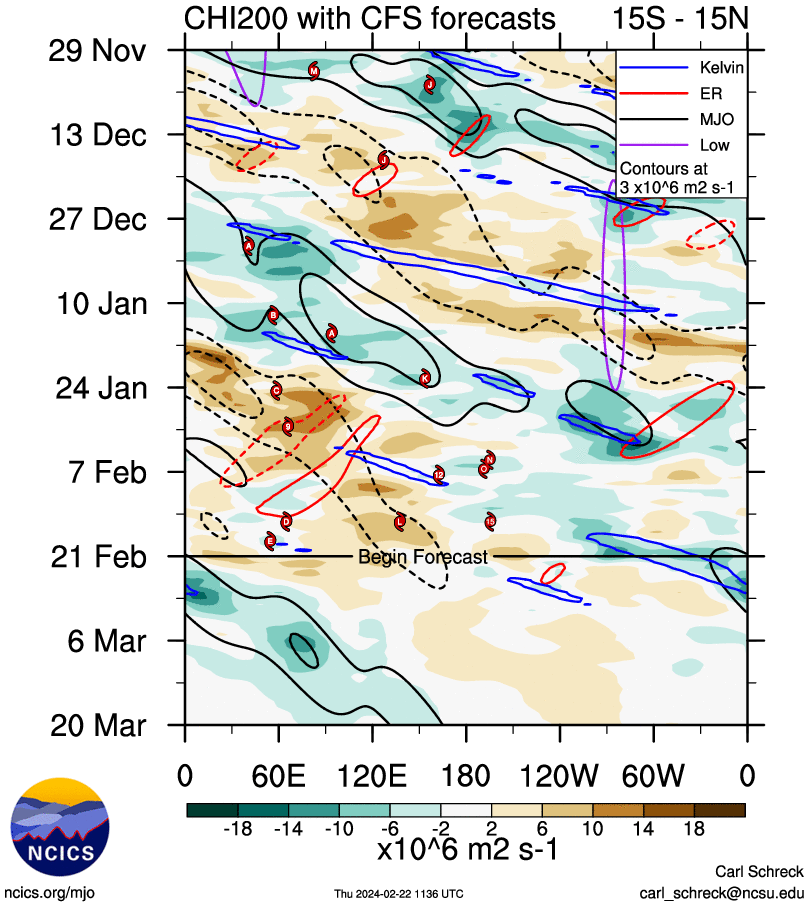
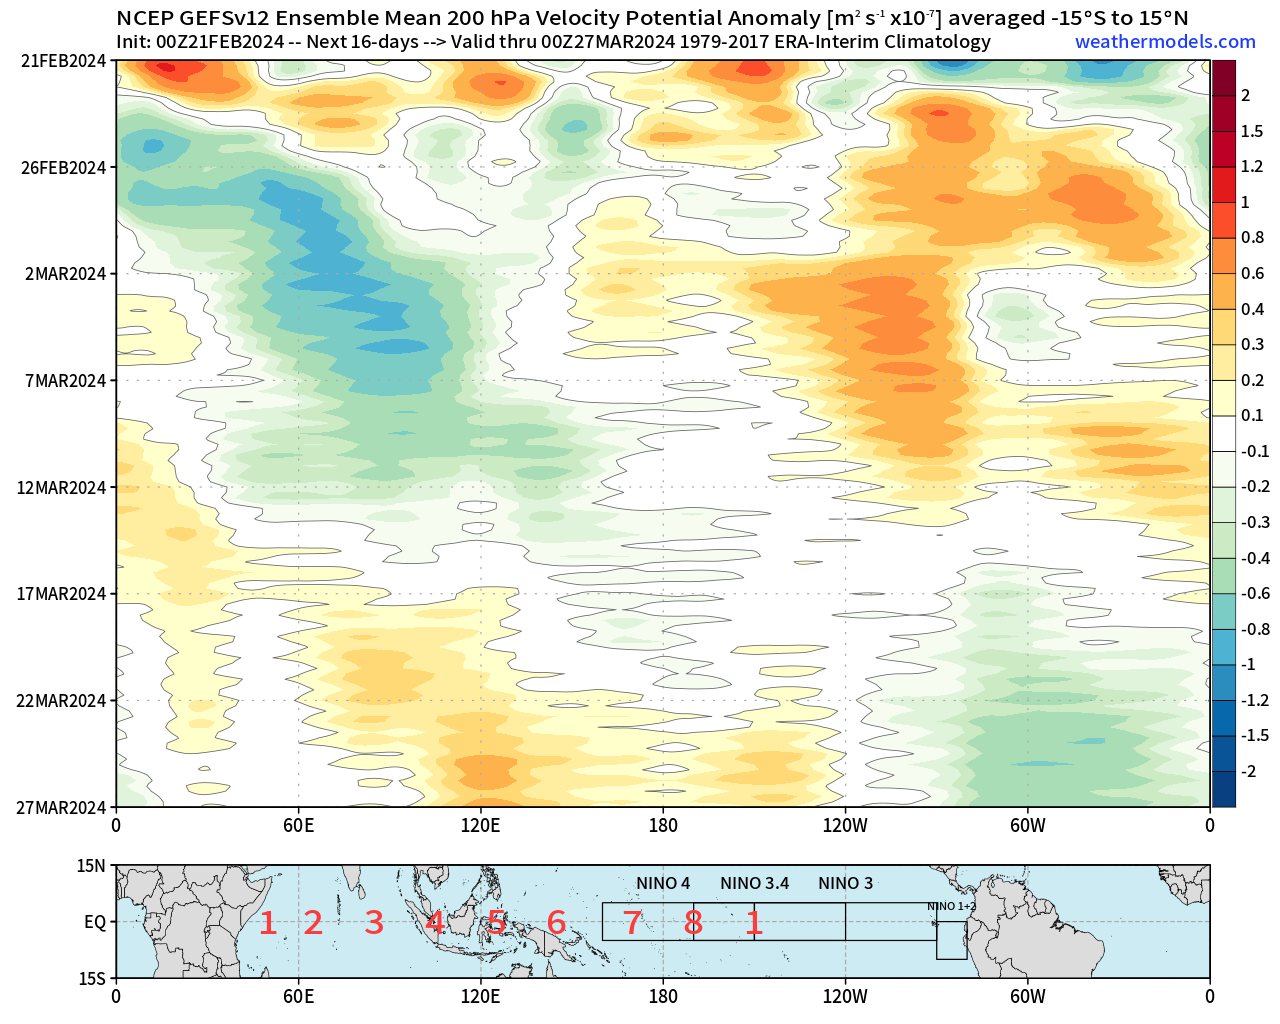
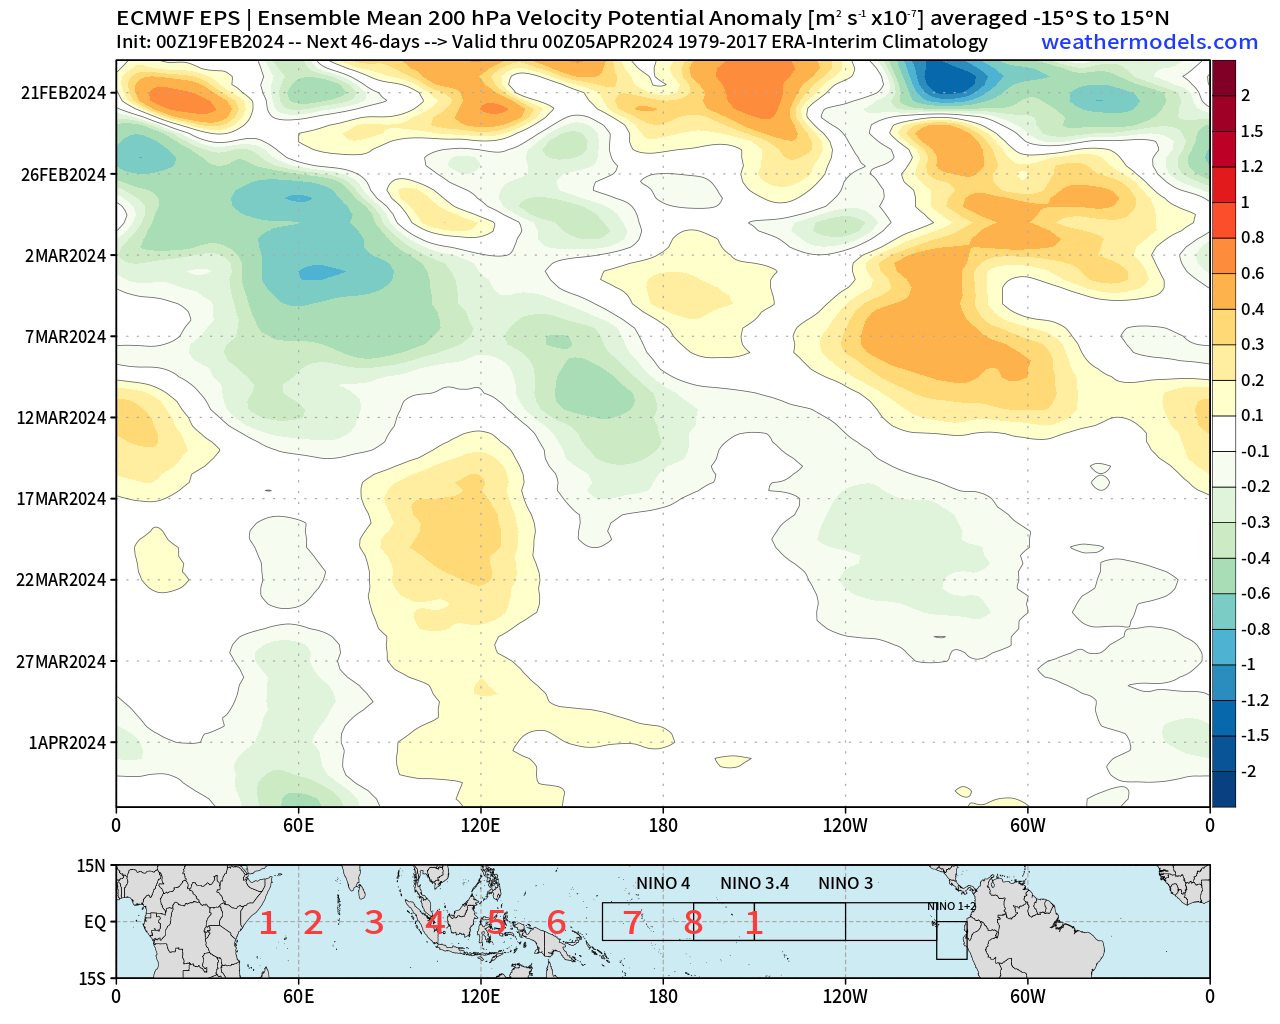
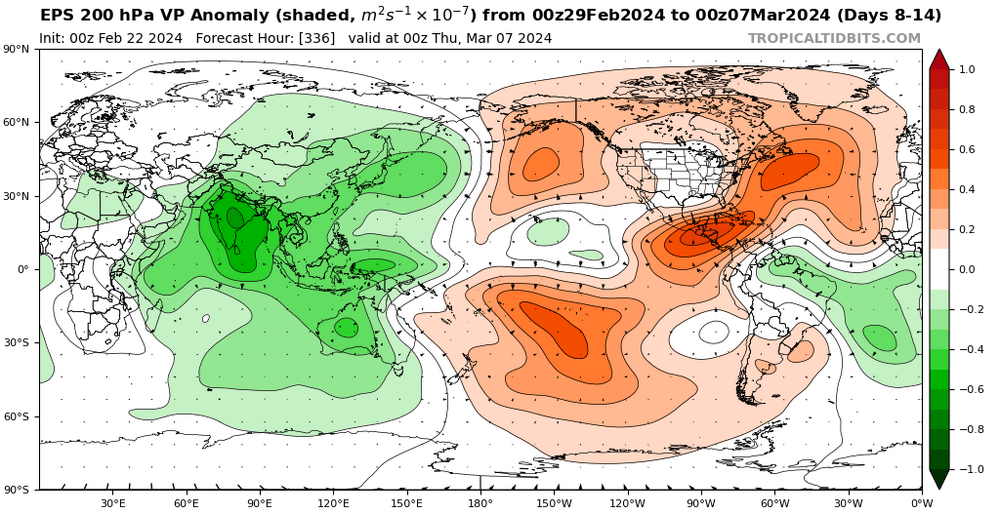
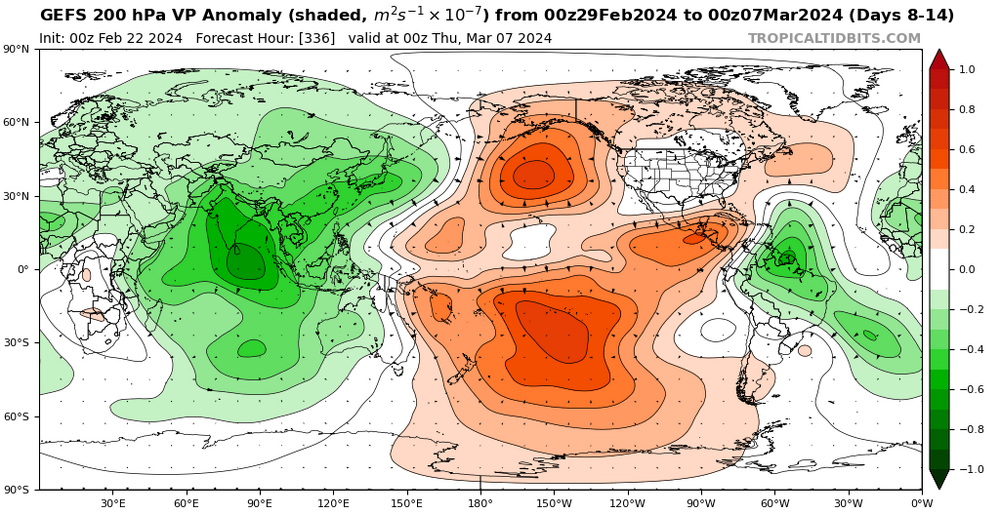
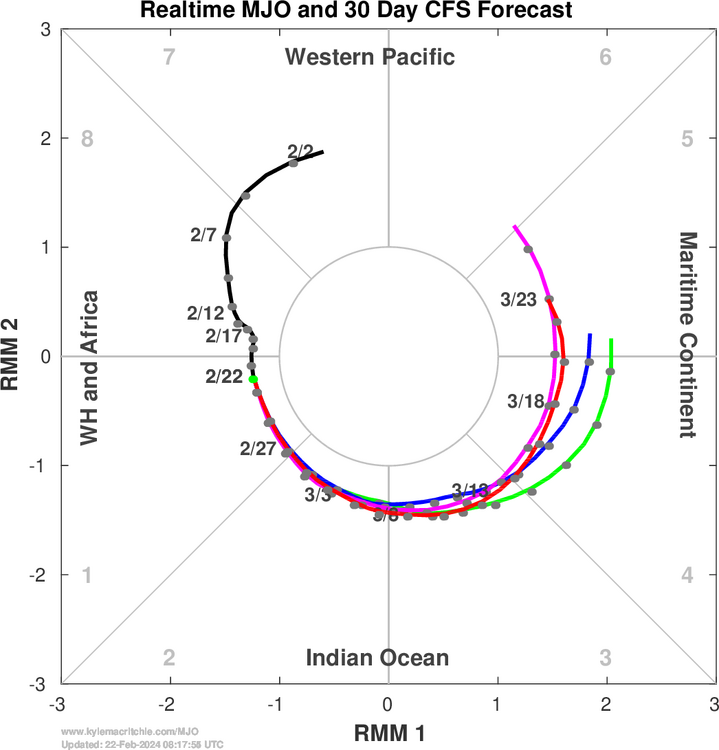
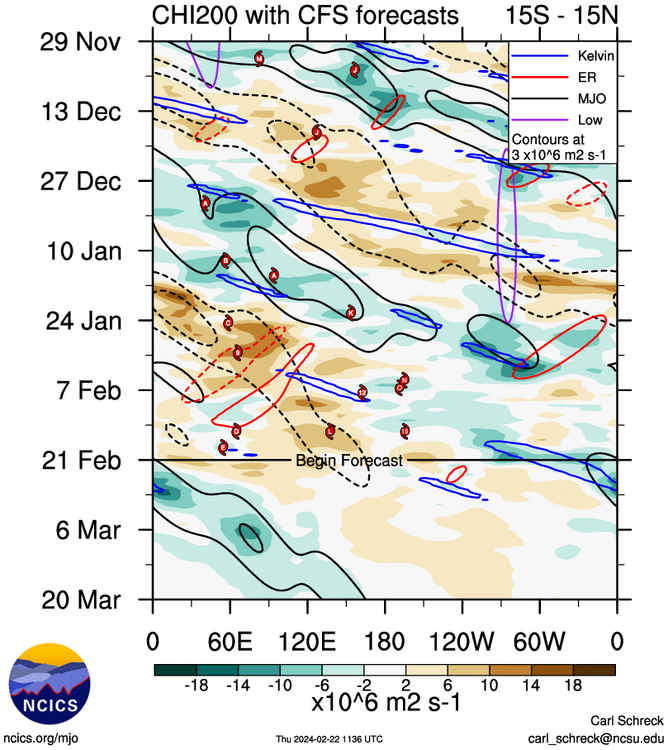
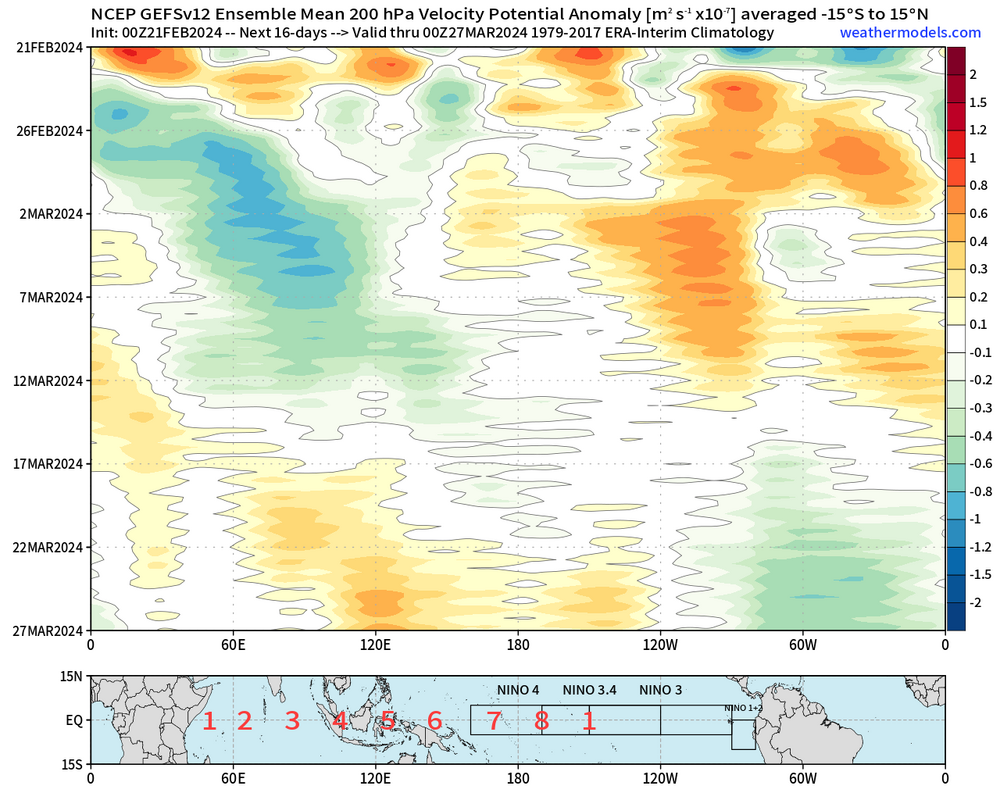
Yes, within 10 days of the upcoming month is the CFS's more skillful phase. But much of that skill hinges on getting the tropical convection/MJO pattern correct. CFS tends to progress the MJO eastward too slowly beyond 7 days. Look how different it is vs. EPS and GEFS even in the 8-14 day period! CFS hangs the -VP anomalies back over far e. Africa and w. IO, whereas GEFS and EPS progress them eastward into the e. IO and Maritime Continent. Looking at longer-range hovmollers, CFS continues to progress the MJO eastward sluggishly, in a manner that to my eyes doesn't make sense. It has the MJO in phases 4 and 5 in late Mar. Meanwhile, the extended GEFS and EPS have the MJO progressing into phases 8 and 1 by late Mar. The implications are very different! The phase 4 and 5 composites largely support the CFS's warm forecast for the second half of Mar. The phase 1 and 8 composites favor a -NAO, western N. America ridging and eastern US troughing, which would suggest normal to colder than normal temps in the second half of Mar. The forecast SSW event in early Mar should have a significant influence in prolonging blocking near Greenland/-NAO in mid to late Mar. I am not sure that this stratospheric warming will behave like a final warming in terms of its influence, given how strong it is forecast to be and how early (EPS indicates the warming peaking on Mar 6-7, which would be the second earliest final warming in the past 40+ years). I agree that Mar 1-10 will feature well above normal temps in the NE US. Mar 11-15 should see a transition period, and in the second half of Mar I would expect slightly below normal temps. The large magnitude of the warm anomalies Mar 1-10 will likely make it tough for the month as a whole to average below normal. But still, I think the CFS forecast for the second half of the month is highly questionable. I would expect the 500 mb/sfc temp pattern for the last half of Mar to be close to a blend of clusters 2 and 3. Cluster 4 (which the CFS forecast is indicating) is close to the prevailing pattern since Dec.


-
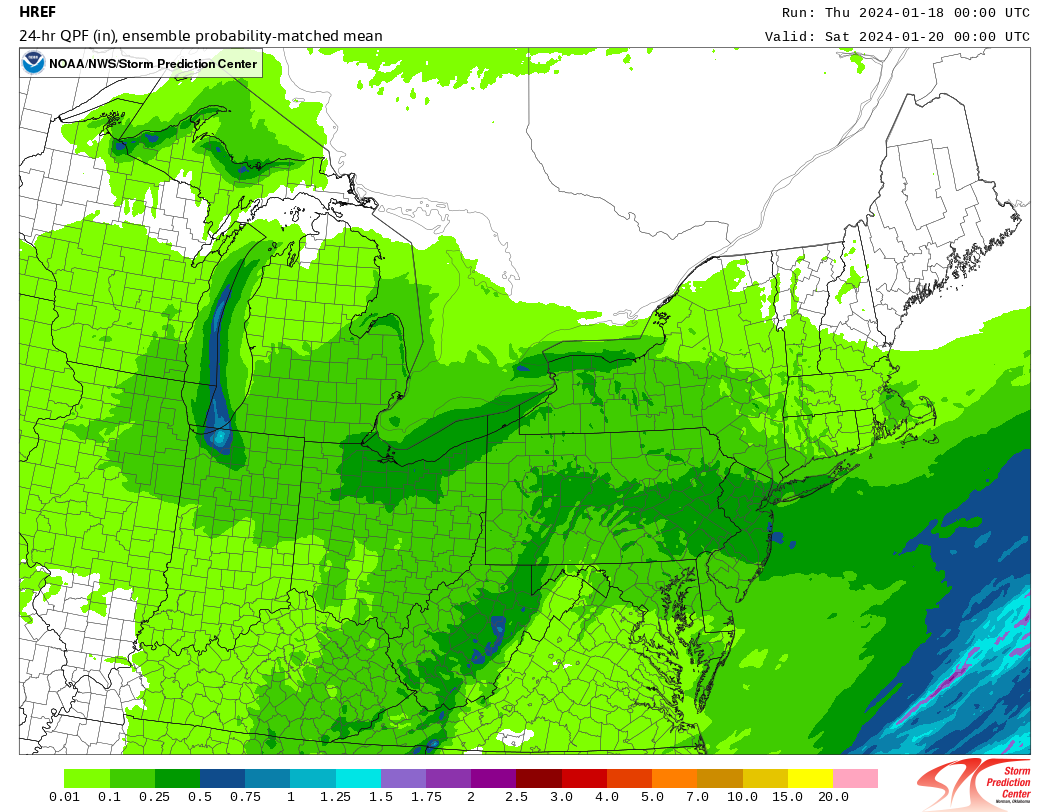
I don't recommend using the HREF snowfall totals verbatim. Its snow-liquid ratios tend to be too high. IMHO, Best to take the probability-matched mean QPF and then convert to snowfall using expected snow-liquid ratios (should be generally 15 to 18-1 in this case).

-
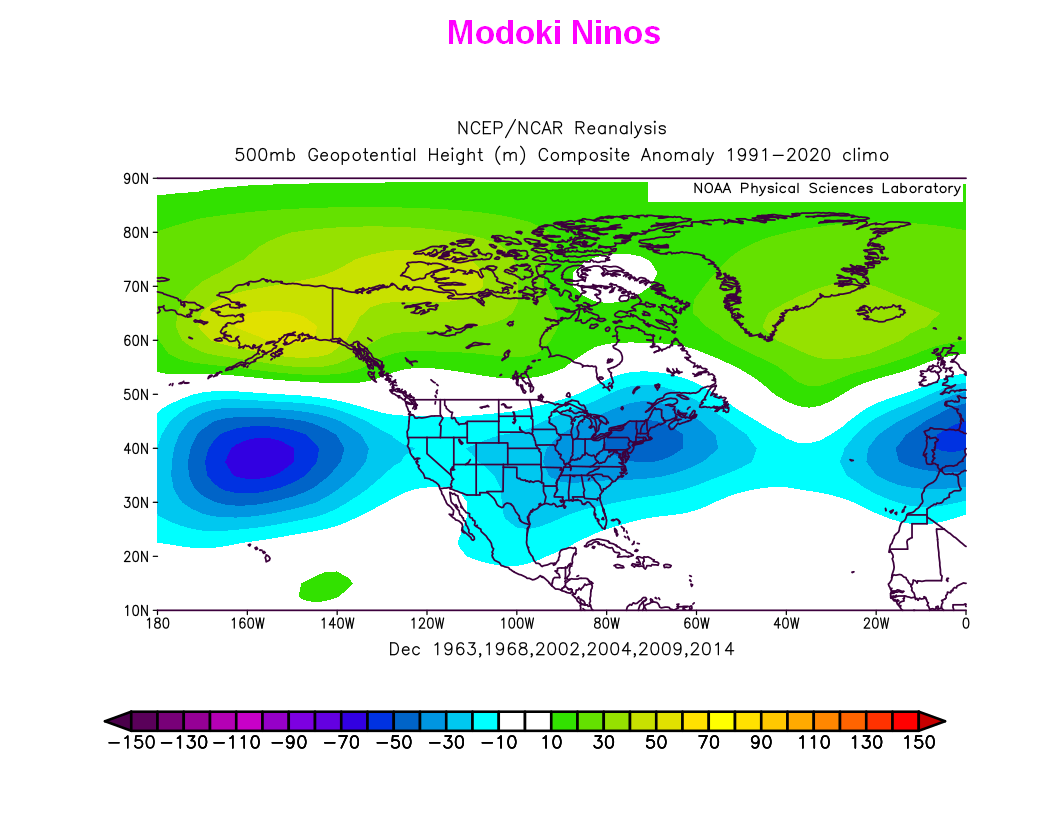
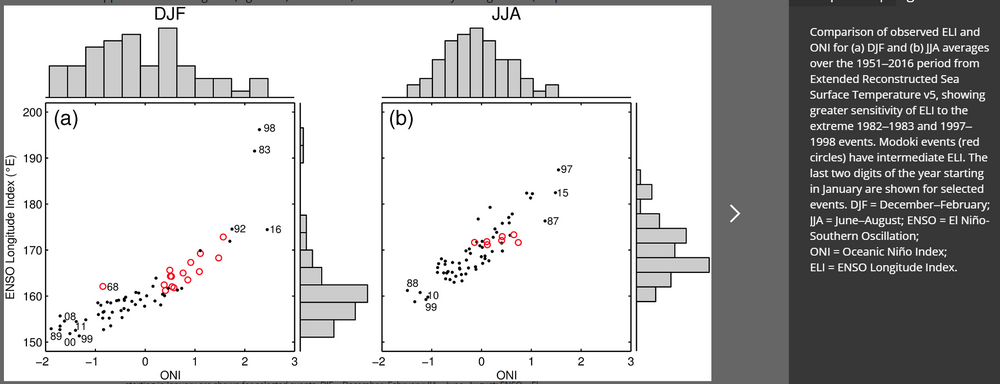
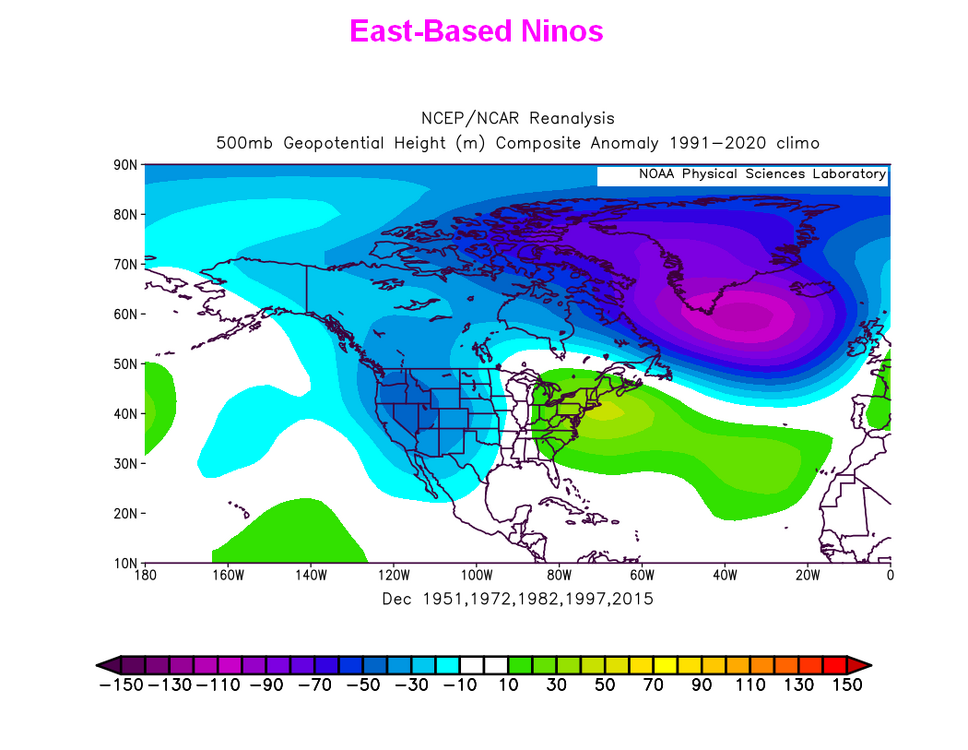
ENSO Longitude Index in 12th place since 1950 puts us squarely in Modoki territory. See https://agupubs.onlinelibrary.wiley.com/doi/full/10.1029/2018GL079203 for more details on the ENSO Longitude Index (ELI)
-
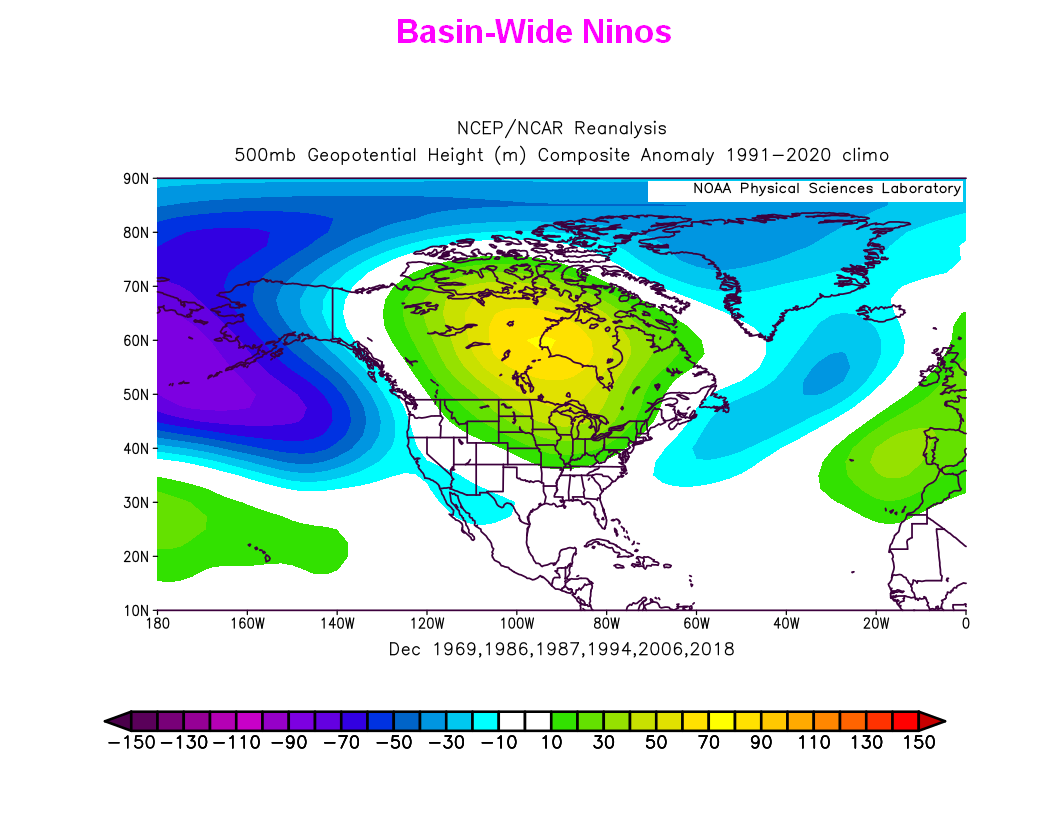
Dec Modoki Ninos are much more likely to have a -NAO than east-based Ninos. Basin-Wide Ninos have a slight tendency toward +NAO. Given Eric Webb's recent tweet about the implications of Dec NAO in Ninos on the pattern during the rest of the winter, will be very interesting to watch the NAO trends as Dec goes on.


-
2023 Atlantic Hurricane season
jconsor replied to Stormchaserchuck1's topic in Tropical Headquarters
There is a decent chance this system becomes a subtropical or tropical cyclone in the next day or two as it heads NE up the Gulf Stream. -
2023 Atlantic Hurricane season
jconsor replied to Stormchaserchuck1's topic in Tropical Headquarters
Mesovortex off the coast of SE FL is causing impacts similar to a tropical storm there. Widespread gusts to 50-60 mph, locally up to around 75 mph: -
2023 Atlantic Hurricane season
jconsor replied to Stormchaserchuck1's topic in Tropical Headquarters
Signal for tropical cyclone formation in the W. Caribbean by late next week (and northward movement thereafter) has grown. -
2023 Atlantic Hurricane season
jconsor replied to Stormchaserchuck1's topic in Tropical Headquarters
While climo is heavily in favor of no TC development from here on out, the pattern suggests we still need to keep a wary eye on the Caribbean next week. -
Thanks for starting the thread, Ed. The ECMWF and EPS have been handling Tammy's intensification and track poorly (GEFS has had better handle). Hopefully with the 12Z run the EPS should be a more useful tool, once recon data is ingested.
-
2023 Atlantic Hurricane season
jconsor replied to Stormchaserchuck1's topic in Tropical Headquarters
I know most of our collective attention is on the potential subtropical system off the SE US coast. However, I think the system in the E. Atlantic (currently given a 70% chance of developing by NHC) is worth watching carefully, since down the road in 7-10 days it has a decent opportunity to reach the Caribbean or western Atlantic. This is a sneaky wave which will likely not develop in the next 3-4 days, but instead continue heading west under a strong ridge. We're dealing with two waves that will likely merge here - firstly the one outlooked by NHC that just came off the African coast, and secondly a low-latitude ITCZ wave currently around 40W. The two systems should combine by late Fri-early Sat into a broad wave. This would initially slow development, due to its large size and lack of concentrated vorticity. This system likely will find better upper level conditions (strong diffluence aloft, deeper moisture) once it passes 40W and clears the strong UL trough in the east Atlantic, and especially as it nears 60W and the Leeward/Windward islands. With a much stronger than usual ridge for this time of year over the central Atlantic, there is a decent chance this system makes it into the eastern and northern Caribbean or heads slightly N of the Caribbean to near the Bahamas. -
2023 Atlantic Hurricane season
jconsor replied to Stormchaserchuck1's topic in Tropical Headquarters
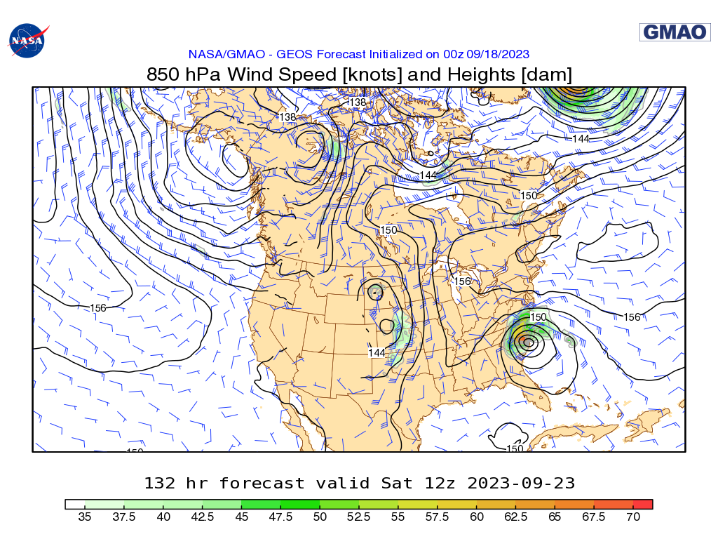
Very helpful summary of the historical context. Thanks, Larry! I think your summary shows that given a few days (even as little as 36-48 hours) over water off the SE US coast, a system of non-tropical origins with a decent upper-level wind setup can become a hurricane. Of course, the majority of such systems remain at tropical/subtropical storm strength. FYI today's 0Z run of the NASA GEOS-5 model is showing what looks to be a high-end TS or cat 1 hurricane, certainly a more consolidated system than the global models (GFS, GEM, ECMWF) are indicating. https://fluid.nccs.nasa.gov/wxmaps I believe the NASA GEOS-5 model is run at 7 km resolution..png.f3bdd79ee9f98b8471d2447f7b4b3049.png)
.png.850346035c47d4540c7f886e92a3191a.png)
-
2023 Atlantic Hurricane season
jconsor replied to Stormchaserchuck1's topic in Tropical Headquarters
Regardless of whether the system off the SE US coast becomes subtropical, there is a substantial risk of heavy rainfall and flooding from eastern NC to the eastern mid-Atlantic and Long Island. -
Need to keep a close eye on the hybrid low expected to develop off the SE coast and move N/NNW end of this weekend into this weekend. While heavy rains are likely to initially focus well south of the area from eastern NC to Delmarva, they could eventually extend north into portions of the NYC metro area. The region doesn't need any additional heavy rainfall, after several recent flash flood events in early to mid Aug and again the second week of Sep, and another 1-2"+ today.
-
2023 Atlantic Hurricane season
jconsor replied to Stormchaserchuck1's topic in Tropical Headquarters
I think we need to watch the eastern Caribbean in late Sep. Also expecting more NW Caribbean activity than usual in Oct-Nov for an El Nino. -
I wrote a detailed thread about the trend toward a sharper trough at 250 mb from the eastern Great Lakes to the Carolinas, and how this could increase the risk of Lee continuing N or NNW toward New England instead of turning NNE into Atlantic Canada.
-
Need to look at more than just 500 mb heights/winds to get a better idea of Lee's future track. Very important to consider the 250 mb level IMHO. There have been a number of cases in which hurricanes were lured NW toward the SE US/Mid-Atlantic coast by a negative tilt trough or cutoff low at 250 mb, even when the 500 mb trough was relatively weak. It *usually* takes a deep 500 mb trough from near the Great Lakes to the TN Valley or southern Appalachians (570 dm contour down to at least 40N) to pull a hurricane northward from near/east of the Bahamas toward a New England landfall, and also accelerate it enough (forward speed >25 kt) so it maintains hurricane strength despite the cooler waters N of the Gulf Stream. Look at the upper air patterns for 1938, Carol, Edna, Gloria and Bob and you will see such a deep trough. On the other hand, the 1893 NYC hurricane and Irene both had much weaker/further north troughs at 500 mb than the hurricanes mentioned above. The 1944 Great Atlantic hurricane had an initially deep trough over the W. Great Lakes/OH Valley two days before landfall, but it was weakening/lifting out as the hurricane turned N up the East Coast. In both the 1893 and 1944 hurricanes, a sharp trough at 250 mb along with a strong jet streak from the NE US to SE Canada helped to compensate for the lack of a deep trough at 500 mb. Also in Lee's case, a relatively deep/neg tilt 250 mb eastern US trough and 100+ kt jet streak as shown by the GEFS would likely help to compensate. Also important to note - since the frequency of blocking patterns appears to have increased in the past 30 years since the last New England landfall, and there has been substantial warming of SSTs in those 30 years, history may not be as much of a guide as we would hope. In other words, perhaps in the next few decades we will see increasing frequency of slower-moving strong TSs or lower-end hurricanes (i.e similar to Irene, Sandy and Henri) landfalling in the northern mid-Atlantic and New England vs. what was seen up until ~1990.


-
Combination of stronger ridge nosing down to NW of Lee and upper low to its NE trending stronger and a little closer to Lee is likely the reason we are seeing more ensemble members trend toward a bend to nearly due west between 60-70W longitude.
-
The upper level pattern across the eastern US and western Atlantic this weekend into next week is far from set in stone. We need to watch for the potential for a trough split, which models often don't handle well until inside 5 days. If the the southern piece of the trough cuts off across the SE US by this weekend, and the ridge over the NW Atlantic/SE Canada is strong enough to resist troughs in the northern stream from progressing eastward much, that could block a typical recurve out to sea. 6Z GEFS and past few GFS runs are now hinting at another trough split mid to late next week from the Great Lakes to the Lower Mississippi/Tennessee Valley. A trough in that position along with an anomalous NW Atlantic ridge has in the past steered many infamous SW Atlantic hurricanes toward a landfall from NC to New England.