jconsor
-
Posts
1,016 -
Joined
-
Last visited
Content Type
Profiles
Blogs
Forums
American Weather
Media Demo
Store
Gallery
Everything posted by jconsor
-
Everyone is focused on the TX/LA impacts (rightfully so), but just wanted to note that by Fri this could easily have a "second coming" and bring tropical storm conditions to the coastal Carolinas. I wrote about this in my blog: https://hurricanehacker.substack.com/p/low-pressure-high-water-gulf-system?r=etzas
-
2026 Atlantic Hurricane Season
jconsor replied to Stormchaserchuck1's topic in Tropical Headquarters
Seeing some potential interesting tropical mischief in the GOM next week. A stalled frontal boundary providing vorticity, remnant energy from the system entering the BOC this weekend dragging up lots of tropical moisture, and indications of a pocket of lower shear and diffluence between central US trough and a persistent GOM ridge: https://x.com/yconsor/status/2065067111521652967 -
2026 Atlantic Hurricane Season
jconsor replied to Stormchaserchuck1's topic in Tropical Headquarters
13/6/2 with 90 ACE (I think a reasonable range for ACE accounting for uncertainty at this stage is 60-115 ACE). My ACE forecast is slightly lower than the mean of the seasonal forecasts on https://seasonalhurricanepredictions.bsc.es/forecast/seasonal-predictions See https://seasonalhurricanepredictions.bsc.es/about/forecasters for more background on how each group/agency produces its seasonal forecasts. 268Wx and Univ. of Arizona have shown particular skill vs. other forecasts in past +ENSO years like 2019 and 2023 (when ACE was generally notably higher than most seasonal forecasts) and in -ENSO years like 2022 and 2024 (when ACE was generally notably lower than most seasonal forecasts). Interestingly, 268Wx and Univ. of Arizona this year represent the far high end of the forecast spectrum in terms of ACE/level of activity. -Yaakov -
2026 Atlantic Hurricane Season
jconsor replied to Stormchaserchuck1's topic in Tropical Headquarters
Went into more depth on the potential implications of the persistent -PDO for how the El Nino evolves and the degree of atmospheric coupling in the thread below. Would honestly surprise me to see this El Nino and the pattern in the Atlantic tropics evolve like 1982, 1987, 1997 and 2015. I'm thinking we most likely see something about halfway in between those years and "Active El Ninos" like 1951, 1969, and 2018 - perhaps something a little more active than 1957, 1965, 1976 and 2002 in terms of Atlantic activity. https://x.com/yconsor/status/2052132299139858764 -
2026 Atlantic Hurricane Season
jconsor replied to Stormchaserchuck1's topic in Tropical Headquarters
The equatorial east Atlantic and west Africa have seen persistent westerly wind anomalies and above normal precip since mid-March, which is uncharacteristic of developing El Ninos. https://x.com/yconsor/status/2045877323635810439 -
2026 Atlantic Hurricane Season
jconsor replied to Stormchaserchuck1's topic in Tropical Headquarters
University of Arizona has a bold forecast, much more active than other forecasts to date: 9 hurricanes and 4 majors with an ACE of 155. Their model is based on machine learning initialized with ECMWF seasonal forecast SSTs. They cite forecast significantly above normal tropical Atlantic SSTs as the main factor. News release: https://has.arizona.edu/news/forecast-2026-hurricane-activities-over-north-atlantic More technical summary: https://has.arizona.edu/sites/default/files/2026-04/April-2026-Tropical-Cyclone-Forecast.pdf Seasonal hurricane predictions that have been issued so far: https://seasonalhurricanepredictions.bsc.es/forecast/seasonal-prediction Univ. of Arizona has a very good track record. They started issuing Apr outlooks in 2022. Their Jun forecasts were notably higher than almost all others in 2017, 2019 and 2023 and ended up verifying well (In Jun 2017 they forecast 181 ACE and actual was 225, while most other outlooks were in the 100-130 range). In Jun 2019 they forecast 151 ACE and actual was 132, while most other outlooks were in the 80-105 range. In Apr 2023, they forecast 163 ACE and actual was 148, while most other outlooks were in the 90-130 range). Notice that all 3 years had El Nino conditions at the time of forecast initialization and the Nino was forecast to strengthen - but in 2017 and 2019 that strengthening failed to occur and in 2023 the Nino ended up weaker than many models had forecast and while it limited Atlantic activity to a degree, it was less impactful than expected. In 2022, 2024 and 2025 their Apr outlooks were notably lower than almost all others (In 2022 UA forecast 129 ACE and actual was 96, while almost all other outlooks were in the 150-190 range. In 2024, they forecast 156 ACE and actual was 162, with almost all other outlooks in the 185-230 range. In 2025, they forecast 110 ACE and actual was 133, with most other outlooks in the 145-190 range.) You can download all of the historical hurricane season prediction data for past years from the Univ of Barcelona site linked above. Personally I would go with an ACE range of 80-130 right now. Main reason is I believe the standing wave of low-level westerlies over the eastern Atlantic and west Africa will help lead to an Atlantic Nino, energize the W. African monsoon (WAM) and lead to an active wave train, while as we know El Nino influence on shear is mainly west of 60W. Also, the persistent very warm SST anomalies in the NW Pacific from E of Japan to S of AK and the SW Pacific east of AU/NZ (e.g. negative IPO) along with the above-mentioned Atlantic Nino and African standing wave would likely lead to resistance toward WWBs reaching the eastern Pacific (with the focus remaining near the dateline). This would tend to shift the Walker circulation west of a typical moderate to strong Nino. I think there's a 55% chance RONI stays below strong Nino levels through Aug-Oct. Not ruling out a strong Nino, but I think a super Nino RONI-wise is unlikely (<15%) through Aug-Oct. My main analog years are 1951, 1963, 1969, 2006, 2015, and 2018, with more emphasis on the first three given the strong WAM that prevailed. -
2026-2027 Super El Nino
jconsor replied to Stormchaserchuck1's topic in Weather Forecasting and Discussion
Nice points. I agree - the lean toward La Ninas has acted as at least a slight brake on the global temp rise over the past three decades. Global temp anomalies past 10 years or so have increased more rapidly in the extratropics than the tropics. See this post from Dr. Joseph Fournier: https://www.linkedin.com/posts/joseph-fournier-7077087_following-the-15-year-great-hiatus-2000-activity-7449541780481654784-8jWQ? The attached graph is from the same post and is generated using satellite temperature estimates.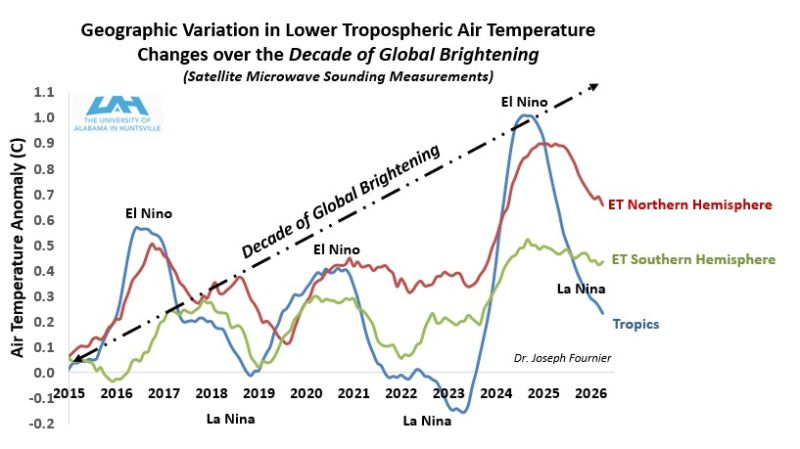
-
I agree it's ironic. I think that mainly has to do with how slow the downward propagation ("drip down") of above normal heights from the stratosphere to the troposphere was this year. See the attached graphic of polar (65-90N) height anomalies past several months, courtesy of meteorologist Todd Crawford on LinkedIn. Here's his full post: https://www.linkedin.com/posts/todd-crawford-5a02092_the-stratospheric-polar-vortex-spv-had-activity-7447251962808569889--JnW?utm_source=share&utm_medium=member_desktop&rcm=ACoAAAB0F_QB1PGc4wDzKl0eXPl_N7X02RAnqV4 Looks to me like there is a direct link between the recent increase in polar blocking (starting in early Apr near Scandinavia with a separate area near the Arctic Circle) + the forecast near-record strength Greenland blocking last week of Apr, with the notable stratospheric warming event in late Feb and early Mar.
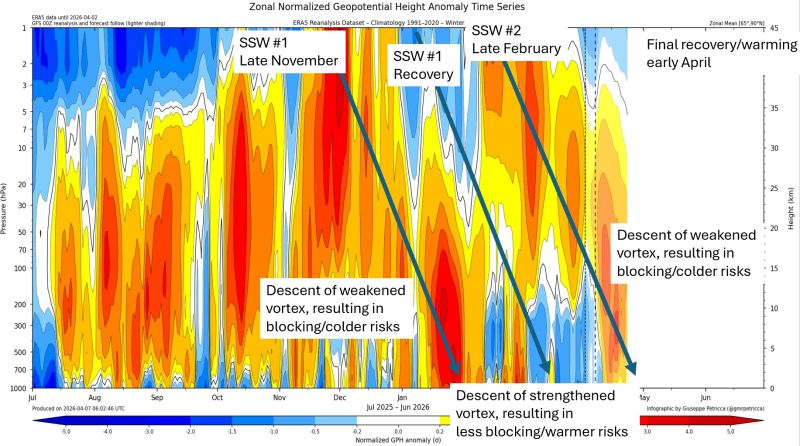

-
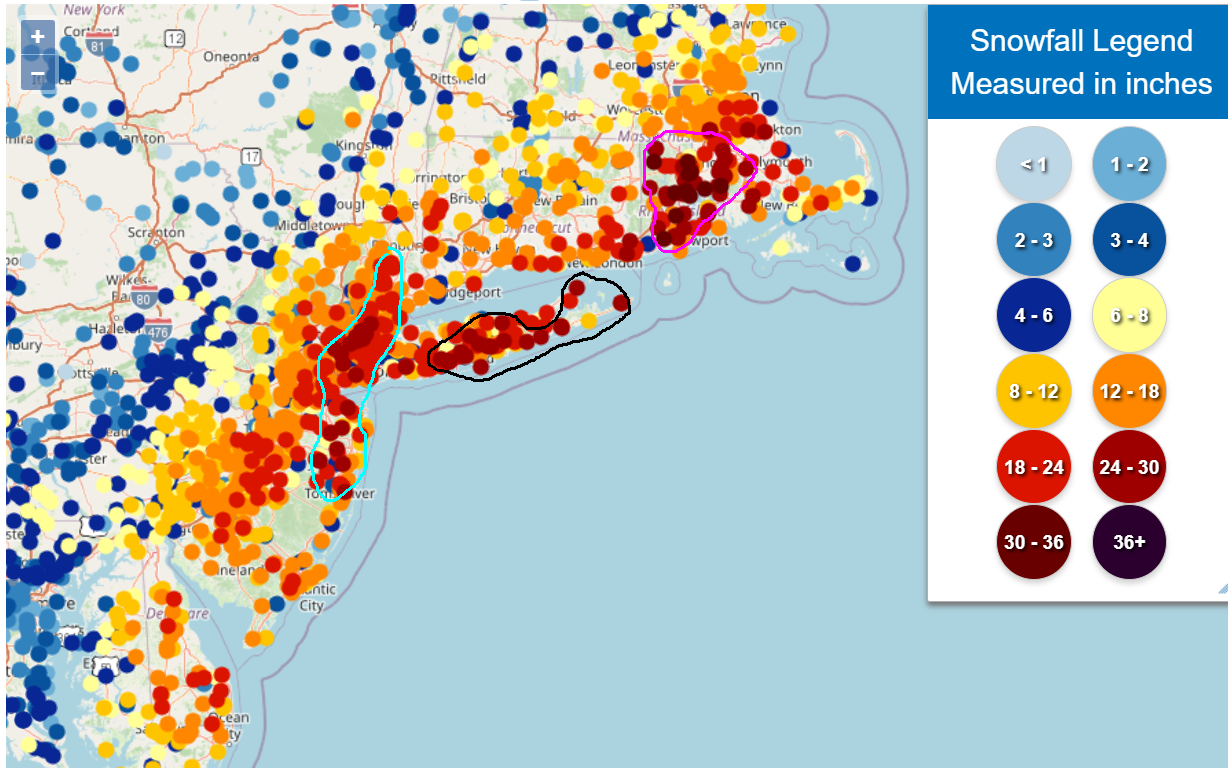
https://www.weather.gov/source/crh/snowmap.html?zoom=7&lat=40&lon=-74&hr=24 Just to see the breadth of this storm is impressive! Totals as high as 20" extended all the way down into Delaware and the eastern suburbs of Philly in sw NJ, and then as far ne as near Boston (still snowing heavily in parts of eastern New England). The true jackpot appears to be RI with multiple reports of 30-33"! Part of SE MA southwest of Boston has seen 24-28". (Circled in purple) Wouldn't be surprised to see some scattered 36"+ reports in RI, like was seen in eastern MA or RI in big ones like Feb 1978, Apr 1997 (April Fools Storm) and Jan 2015 (Juno). Other jackpots we have discussed already - the N-S band from coastal central NJ to ne NJ to Westchester County and sw corner of Staten Island (circled in light blue). Most of NYC aside from NE Queens was pummeled by this band at times, but it was nearly stationary over NE NJ for many hours before it started focusing near NYC. And of course the eastern/central LI jackpot (circled in black).

-
Yep, you got the subsidence between the two bands. Where are you located and approximately how much snow did you receive? I grew up in NW Nassau (Roslyn). Looks like my area was close to the minimum for the entire NYC/LI area - happens somewhat frequently in the past 25 years, yet when I was growing up (late 1980s to mid-1990s) we had near the highest seasonal snowfall totals for all of NYC/LI.
-
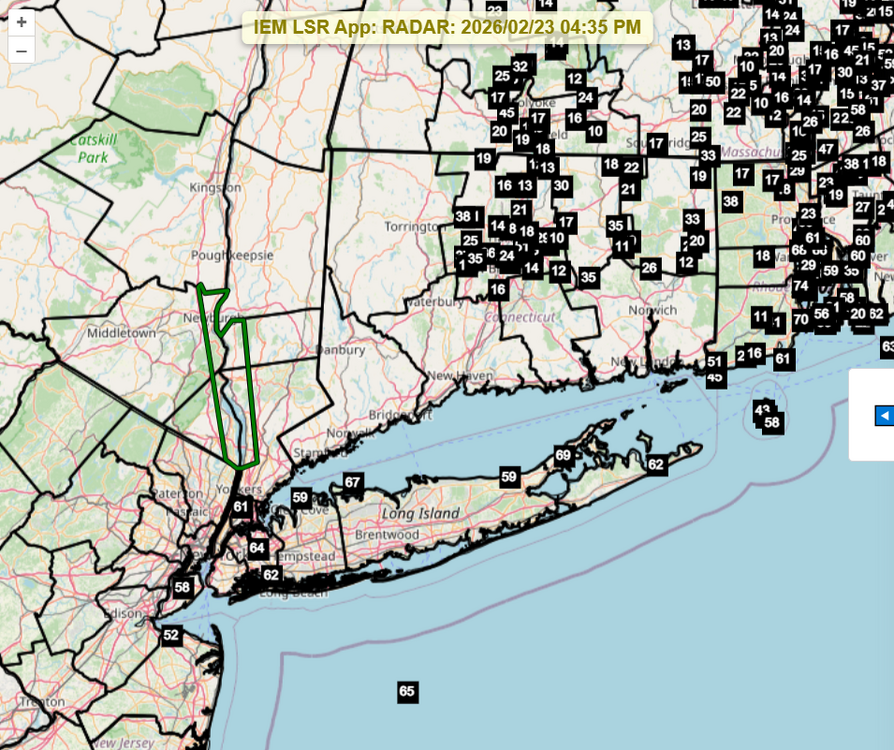
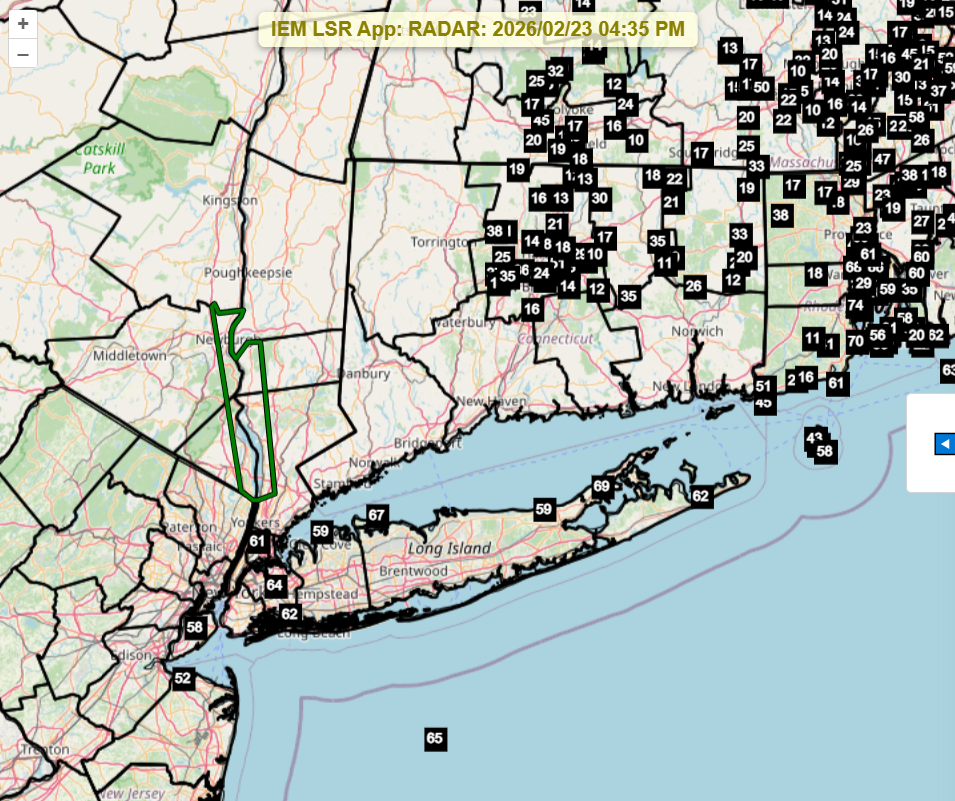
Thank you! However, I don't see Montauk wind gusts in the NWS local storm reports. Do see lots of 60-70 mph gusts across NYC and LI. So 80-85 mph gusts on Montauk are believable. https://mesonet.agron.iastate.edu/lsr/?by=wfo&sts=202602221435&ets=202602231435&settings=0110110
-
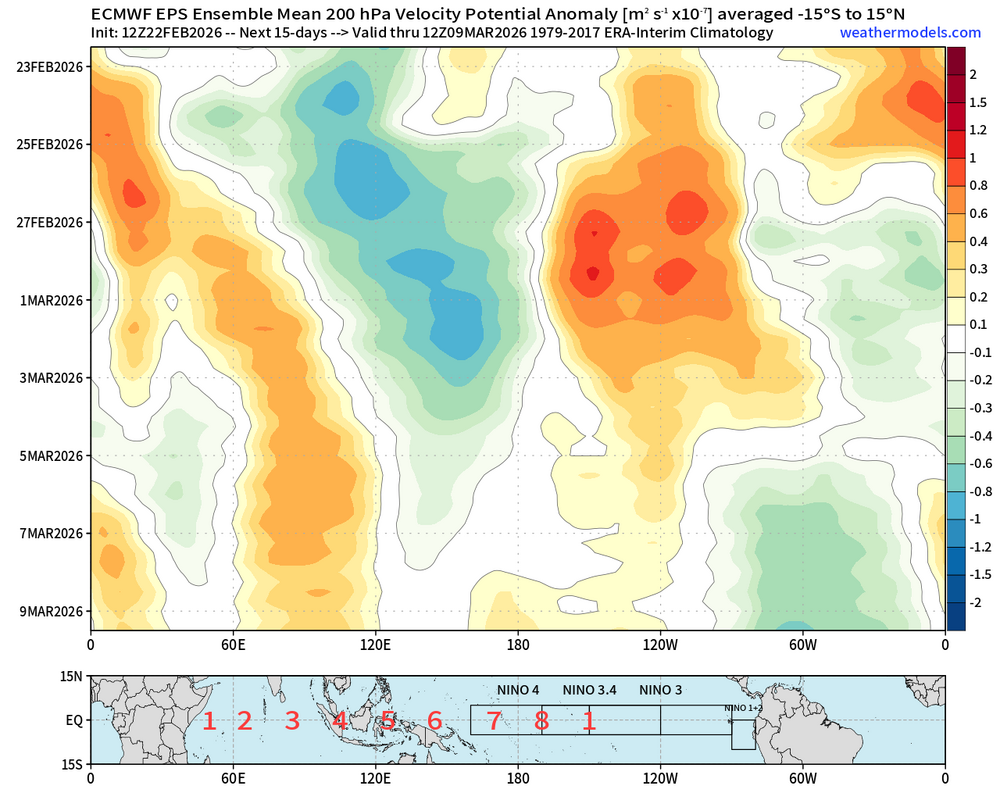
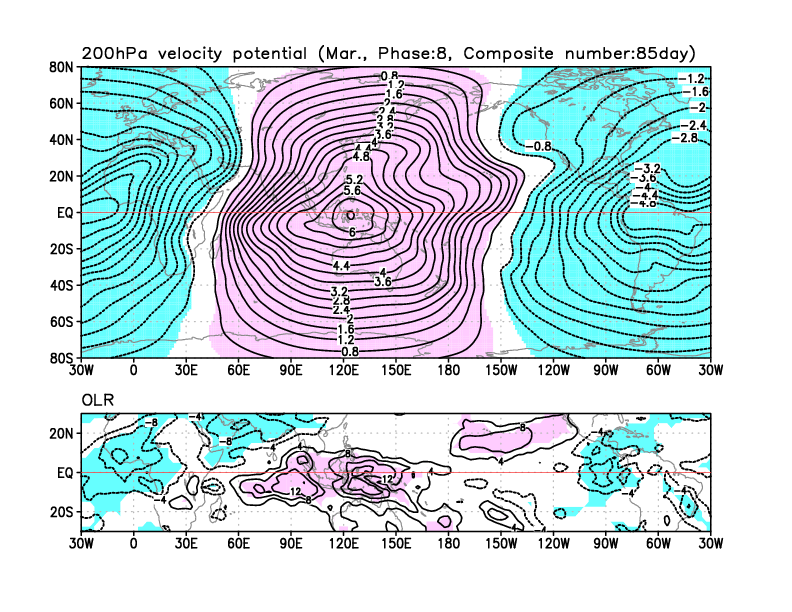
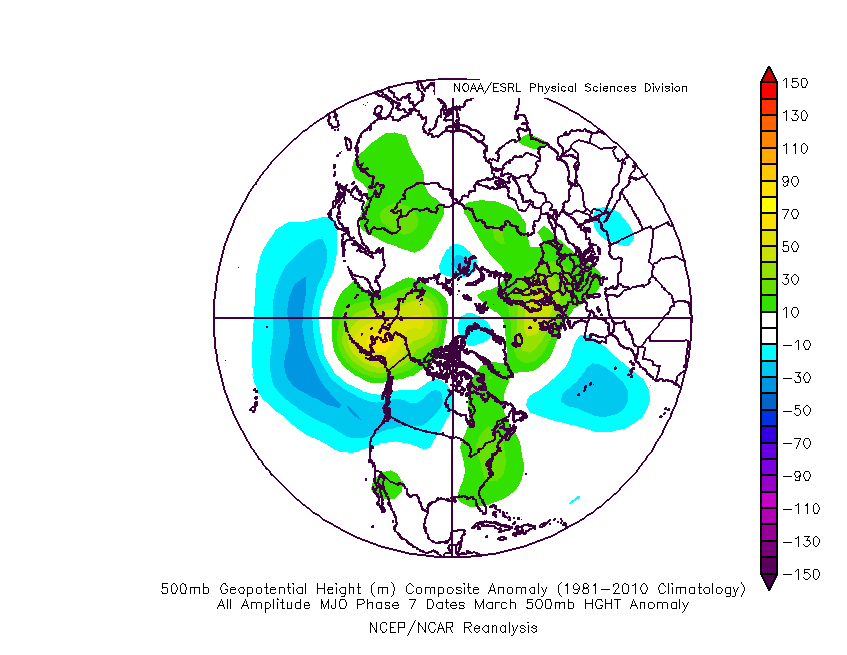
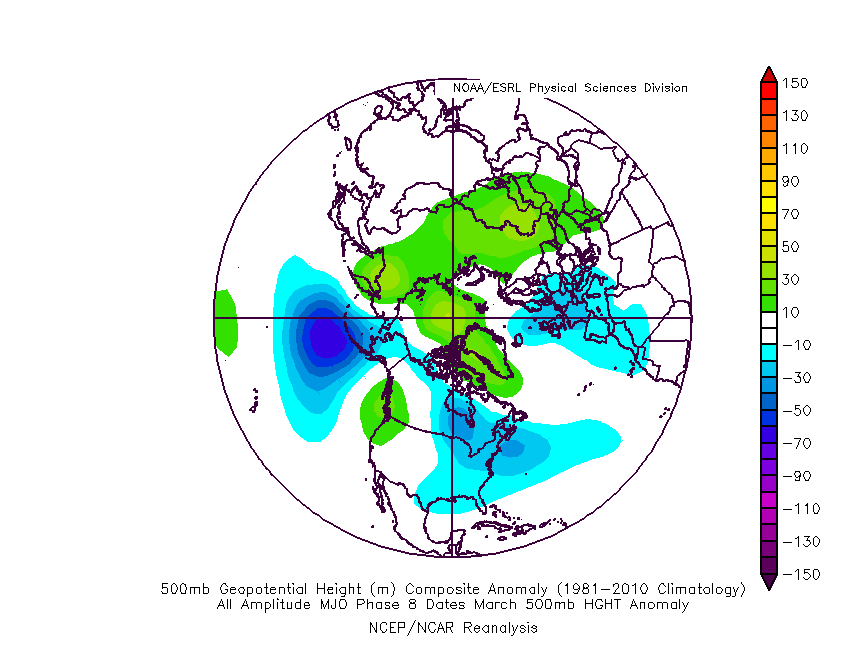
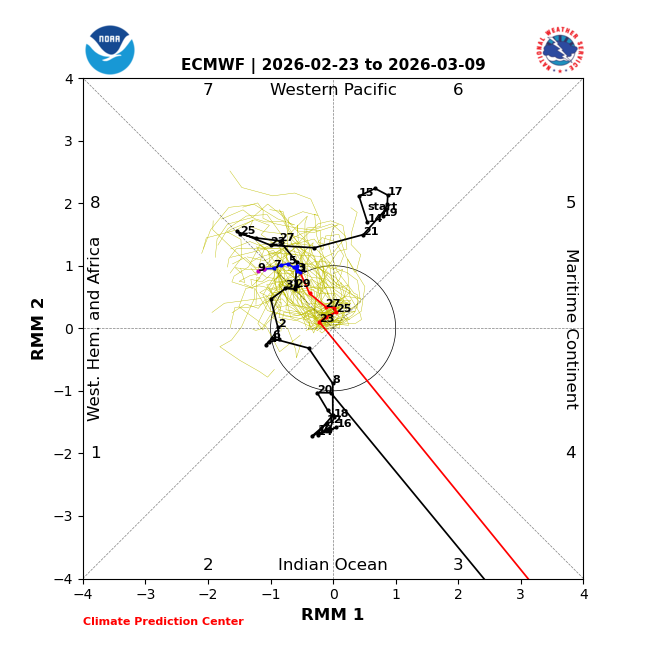
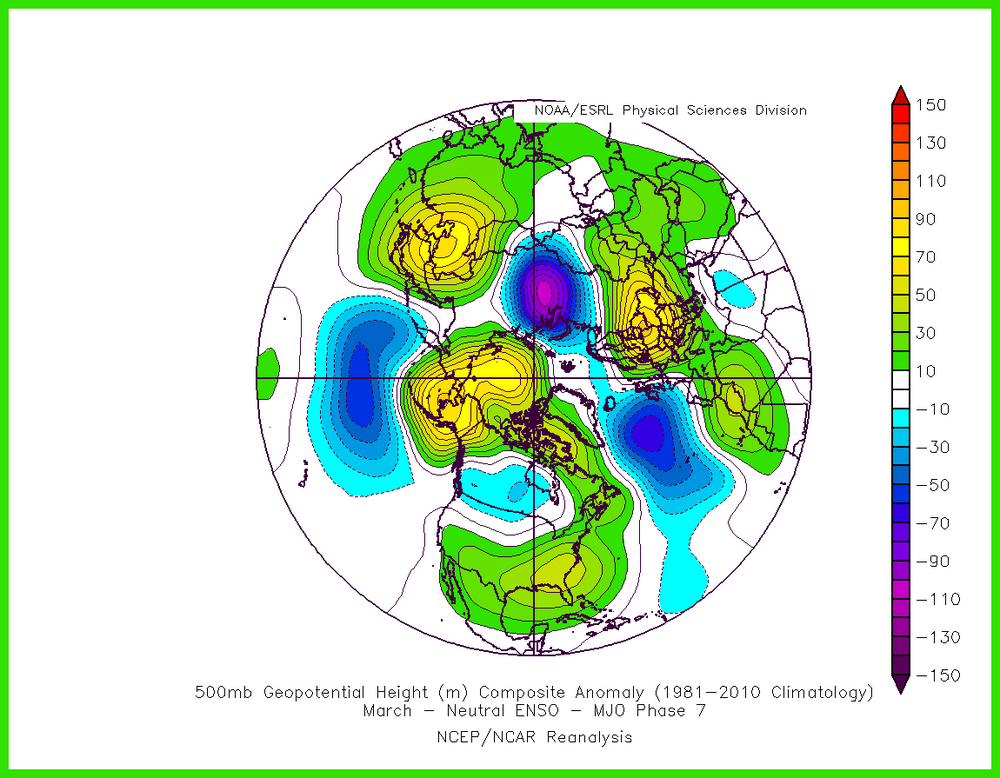
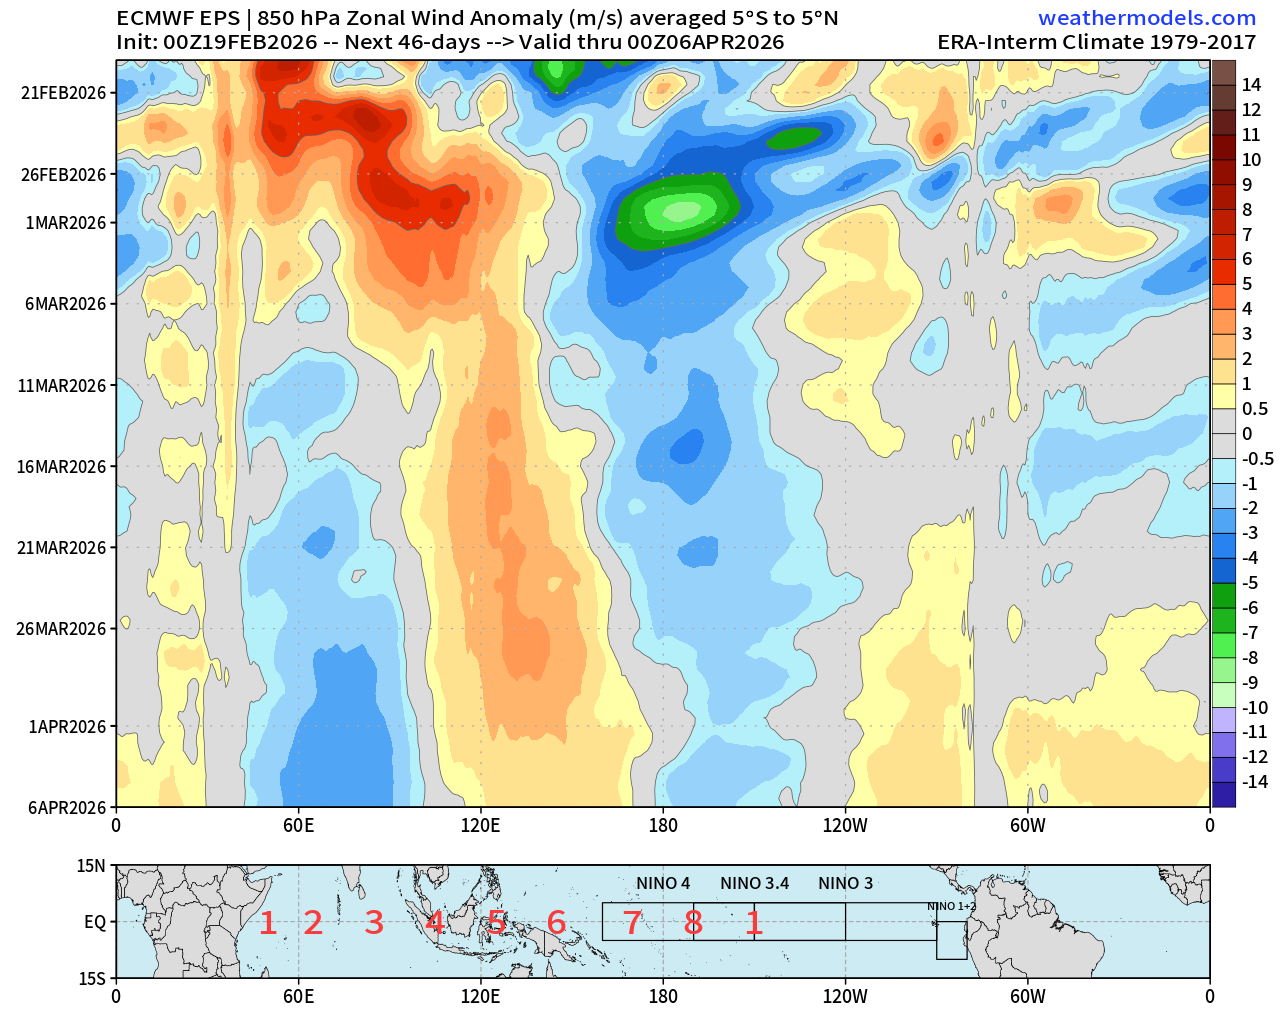
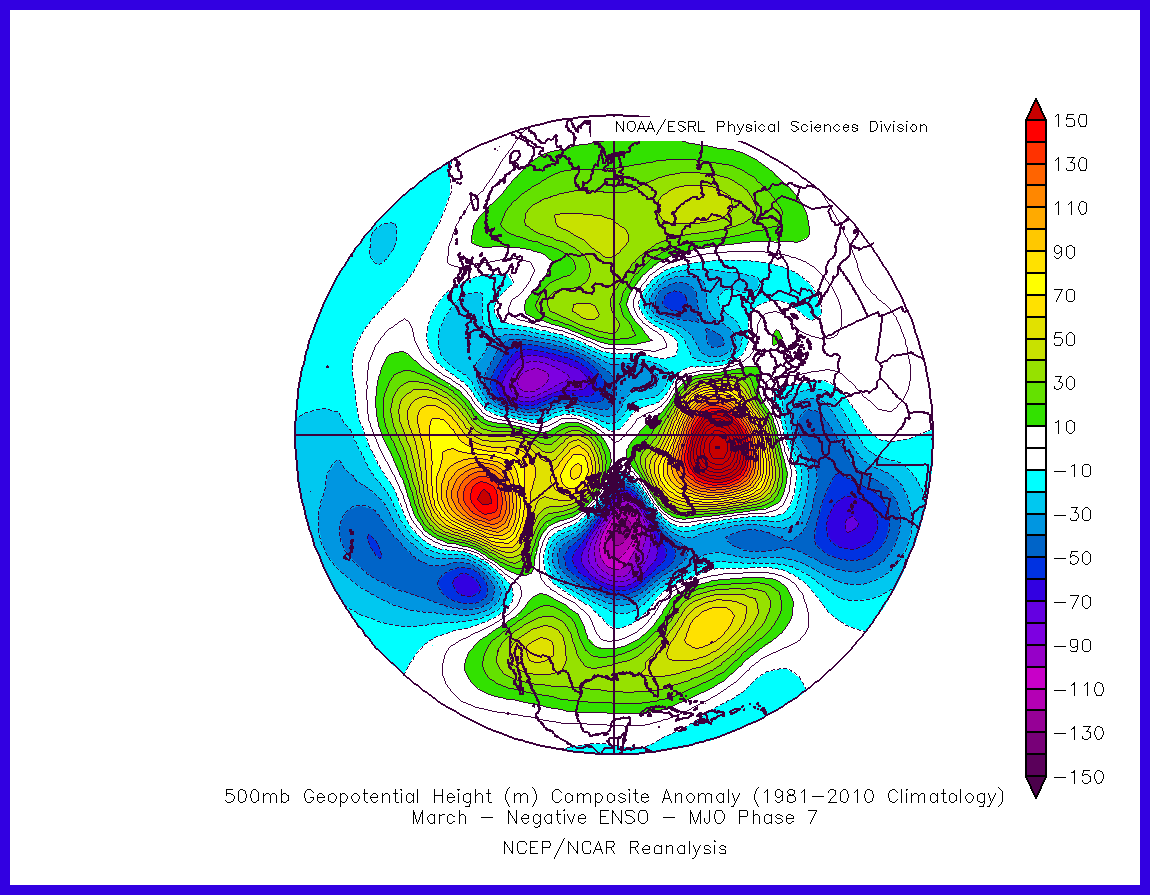
LOL at the laser beams - ECMWF MJO chart has that too. Phase 7 composite for Mar does have building ridging near AK which can help to direct colder air masses down to the NE US at times, and we can benefit from overrunning events. However, it is not really a cold pattern signal with the composite showing eastern US/west Atlantic ridging. I believe we really need to get into phase 8 to see a consistently colder pattern, which EPS does show by around Mar 7-8. EPS is moving the MJO along faster, placing more emphasis on the -VP cell over Central America and the Atlantic than the one over the western Pacific starting around Mar 6-7, whereas the GEFS keeps the w. Pacific cell dominant. EPS should be closer to reality here, especially with the major warming trend in the Eastern ENSO region past two weeks, as well as the warming in the tropical Atlantic. I think we still have opportunities for snow first week of Mar (EPS and AIFS ensemble both have a confluence/cold high pressure and overrunning signal for ~Mar 2-4, with maybe another overrunning event a few days later), then likely a thaw for 5-10 days. Last 15-20 days of March have potential, as you said. ECMWF weeklies have strong signs of AK blocking and looks like southern stream will be active, unlike the Northern Stream-dominated pattern most of this winter. Though Larry's analysis shows phase 7 is the coldest one for La Ninas, I believe the atmosphere is likely to behave closer to neutral as we head later into Mar, especially given the above-mentioned major warming in the eastern ENSO region and anomalous westerly wind bursts expected to get closer to the dateline in late Feb-first few days of Mar and likely again in second half of Mar. The neutral ENSO phase 7 composite is similar to the one included below.

.gif.f539e0fec619993025c27a10de4ce214.gif)

.thumb.png.f04a11ebbd5c1ee08a33e4f5d8944ad2.png)
-
Larry's post was specifically about La Ninas and limited to one station - Baltimore. I think his analysis has merit and definitely is worth keeping in mind, though there is still lots of variability despite the cold lean. The composites I posted before are averages of all Mar phase 7 days, no matter what ENSO state The phase 7 neutral ENSO composites for March is pretty similar to what I showed in my previous post, with eastern US ridging and AK ridging. On the other hand, the La Nina composite is closer to what you would want for colder. Two reasons I wouldn't bank on phase 7 being cold for us this Mar- 1) The La Nina is weak and we are starting to see slow signs of atmospheric coupling with the much warmer SST in the Eastern ENSO regions. So atmosphere would probably behave closer to neutral than La Nina for Mar. 2) The phase 7 La Nina composite has a -NAO with above normal heights/hints of blocking near Greenland. No sign of that on guidance heading into early Mar. So we will have to rely on the AK ridging to deliver cold enough air for snow I think.

-
Phase 7 composite for Mar does have building ridging near AK which can help to direct colder air masses down to the NE US at times, and we can benefit from overrunning events. However, it is not really a cold pattern signal with the composite showing eastern US/west Atlantic ridging. I believe we really need to get into phase 8 to see a consistently colder pattern, which EPS does show by around Mar 7-8. EPS is moving the MJO along faster than GEFS. See my post in ENSO thread for details. In short, I agree with you that March has potential for snow, especially first week or so (EPS and AIFS ens showing a signal for Mar 2-4 and perhaps another overrunning event a few days after that) and last half.


.png.81b2120a06977e46d7d042e0d0641825.png)
-
Can you please send a source confirming those wind gusts? What altitude are they measured at? Montauk Airport has seen gusts to 52 mph.
-
This a good summary of where we stand IMHO, though it was written before the 12z cycle. https://x.com/ContentWxGuy/status/2024528387927097369 Recon data may help the models gain clarity, though the recon mission prior to Fri 0z run is significantly further west into the central Pacific than the recon mission whose data was ingested into today's 0z cycle.
-
All that said, I think the best potential for a significant event e.g. 6"+ is from the Delmarva to southern and coastal NJ, and especially from eastern LI to southeast New England. As others have mentioned, given the upper level setup and strong indications of bombogenesis, as well as enhanced baroclinicity with anomalous cold SST near the mid-Atlantic coast butting up against above normal SST along the Gulf Stream, this storm needs to be carefully monitored. A small change in synoptics opens up the potential for a much more impactful storm, especially from coastal NJ to LI, but possibly a little further NW as well e.g. NYC, southern CT.
-
This article speaks more about skill of AI models in medium range (beyond day 5), but I believe same applies in the 3-4 day range - AIFS ensemble has superior skill to EPS and other physics-based ensembles. AI-GEFS has superior skill to GEFS but isn't as skillful as AIFS ensemble. https://x.com/Brady_Wx/status/2021333729088585882 Given that GEFS and GEPS are closer than the EPS to AIFS ensemble (as well as AI-GEFS) in terms of more amplified trough initially over Ohio Valley/Great Lakes with more downstream ridging, and deeper upper low closer to the mid-Atlantic coast, I would weight them more than EPS in this setup. All models shifted in that direction (when compared to yesterday's 0z run) after ingesting a new batch of upper air data from recon. It appears to me that the EPS under-amplification bias may be at play here and it is most likely playing catch-up here, like the AI summary that Sacrus posted intimated happens sometimes in NE US winter storms.
-
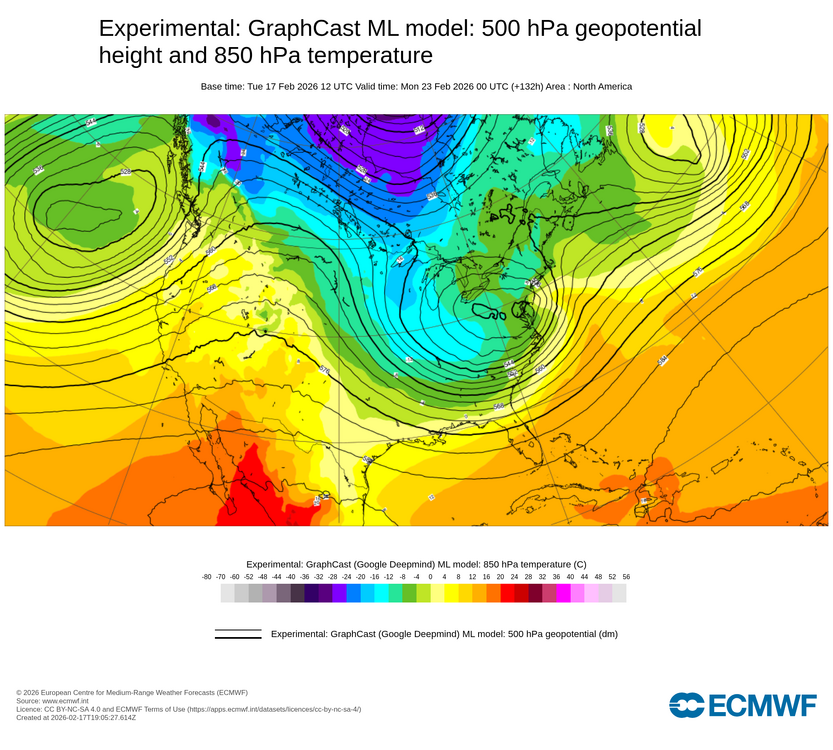
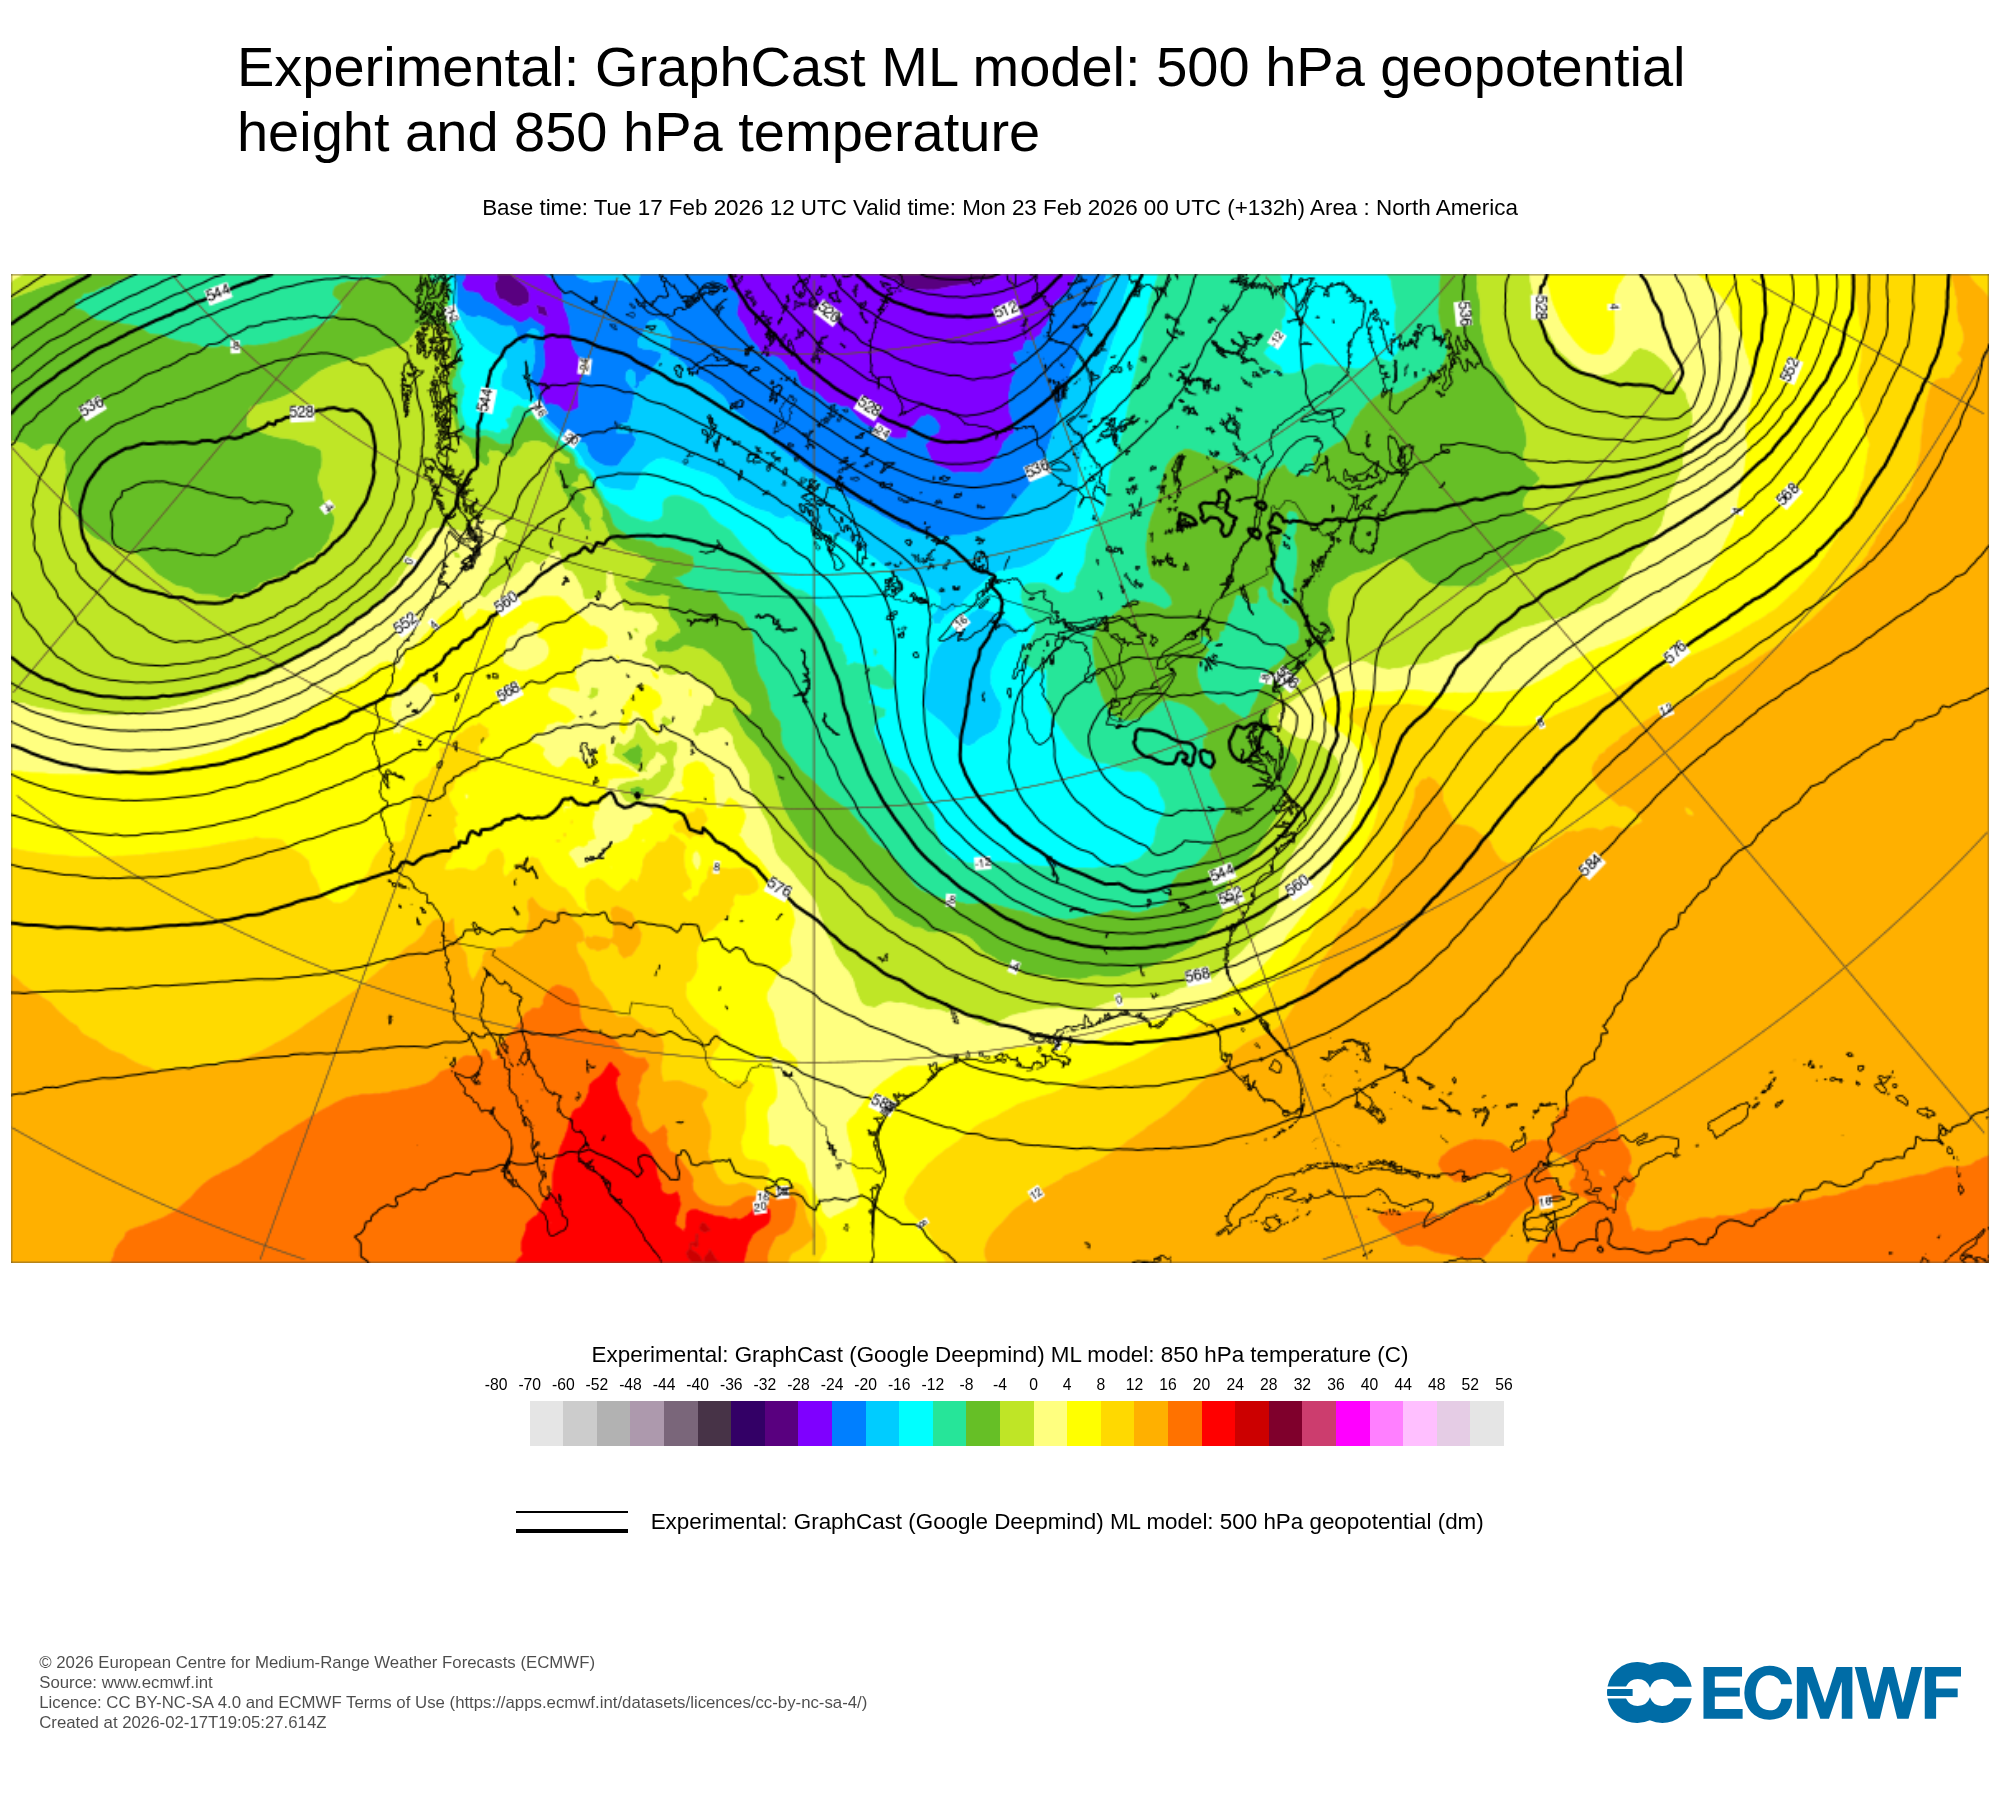
Basically agree with Brooklynwx. From past experience given the run to run consistency and cross-model agreement amongst the various ML models including AIFS and its ensemble, WeatherNext, GraphCast and Pangu, I would expect the EPS to shift closer to their scenario in the next 24-36 hours.
-
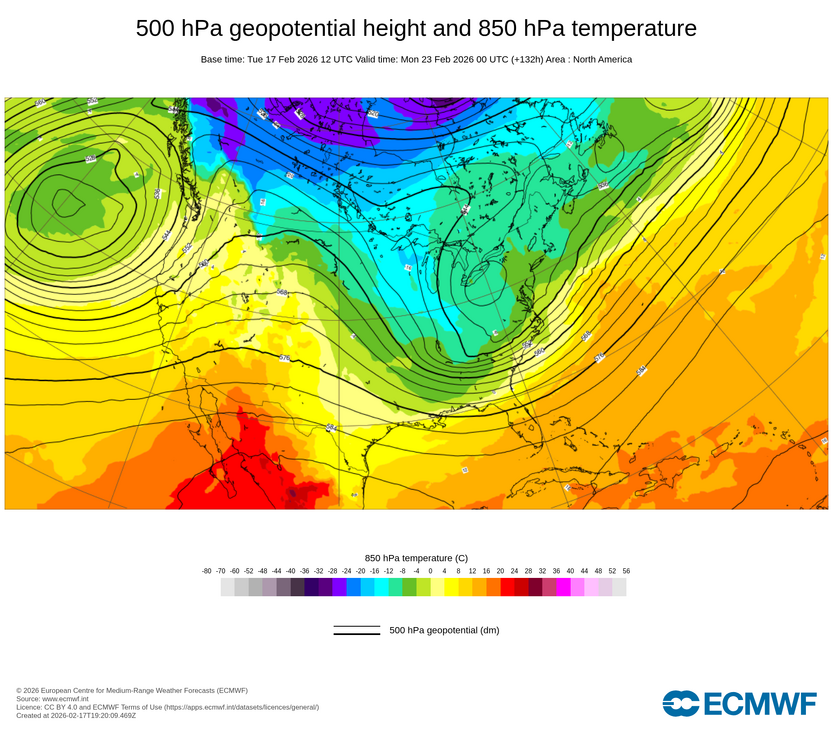
It is encouraging to see two other highly skilled ML models (GraphCast and Pangu) show an outcome very similar to the AIFS and also similar to AIFS ensemble mean, without the entanglement of the the Sun-Mon system with the system ahead of it across SE Canada shown by the operational ECMWF (last image).
-
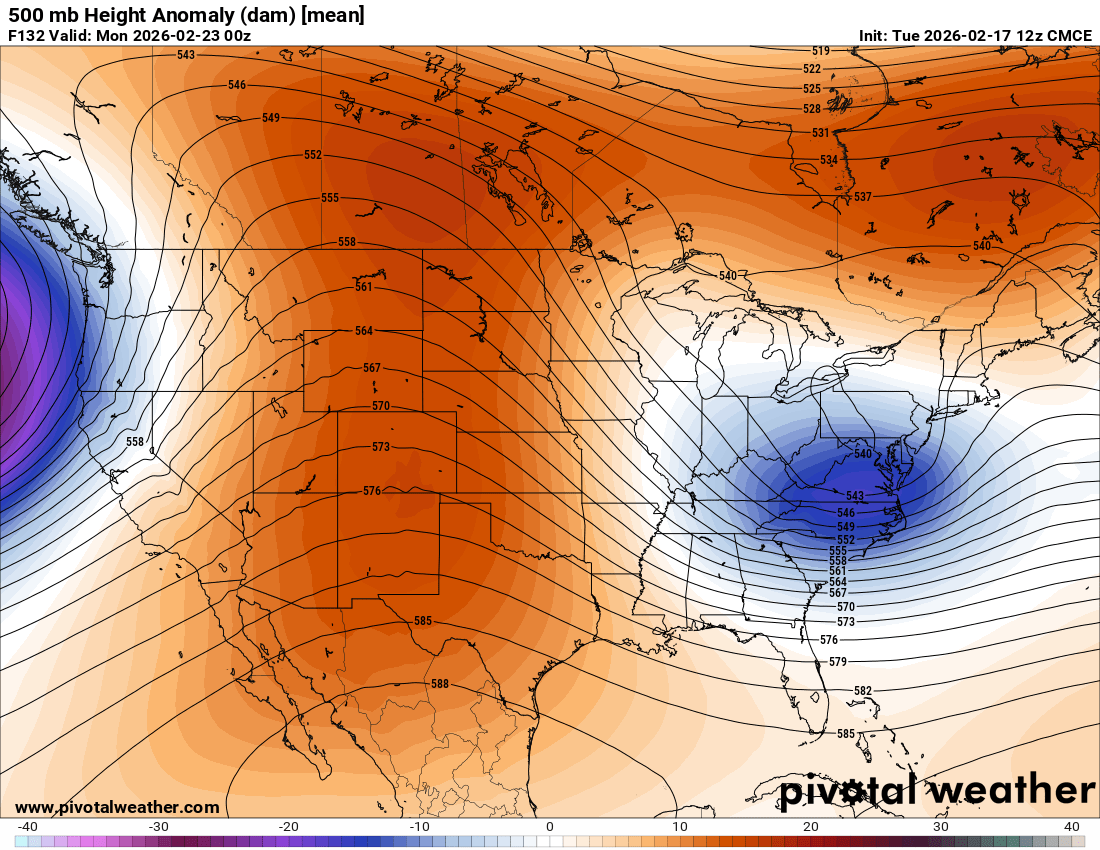
The GEPS showing similar trends to the AIFS ensemble, though today's 12z run is a bit more suppressed than the 0z as the trough turns negative tilt near the NE US coast.

-
Impressive four run trend from the AIFS ensemble. Note the western ridge trending further west and more amplified. Meanwhile the combination of the ridging east of Hudson Bay and trough over SE Canada exerts less of a suppressive influence, allowing the Sun-Mon trough to amplify more.
.thumb.gif.0e2c4df72f4ea87ea3b84db85b610251.gif)
-
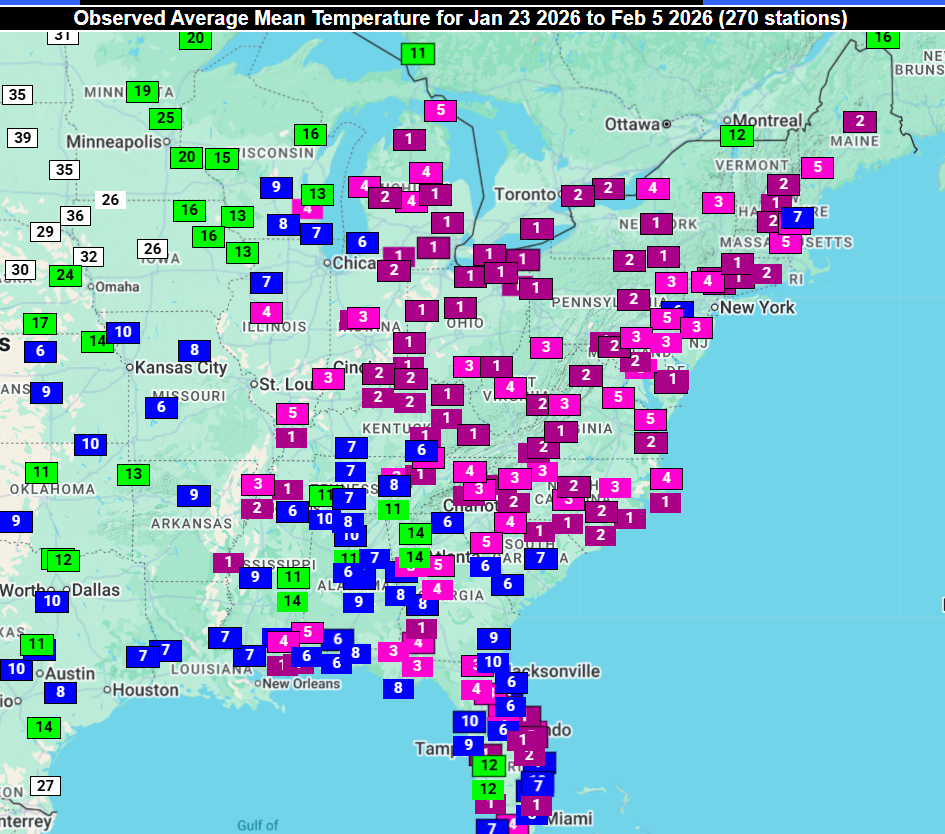
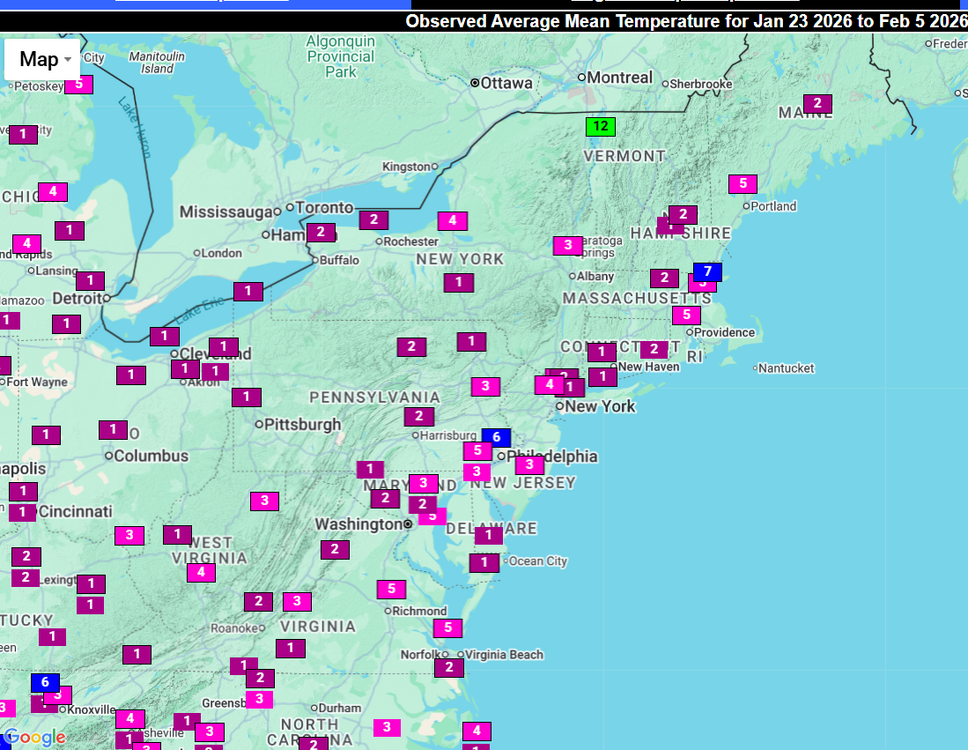
Most of the NE US is in the lowest 5 percentile for cold past two weeks, with many stations in the lowest 1 to 2 percentiles.

-
Top 10 cold period past two and a half weeks for eastern US: https://x.com/wxjerdman/status/2019729810914992195
-
I think mid-next week (Feb 11-12) definitely bears watching. UKMET hinting at it too now. https://x.com/yconsor/status/2019130515606155376


.png.763473f3d62a0e9cb9fdc4152c695840.png)


.gif.f47dc26460d8986c855b15b25da5fe37.gif)