

mitchnick
-
Posts
28,735 -
Joined
Content Type
Profiles
Blogs
Forums
American Weather
Media Demo
Store
Gallery
Everything posted by mitchnick
-
2026-2027 Super El Nino
mitchnick replied to Stormchaserchuck1's topic in Weather Forecasting and Discussion
I'm interested to see if the new Euro will light up in the tropical western Pacific since it was BN last month and only slightly AN in the eastern Pacific. -
With the projected strength of this Niño, anything on our side is encouraging at this point!
-
2026-2027 Super El Nino
mitchnick replied to Stormchaserchuck1's topic in Weather Forecasting and Discussion
I'm inland at 600', but the hills to my N & NE would be the better spot. Of course, if that was to happen, I'd say it would then be a shutout for most until January. -
2026-2027 Super El Nino
mitchnick replied to Stormchaserchuck1's topic in Weather Forecasting and Discussion
Warm early with better chances after the New Year is pretty much what current seasonal modeling (that goes through at least March) is showing. That said, as was posted earlier, with October Niños usually BN, I wouldn't be surprised if someone in the east, preferably higher elevations, get a fluke October or early November snowfall. Just a hunch. -
2026-2027 Super El Nino
mitchnick replied to Stormchaserchuck1's topic in Weather Forecasting and Discussion
The exact opposite. I posted earlier that I liked the fact the Cansips faded the Niño west over the winter. He didn't quote me because that the way he operates. -
2026-2027 Super El Nino
mitchnick replied to Stormchaserchuck1's topic in Weather Forecasting and Discussion
Sad -
2026-2027 Super El Nino
mitchnick replied to Stormchaserchuck1's topic in Weather Forecasting and Discussion
That's not east based. I like the way warmest anomalies fade west. -
2026-2027 Super El Nino
mitchnick replied to Stormchaserchuck1's topic in Weather Forecasting and Discussion
Good news -
2026-2027 Super El Nino
mitchnick replied to Stormchaserchuck1's topic in Weather Forecasting and Discussion
Sun has become pretty active again contrary to your typical transition to a minimum. Let's see if that continues. https://solen.info/solar/index.html -
2026-2027 Super El Nino
mitchnick replied to Stormchaserchuck1's topic in Weather Forecasting and Discussion
Late to the party on this one, but this is the Cfs2 ssta map prog for December. Sure looks basinwide to these old eyes. Definitely not Modoki.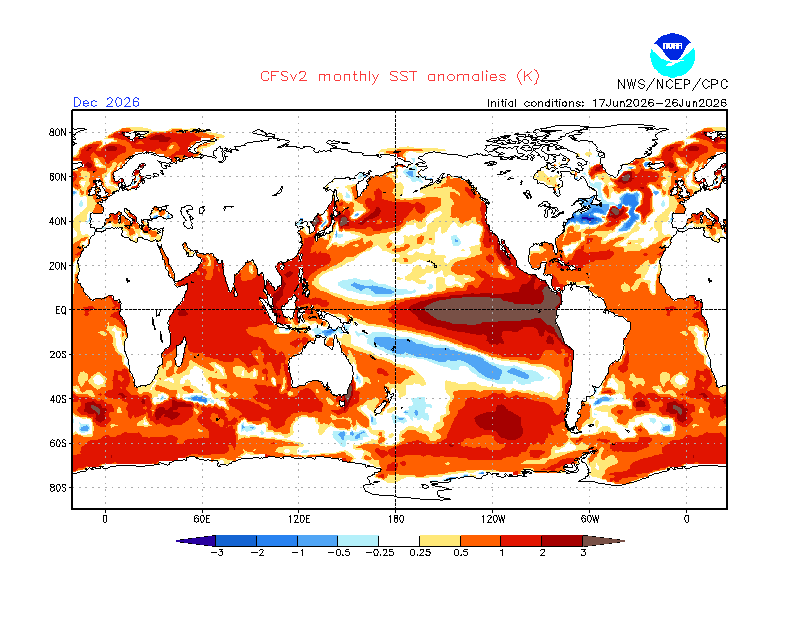
-
2026-2027 Super El Nino
mitchnick replied to Stormchaserchuck1's topic in Weather Forecasting and Discussion
Nope. You're apparently centered on I95 locations. -
2026-2027 Super El Nino
mitchnick replied to Stormchaserchuck1's topic in Weather Forecasting and Discussion
Sux to be those other places. But most are centered around the I95 concrete jungle heat island. No surprise there and to be expected as the development has not ended. -
2026-2027 Super El Nino
mitchnick replied to Stormchaserchuck1's topic in Weather Forecasting and Discussion
Harrisburg Capital City Airport is -.8 thru June 26th. It's been closer to Niño around here. The heat waves this year have been transient or you wouldn't have a BN number thru the first 26 days of the month. Since this one won't start until Tuesday, the month will still likely end BN. My hunch is this heat will be transient again, but we'll have to see. -
2026-2027 Super El Nino
mitchnick replied to Stormchaserchuck1's topic in Weather Forecasting and Discussion
PDO still drifting higher regardless and contrary to last year's drop at this point..png.36d678cd1579437e704af09c6a82f83a.png)
-
2026-2027 Super El Nino
mitchnick replied to Stormchaserchuck1's topic in Weather Forecasting and Discussion
Unfortunately, in this hobby, no bias = no hope! Lol -
2026-2027 Super El Nino
mitchnick replied to Stormchaserchuck1's topic in Weather Forecasting and Discussion
Won't be a record year, save the highest elevations. No one has said otherwise. But it's incredible how just posting model progs can cause such a stir. But as I said in my post to Michigan, no seasonal forecasts I've seen are flat out furnaces in the east. That and the surprisingly cold forecasts by at least the Cansips and Jamstec make me at least optimistic for a few snow chances considering the AN precip along the coast by most models. -
2026-2027 Super El Nino
mitchnick replied to Stormchaserchuck1's topic in Weather Forecasting and Discussion
The fact that you would put in writing the last sentence is what you live for says it all about you. Just sayin'. And to think you denied it before last winter when I accused you of just that. -
2026-2027 Super El Nino
mitchnick replied to Stormchaserchuck1's topic in Weather Forecasting and Discussion
Yep. So far, there are no seasonal forecasts that are undeniable furnace forecasts in the east, save maybe for NNE. But NNE can still get lots of snow with AN+ temps. -
2026-2027 Super El Nino
mitchnick replied to Stormchaserchuck1's topic in Weather Forecasting and Discussion
The Jamstec. My new favorite seasonal model...so far. https://www.jamstec.go.jp/aplinfo/sintexf/e/seasonal/outlook.html -
Looks Modoki, but that's probably a long shot at this point. But it's not alone completely as Cansips has a more Modoki/central Pacific centered max: https://www.tropicaltidbits.com/analysis/models/?model=cansips®ion=global&pkg=sstaMean_noice_month&runtime=2026060100&fh=8
-
The wait is over. After today, shorter days until late December. One thing I'm noticing is, despite chances for AN temps among some models, I'm not seeing any all out furnace runs...not yet at least. Happy Fathers Day to all the fathers out there.
-
2026-2027 Super El Nino
mitchnick replied to Stormchaserchuck1's topic in Weather Forecasting and Discussion
Great post! Averaging out Dec-Feb, it doesn't really look too much different from the NMME in the east. I don't care about its forecast for the rest of the world. -
2026-2027 Super El Nino
mitchnick replied to Stormchaserchuck1's topic in Weather Forecasting and Discussion
Looks beautiful! -
2026-2027 Super El Nino
mitchnick replied to Stormchaserchuck1's topic in Weather Forecasting and Discussion
Here are CPC numbers for all 4 Enso areas for 6/10/15 & 6/10/26: 10JUN2015 25.5 2.0 27.8 1.2 28.7 0.9 29.8 0.9 10JUN2026 26.1 2.7 28.3 1.6 29.2 1.5 30.1 1.3ⁿ If you divide Enso 1.2 anomaly into the other 3 areas' anomalies for both years, you get respectively 60%, 45% and 45% in 2015 and 59.25%, 55.55% and 48.15% this year. Comparing the 2 years, Enso 3 is nearly identical for both years and 3.4 and 4 are a hair warmer this year than 2015. Obviously, there may be other ways to figure it, but I'd have to say that they are very similar with a slight edge to 2015 as being more east based under this method. P.s. @GaWx will surely check my math! Lol -
2026-2027 Super El Nino
mitchnick replied to Stormchaserchuck1's topic in Weather Forecasting and Discussion
Time would be my guess.


