

mitchnick
-
Posts
28,729 -
Joined
Content Type
Profiles
Blogs
Forums
American Weather
Media Demo
Store
Gallery
Everything posted by mitchnick
-
2026-2027 Super El Nino
mitchnick replied to Stormchaserchuck1's topic in Weather Forecasting and Discussion
You've posted this several times this year and even before the 24/25 winter. So are you saying the ridges will be or won't be stronger and thereby causing current seasonal modeling for the southeast, mid atlantic, and/or northeast to be wrong? I mean you could be right, or you could be wrong obviously, but your post appear to be simply saying "current seasonal modeling could be wrong." Forget about the rest of the globe because I'm sure we'll find seasonal modeling too strong or weak with ridges/troughs as that's a given. -
2026-2027 Super El Nino
mitchnick replied to Stormchaserchuck1's topic in Weather Forecasting and Discussion
My point was despite any warming, last year's Niña was pretty canonical. This year's Niño can still happen (canonical) by either the PDO coming around or the Niño overwhelming it. And when you consider all the seasonal models are pretty well aligned to one, odds favor it short of a total failure of all seasonal modeling. -
2026-2027 Super El Nino
mitchnick replied to Stormchaserchuck1's topic in Weather Forecasting and Discussion
Idk, last year's Niña was pretty standard for Niñas with snows along the east coast and cold. -
2026-2027 Super El Nino
mitchnick replied to Stormchaserchuck1's topic in Weather Forecasting and Discussion
Well, I'm happy with the new Cansips. Still too cool up north I suspect, but the precip anomalies are great if you like coastal and temps are more than workable for many I would say. And fwiw, the end of the run is cooling waters around Japan dramatically and warming the NE Pacific. End of -PDO maybe, or at least working on it? Definitely working to build a Niña at the end though. 500mb starting December: https://www.tropicaltidbits.com/analysis/models/?model=cansips®ion=namer&pkg=z500a&runtime=2026080100&fh=4 Surface temps starting December: https://www.tropicaltidbits.com/analysis/models/?model=cansips®ion=us&pkg=T2ma&runtime=2026080100&fh=4 Precip starting December: https://www.tropicaltidbits.com/analysis/models/?model=cansips®ion=us&pkg=apcpna_month&runtime=2026080100&fh=4 -
2026-2027 Super El Nino
mitchnick replied to Stormchaserchuck1's topic in Weather Forecasting and Discussion
It's bad enough current SSTA vary from different products/sources, now we have models prog depictions following along. No wonder there's rarely agreement on forecasts...or on this Board! Lol -
2026-2027 Super El Nino
mitchnick replied to Stormchaserchuck1's topic in Weather Forecasting and Discussion
I thought the discussion was regarding El Niño summers. What relevance does throwing La Nada or Niñas into the mix have? Subtle deflect however. -
2026-2027 Super El Nino
mitchnick replied to Stormchaserchuck1's topic in Weather Forecasting and Discussion
It was. My daughter was born in August of 91'. My wife remembers it in more detail than me! Lol -
Only "leaning" AN, so even if right, possibly muted at times.
-
2026-2027 Super El Nino
mitchnick replied to Stormchaserchuck1's topic in Weather Forecasting and Discussion
Gotta' love how Florida is still in the snow despite being south of the mean slp track depicted on that map. The "A" part I believe...the "I" part, nasso' much. -
El Niño summer from here on out.
-
2026-2027 Super El Nino
mitchnick replied to Stormchaserchuck1's topic in Weather Forecasting and Discussion
That's pretty cool. -
2026-2027 Super El Nino
mitchnick replied to Stormchaserchuck1's topic in Weather Forecasting and Discussion
Especially considering the quality forecasts they can get on this Board. -
1.2" from the 2 thunderstorms that just passed through here. Looks like plenty more for most to come.
-
2026-2027 Super El Nino
mitchnick replied to Stormchaserchuck1's topic in Weather Forecasting and Discussion
Nope. It's called faith. -
2026-2027 Super El Nino
mitchnick replied to Stormchaserchuck1's topic in Weather Forecasting and Discussion
My mistake Larry. Sorry. Still, I contend the AN forecast in 23/24 from the Cfs2 was not bad as it was on the correct side of normal for the east+ and got warmer as the season approached. -
2026-2027 Super El Nino
mitchnick replied to Stormchaserchuck1's topic in Weather Forecasting and Discussion
Without going into a competing long response, I frankly just don't care about a warming planet. There's nothing I can do about it aside from having a well insulated home (which I have since I receive the highest rating from my local energy provider for houses my size) and driving a fuel efficient vehicle. It is not, nor has it ever been, on my list of life's concerns at all. I care about weather imby and judge that weather from current conditions and progs. How those conditions got there, I don't care. -
2026-2027 Super El Nino
mitchnick replied to Stormchaserchuck1's topic in Weather Forecasting and Discussion
I'm not taking anything personal on this Board. Lol I'm just being blunt. You've said several times that the seasonal models are just spitting out canonical enso winter forecasts and Cfs2 clearly didn't based on the temp forecast you criticized but never posted. And remember, you picked the 23/24 winter as the example. But we agree on 1 thing. The seasonal models won't be right in all locations around the globe. If you're going to judge them based on an entire continent or the world, then fine, they stink. But that doesn’t mean they can't be close in some areas. I only care about the east, specifically the N. Mid Atlantic. As Gawx has proven in several recent posts on the subject, they've been pretty good around here lately, including 23/24. So they are worth considering. And like I said, if they showed warm, please don't kid yourself that you wouldn't be posting or referencing them. -
2026-2027 Super El Nino
mitchnick replied to Stormchaserchuck1's topic in Weather Forecasting and Discussion
By the way, why didn't you bother to post the Cfs2 temp forecast for the 23/24 winter? Since we're nearing the end of July, this is what it had from the 8/1/23-8/10/23 period. Pretty warm (and not very Niño canonical), isn't it?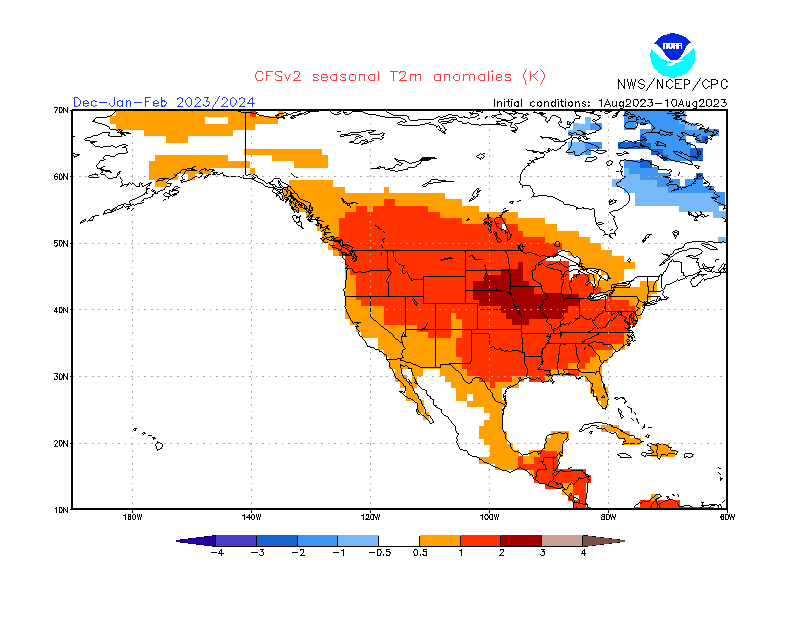
-
2026-2027 Super El Nino
mitchnick replied to Stormchaserchuck1's topic in Weather Forecasting and Discussion
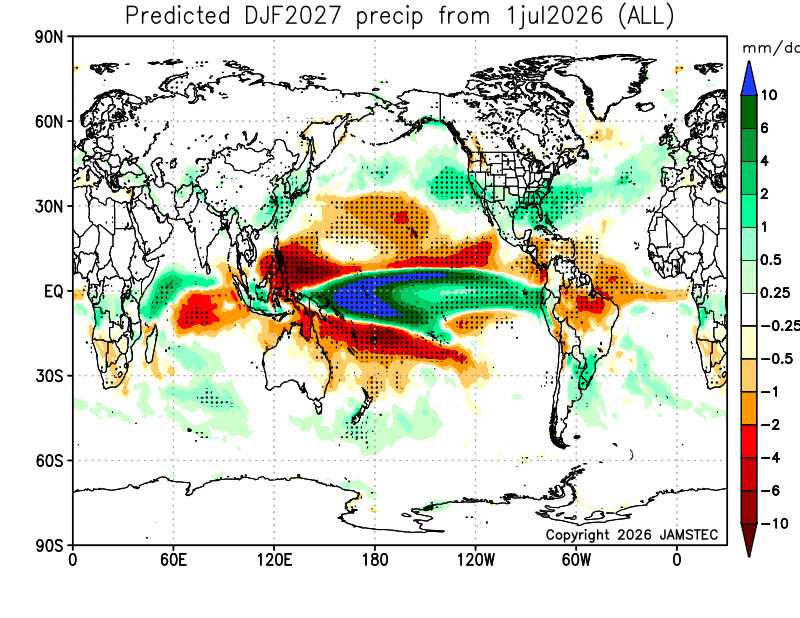
Tell it to the new Jamstec winter forecast. I'm just the messenger. Maps stink, but that's all they seem to offer.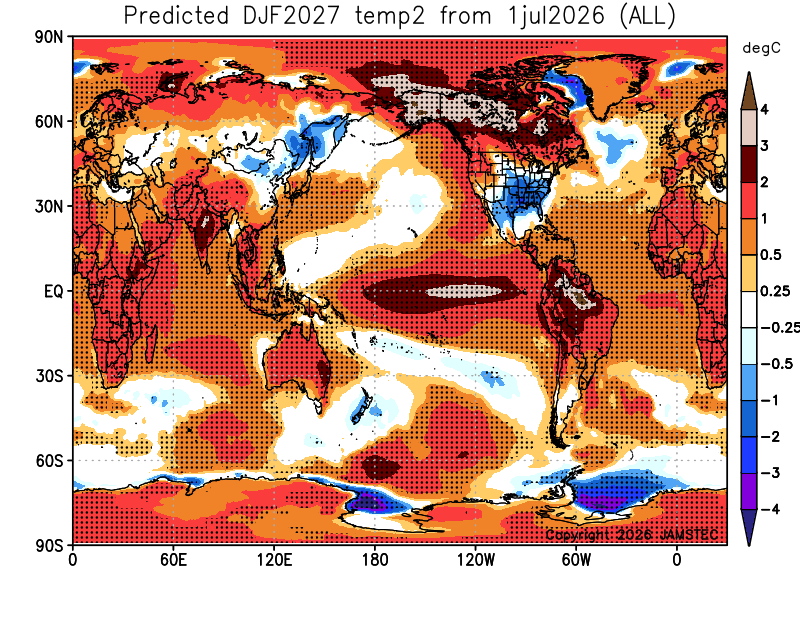
-
2026-2027 Super El Nino
mitchnick replied to Stormchaserchuck1's topic in Weather Forecasting and Discussion
Lol. That's definitely the 3rd time you pulled up 23/24 when you tried to back door dispute every seasonal forecast. First the NMME, then the Euro seasonal, and the Cfs2 at least this time if not more. As been discussed many times, this year ain't 23/24. But at this point, none of the seasonal modeling is showing anything close to 23/24. But I'm sure if one does, we'll see it posted by you more than 3 or 4 times. Honestly, I seriously believe you want it to be warm. Deny it all you want, but that's the impression I'm getting from you at this point. -
2026-2027 Super El Nino
mitchnick replied to Stormchaserchuck1's topic in Weather Forecasting and Discussion
This is December. Loop through it. They're not bad thanks to lower heights. Edit: NNE is obviously warmer as in most moderate or strong Niños https://www.tropicaltidbits.com/analysis/models/?model=cfs-mon®ion=eus&pkg=T2ma&runtime=2026071818&fh=5 2nd Edit: Here's the link to 850 temps starting December https://www.tropicaltidbits.com/analysis/models/?model=cfs-mon®ion=us&pkg=T850a&runtime=2026071818&fh=5 -
2026-2027 Super El Nino
mitchnick replied to Stormchaserchuck1's topic in Weather Forecasting and Discussion
I'll say this: Cfs2 continues to advertise a decent with pattern in the east this winter, including the illusive, albeit displaced at times, Aleutian Low. This is the link starting December. Loop through it and you'll see what I mean. https://www.tropicaltidbits.com/analysis/models/?model=cfs-mon®ion=namer&pkg=z500a&runtime=2026071818&fh=5 P.s. April looks near perfect too! -
2026-2027 Super El Nino
mitchnick replied to Stormchaserchuck1's topic in Weather Forecasting and Discussion
I generally agree, but I can't help but be in a "show me" mentality as long as the Euro seasonal seems so unimpressed with its forecast. I'd like to see it bust for the reasons stated, but only time will tell. -
2026-2027 Super El Nino
mitchnick replied to Stormchaserchuck1's topic in Weather Forecasting and Discussion
Daily Cfs2 plume charts are updated daily and hyperlinked to this site; past half way down. https://www.stormsurf.com/page2/links/ensocurr.html -
2026-2027 Super El Nino
mitchnick replied to Stormchaserchuck1's topic in Weather Forecasting and Discussion
That's what the Cfs2 was showing over 3 months ago when I posted. I was just the messenger. Obviously, Cfs2 forecast, updated multiple times a day, changed.


