

cbmclean
-
Posts
2,590 -
Joined
-
Last visited
Content Type
Profiles
Blogs
Forums
American Weather
Media Demo
Store
Gallery
Posts posted by cbmclean
-
-
1 hour ago, pazzo83 said:
isn't your independent variable here time, so that is what you are using to try to explain the variance in your observed data (snowfall)? Let's ignore the fact that running a simple linear regression on a time series, especially when there is a cyclical component here (thus the observations are not all IID), is problematic. But if you are trying to see if a warming base state would be used, you'd think you'd include something reflecting that in your analysis (and not just time).
Starting off with a linear regression is not unreasonable even if we suspect that the observations are not IID. I'm not completely sold on the existence of cycles, at least on a decadal scale. Purely random data can show lots of clumps suggestive of patters which are not really there. It would be very interesting to put the data through some sort of Fourier analysis to see if there any real periodicity, but I don't have the tools for that.
-
I'm assuming everyone saw that Pele has passed away.
-
On 12/28/2022 at 4:40 PM, Amped said:
So we're waiting for that early February pattern change again?
Yep- February of 2024.
-
2 hours ago, Ralph Wiggum said:
Inappropriate is subjective.
That is true.
-
On 12/17/2022 at 2:46 PM, nj2va said:
Tracking shorts or sweats for New Years Eve?
Shorts.
-
 3
3
-
-
Has Ravensrule always made inappropriate posts?
-
 1
1
-
-
I guess the idea to move statistics discussion here didn't work out. Stats haters can't blame me.
-
1
-
-
14 minutes ago, Ralph Wiggum said:
We've seen WAR help us before just last January iirc. But yeah, 9 out of 10 times what is it good for? Absolutely nothing. Say it again!
I dub thee God of WAR.
-
1
-
-
1 hour ago, donsutherland1 said:
Here it is:
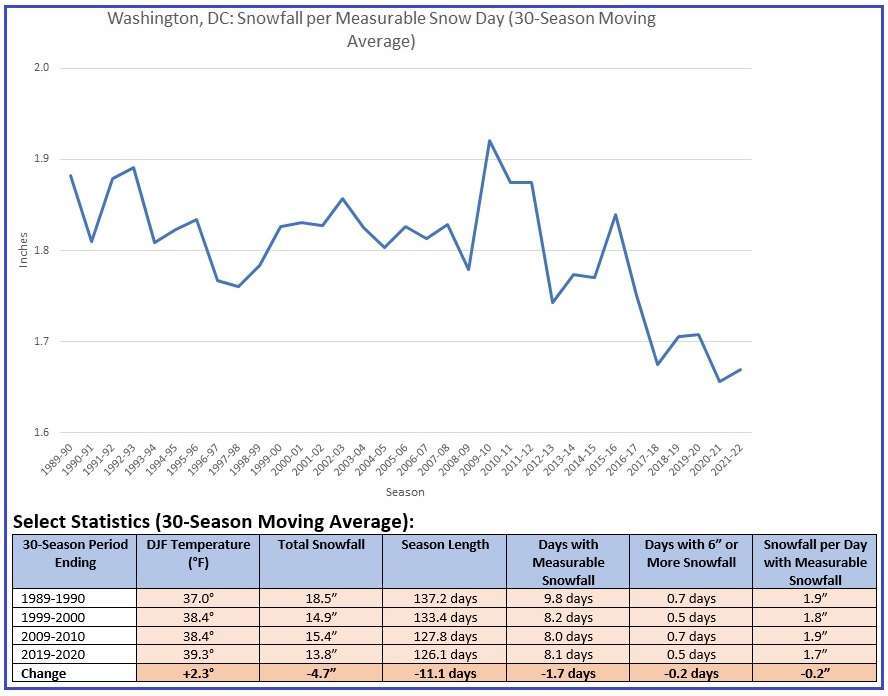
By the way, what is the definition of "Season Length"? First frost to last frost?
-
8 minutes ago, Maestrobjwa said:
Now that too would be the second time in 3 years...have we ever seen 2 raging +AO seasons in such a short span?
The previous raging ++++++AO season was 2019 - 2020, so that is 2 times in four seasons.
-
22 minutes ago, donsutherland1 said:
Here it is:
Thanks for the analysis Don.
-
1
-
-
3 minutes ago, Eskimo Joe said:
After Feb 14th, it's sun angle season. Our window is closing and quick.
Warning: adult language
-
1 hour ago, eurojosh said:
but when folks pop up to say it has no measurable effect on our Wx whatsoever (in the winter precip context) I'm always somewhat flabbergasted.
I don't think that strong of a claim was ever made, at least I did not see it. I think the claim boils down to: "there is not statistical evidence that the snowfall at DCA is in a long-term decline", which is a much smaller scope. Now from what I have seen in discussion here, I am still very skeptical of that claim, but I am interested to here what that fellow has to say in detail.
-
1 hour ago, WesternFringe said:
Honestly, this has me nerded out and I want to respond with specifics rn, but I need to take my daughter to her grandma’s house and eat dinner. I will get back to you tonight or tomorrow!
ETA: Did Mappy guide you to guide me here? Lol
Fell free to nerd out. I enjoy a good statistical analysis.
And no, no one asked me to move the discussion here but I noticed some impatience with it in the main thread, so this gets it out of the way for those who are not interested.
-
1
-
-
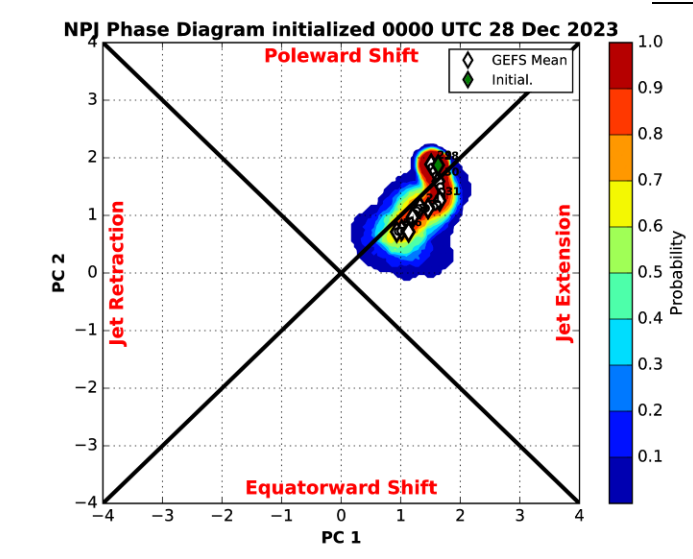
So here is the probabilistic forecast for the NPJ state from
https://www.atmos.albany.edu/facstaff/awinters/realtime/Probabilistic_NPJPD.php
I'm trying to understand how to interpret thia graph So looks like we are going from a "poleward phase" to an "extended phase". But the magnitude in the extended phase is not really all that high (I am assuming that magnitude equates to distance from the origin).
-
Perhaps this is a good place to discuss DCA snow statistics?
@WesternFringe I'd like to give your thesis a fair hearing. What specifically is your claim?
From your latest post I see: "the data don’t show a huge downturn". Some specific questions:
1. "Data": Which dataset are you using?
2. "Don't show": What do quantitatively are you claiming the data shows or does not show? Which metrics have you calculated to evaluate that claim? From the recent debates in the thread it seems as if you were focusing on decadal averages of the 1980's vs the 2010s. Is that accurate?
3. "huge": What would constitute a huge downturn?
-
34 minutes ago, DarkSharkWX said:
Another presentation about the NPJ if anyone is interested in it:
https://www.weather.gov/media/sti/nggps/Presentations 2017/08 NGGPS17_PImeeting_Bosart.pdfThanks for the link, interesting stuff.
-
27 minutes ago, CAPE said:
That's a PowerPoint presentation(in pdf) based on the paper referenced in my post. Good overview.
Thanks for the information, as always!
-
1
-
-
1 hour ago, CAPE said:
There are actually NPJ phase diagrams that define the different configurations- extended, retracted, more poleward and extended etc. Per those diagrams, the combo of extended and/or poleward favors a +PNA. But like I said, too extended causes the trough to be too far east and impinge on the west coast. Always a delicate balance. Getting snow is hard here lol.
What factors impact the strength and position of the NPJ? From weather 101 I would expect the strength to positively correlate with the latitudinal temperature gradient. That would make me expect the NPJ to be getting weaker. So I guess that's not the whole story. I remember earlier seeing something about EAMT playing a role. I also remember one of @psuhoffman's "sweet dreams for @Maestrobjwa" posts from last year saying that the WPAC warm pool might be making it stronger?
Since there's nothing to track, lets do a NPJ tutorial, if anyone has knowledge they'd like to share.
-
8 hours ago, WxUSAF said:
A shift to a more favorable longwave pattern remains steady around the 7th/8th. Not much else worth looking at IMO before this weekend assuming that doesn’t change.
Eastern ridge definitely starting to be beat down by Jan 8th, but 2m anomalies still mostly warm through Jan 12. Not sure of that is residual from Pac Puke or just the new pattern is meh.
-
1 hour ago, Ralph Wiggum said:
Soooo, how bout those +height anomalies at HL on the GEFS in the LR?
What hour are you looking at?
-
26 minutes ago, 87storms said:
If we're assuming the data since 1887 is a sample size, then anything over 100 is large enough and, per the CLT, all you need is 30+ data points to estimate the mean.
The CLT only applies if the variables are independent and identically distributed. I suspect that this does not apply to at least some aspects of weather/climate.
-
36 minutes ago, BristowWx said:
Hr 282 and hr 360 on 12z op GFS are great examples of what happens with out a 50/50 low. We get a result that begins with a "c"
Celebration?
-
1
-
3
-
-
25 minutes ago, Heisy said:
Seeing better confluence for this time period showing up. We just had the GFS fantasy run, CMC looks better as well. Probably not enough confluence/cold air but trending right direction at least?

.For one who is trying to learn, would you mind pointing out the features which indicate confluence?
-
 1
1
-
January 2023 Mid-Long Range Disco
in Mid Atlantic
Posted
TT only lets us see out to 144 and I'm too cheap to get WB for now. Is it good or bad?