

cbmclean
-
Posts
2,590 -
Joined
-
Last visited
Content Type
Profiles
Blogs
Forums
American Weather
Media Demo
Store
Gallery
Posts posted by cbmclean
-
-
59 minutes ago, WinterWxLuvr said:
Lol true. I think Randy banished him or he drank himself into a coma. Not sure which.
Speaking of MIA, Chuck has been quiet lately. Hope he is ok.
-
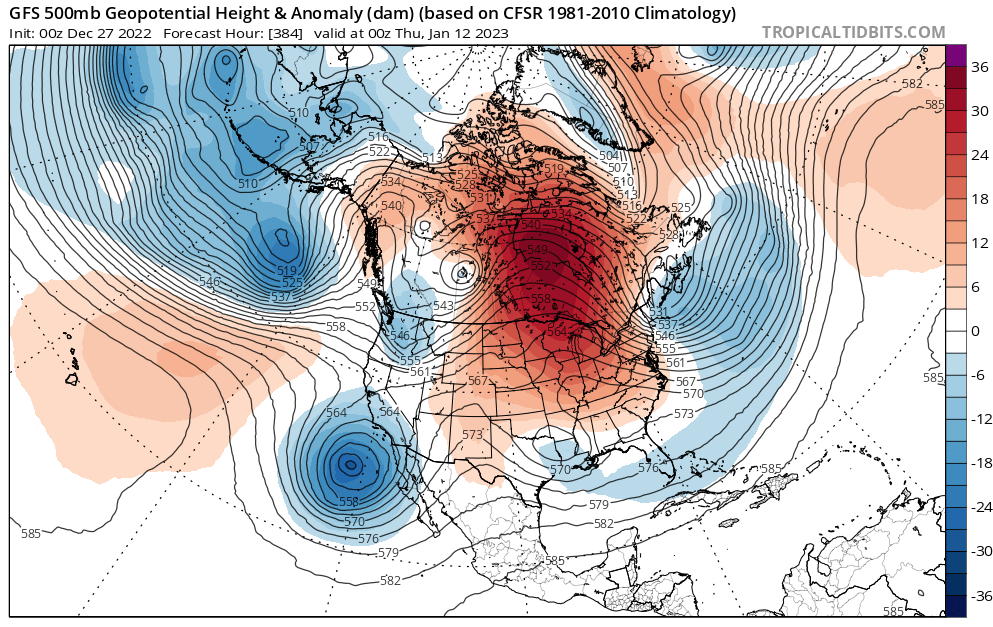
I see Ji would be happy at around Hr 300 on the 00z GFS. That aside that GFS run does not amuse me. Way too much blue at H5 around Alaska all the way to 384. At 384 perhaps the merest hint of a nascent -EPO building in the Yukon. I know op at range worse than useless. But if people can be happy about the blue I can be sad about the other blue.
-
4 minutes ago, Terpeast said:
Couple of things.
First, for the models to work well, they use pressure as a vertical coordinate system instead of height. Instead of 2,000 feet 4,000 ft 10,000 ft and so on, you have 900mb 800mb 700mb all the way up to 10 mb. It’ll be too complicated for the models/equations otherwise.
Second, geopotential height patterns tells you where the warm air masses and cold air masses are. The higher the geopotential height at the 500mb pressure surface (think coordinate system), the warmer the airmass. The lower the geopotential height is, the colder the air mass.Now, when you have a cold and warm airmass butting up against each other, there is wind… and the stronger the temperature gradient between the air masses, the stronger the wind is. And it is that wind that controls the flow and track of storm systems.
Took me three paragraphs to explain it. Maybe someone else can do it in one.
Thank you for taking the time to explain this. Can you help me understand how blocking works? I am particularly trying to understand why a 50/50 low makes a -NAO more effective as a blocking agent.
-
Gonna be pretty quite for a while as we wait for the vortex to retrograde. Anyone care to spend a paragraph to explain the way in which patterns of geopotential height controls the flow of airmasses and storm systems? I'm having trouble finding that level of detail on easily available internet resources. The closest I can find is a mention on the Wikipedia articel about geopotential height:
"Geophysical sciences such as meteorology often prefer to express the horizontal pressure gradient force as the gradient of geopotential along a constant-pressure surface, because then it has the properties of a conservative force. For example, the primitive equations which weather forecast models solve use hydrostatic pressure as a vertical coordinate, and express the slopes of those pressure surfaces in terms of geopotential height."
So if this is accurate patters of gph are actually equivalent to patterns in plain air pressure gradient force. This intrigues me but I do not understand how it is so.
Anyone feeling didactic tonight?
-
I'd say we're on the way up on the sine graph.
-
18 minutes ago, psuhoffman said:
You gonna yell at me again if I answer?
Actually it did verify to some extent as seen in the composite posted by DarkSharkWX. But as he noted the ridge axis was considerably further west than ideal.
Edit: And yes I know the MA used to not always need perfect ridge axis placement for snow.
-
31 minutes ago, DarkSharkWX said:
From Dec 15(around time when we were expected to go into a favorable pattern) - Dec 24(latest date available) there doesn't seem to be any sign of a -PNA/SER at all. The PNA not being east enough(not over the Rockies) and the lack of 50/50 are one of the factors that contributed into the pattern not doing well.

Interesting that in that composite no WAR really shows up, but we know it was there when it counted. You can also see that the mean trough is much further west compared to say Dec 2010 or March 2018 which itself hints of higher heights in the SE.
-
 1
1
-
-
18 minutes ago, Maestrobjwa said:
To balance out that shrink-worthy post...thoughts on this? (This is actually very informative for those of us who want to understand the PV better)
Now I know looking to a SSW is a bit of a desperation move...but I'm wondering if anyone can recall any instances where one of these actually helped us? Lol
I cannot personally remember a SSW event that worked for the eastern CONUS. But I believe that the Great Plains blast of Feb 2021 was related to a SSW event from that January. So in theory that could happen to us next time (although I could do without the power grid disruptions). Or alternatively our new super-WAR overlord might mean that SSW-related cold blasts will forever shunted away from us. I say that in jest, but I think it is something that needs to be considered.
-
1 minute ago, psuhoffman said:
no hope shit the blinds pattern setting in
I know this was a typo but I think it should be made an official pattern descriptor. If it's worse than shut the blinds its
SHITS THE BLINDS
-
2
-
 7
7
-
-
Depressing statistics aside I would say that this month has actually been a good one for long-range guidance as far as verification performance. They missed the "squirting" vortex which looked to be previously trapped under the ridging ~12/10 but since then they've all been spot on as far as I can tell. They saw the transition period from 12/15 or so followed by chilly temps followed by a full-fledge arctic blast. They saw the rapid transition to Pac Puke following the collapse of the -EPO. And they saw it all at long lead times. Yeah they did initially fail to see the giant cutter that crushed our dreams of a white Christmas, but they did unanimously catch on ~120 hours with some catching on long before that (the GFS suite was the hold out for a long time).
My understanding is that the GEFS and GEPS are both showing some signs of hope after the puke period. Hopefully the EPS is also on board (can't see past 144 on TT).
-
36 minutes ago, North Balti Zen said:
But we (MA and the SE) are both at ~200% of the average epic pattern quota.
-
I'm hearing reports of strains on the grid with Duke power. Anybody have issues?
-
Merry Christmas to my foster weather family.
-
4
-
-
3 hours ago, North Balti Zen said:
SIGH
Could be worse. Imagine if you were in that tiny area of central Illinois with no snow. Somebody there pissed off Santa.
-
1
-
-
21 minutes ago, psuhoffman said:
Merry Christmas

Is there a 50/50 low in any of those packages?
-
2
-
2
-
-
1 hour ago, Daniel Boone said:
That 50-50 is more crucial than many realize.
Learned that the hard way this month.
-
1
-
-
Got down to 1 F last night in Old Fort. Man if that snow storm had actually occurred as it been depicted imagine the records that would have been shattered.
-
1
-
-
And finally, unrelated to my recent posts, I remember some discussion about whether or not the GEFS had been updated to run on the "new" GFS dynamic core. I stumbled across this article while looking for more reanalysis data. Apparently GEFS went to FV3 way back in Sept 2020.
https://journals.ametsoc.org/view/journals/wefo/37/6/WAF-D-21-0112.1.xml
The Global Ensemble Forecast System (GEFS) is upgraded to version 12, in which the legacy Global Spectral Model (GSM) is replaced by a model with a new dynamical core—the Finite Volume Cubed-Sphere Dynamical Core (FV3). Extensive tests were performed to determine the optimal model and ensemble configuration. The new GEFS has cubed-sphere grids with a horizontal resolution of about 25 km and an increased ensemble size from 20 to 30. It extends the forecast length from 16 to 35 days to support subseasonal forecasts. The stochastic total tendency perturbation (STTP) scheme is replaced by two model uncertainty schemes: the stochastically perturbed physics tendencies (SPPT) scheme and stochastic kinetic energy backscatter (SKEB) scheme. Forecast verification is performed on a period of more than two years of retrospective runs. The results show that the upgraded GEFS outperforms the operational-at-the-time version by all measures included in the GEFS verification package. The new system has a better ensemble error–spread relationship, significantly improved skills in large-scale environment forecasts, precipitation probability forecasts over CONUS, tropical cyclone track and intensity forecasts, and significantly reduced 2-m temperature biases over North America. GEFSv12 was implemented on 23 September 2020.
-
 1
1
-
-
And that's all I could at this link:
https://psl.noaa.gov/cgi-bin/data/narr/plotmonth.pl.
It says that plots are only available for data going back to January 1979. From the previous post it looked like someone has data goign back to at least 1950. Anyoen have any idea where I can get that?
-
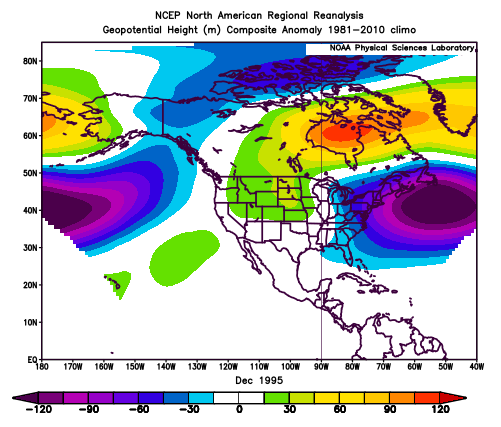
December 1995. Crazy east trough although mostly off-shore. Definitely no WAR. Western ridge is also displaced east.
Actually from the North American view this doesn't look like a massive -AO. Maybe the other side of the artic was high?
-
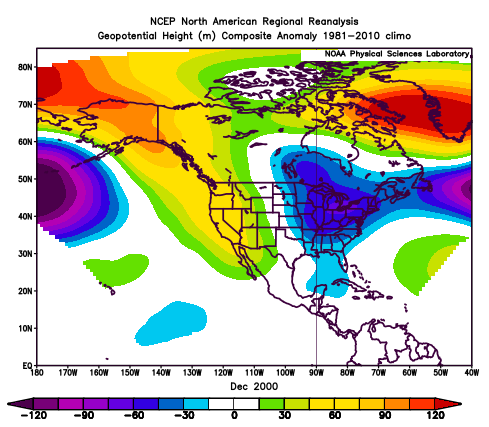
December 2000 will always have a fond place in my memory. HGad just went off to college where I really blossomed after a difficult high school experience. And the late fall/early winter was memorably chilly.
-
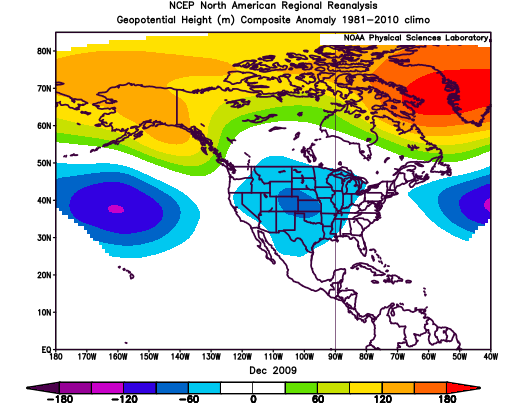
Dec 2009
Quite different. No mean E trough at all. Instead negative anomalies centered over the great plains.
-
9 hours ago, CAPE said:
It might be interesting/useful for you to create an h5 anomaly plot for each of those Decembers individually.
Well start going backwards in time.
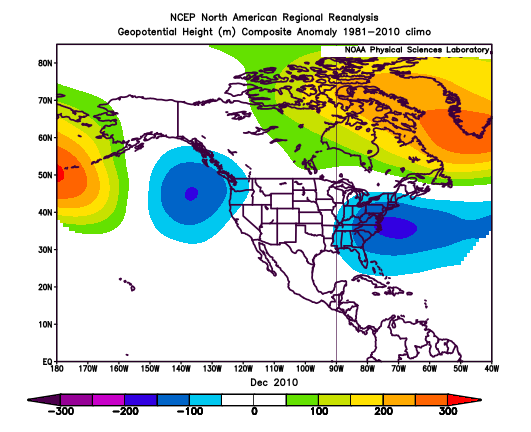
Dec 2010. Eastern trough is centered rather south compared to the composite and a good bit off shore. No mean western ridge.
-
11 F in Old Fort
January 2023 Mid-Long Range Disco
in Mid Atlantic
Posted
Looking at the GEPS and the GEFS together with the end of the GFS I am noting a significant trend of positive anomalies centered around Hudson Bay, and weaker but still widespread negative anomalies around the Aleutians. Not horrible. Generally kind of ridge-ish in the west. Better than pac puke. GEFS example below.