MegaMike
-
Posts
576 -
Joined
-
Last visited
Content Type
Profiles
Blogs
Forums
American Weather
Media Demo
Store
Gallery
Everything posted by MegaMike
-
It's an experimental model that doesn't predict moisture/heat flux based on fluid dynamics. As a result, it's totally unreliable in my opinion... It's probably the reason why the NWS doesn't refer to it in their forecast discussions. Can't wait to see how it performs during the warm season. With limited training data on hurricanes, I expect it to perform terribly with tropical disturbances.
-
 I agree with you both. To evaluate snowfall, you really need to evaluate SWE, as well. For that matter, you'd need to evaluate forcing fields too (ensure SWE was predicted accurately for the right reasons). If SWE was under predicted, but a snowfall algorithm performed well, that algorithm isn't showing accuracy... It's showing a bias. Unfortunately, snowfall evaluations are tricky because of gauge losses wrt observations. Not everyone measures the same either... Can of warms, snowfall is. A met mentioned this earlier too, but the more dynamic an algorithm is, the more likely errors exacerbate. The Cobb algorithm is logically ideal for snowfall prediction, but compounding error throughout all vertical layers of atmosphere likely inhibits its accuracy. Snowfall prediction sucks which is probably why there are only a handful of publications. Otherwise, these vague algorithms wouldn't be widely used by public vendors.... It's the bottom of a very small barrel.
 -
I've never heard of Spire Weather before, but based on their website, it looks like it's another AI modeling system (someone correct me if I'm wrong). It doesn't take much to run an AI model... Especially since the source code for panguweather, fourcastnet, and graphcast are available online for free: https://github.com/ecmwf-lab/ai-models My recommendation: If they don't evaluate or provide modeling specifications, don't use it.
-
I'm not sure if you're being sarcastic, but please don't use the CFS for this. The CFS is a heavily truncated (low horizontal, vertical, and temporal resolution) modeling system solely intended for climate forecasting. It won't perform well with a dynamic beast (which may or may not occur).
-
I have a hard time trusting the NAM 3km due to an issue (possibly patched or related to a vendor?) caused by its domain configuration and dynamics/physics options... If I remember correctly, if a large-scale disturbance moved too quickly, a subroutine will sporadically calculate an unrealistic wind speed (only aloft) at certain sigma levels... Can't predict atmospheric flux if a forcing field is kaput. I need to find this case study... It's pretty interesting and it happened twice from ~2016-2020. The erratic nature of NAM is off-putting too, but I'm thinking that's related to its ic/bcs... Before a system materializes, you're solely relying on ic/bcs from a regional modeling system. Those regional modeling systems cannot effectively predict, or even initialize, small-scale/convective features which leads to significant error over time. The same forecast volatility will likely occur to other mesoscale modeling systems if they ran past 48 hours. While on topic: I would like to see vendors start using the RRFS (https://rapidrefresh.noaa.gov/RRFS/; currently under development)... especially for snowfall and precipitation forecasting. It's a unified, high resolution modeling system which runs every hour. Consider it like the GEFS, but with the HRRR. The NBM/HREF are great, but its a waste of resources to post-process different mesoscale modeling systems onto a constant grid. Let's just be happy nobody mentioned the NOGAPS. Also not a fan of the ECMWF AI... That model is for data scientists, not meteorologists.
-
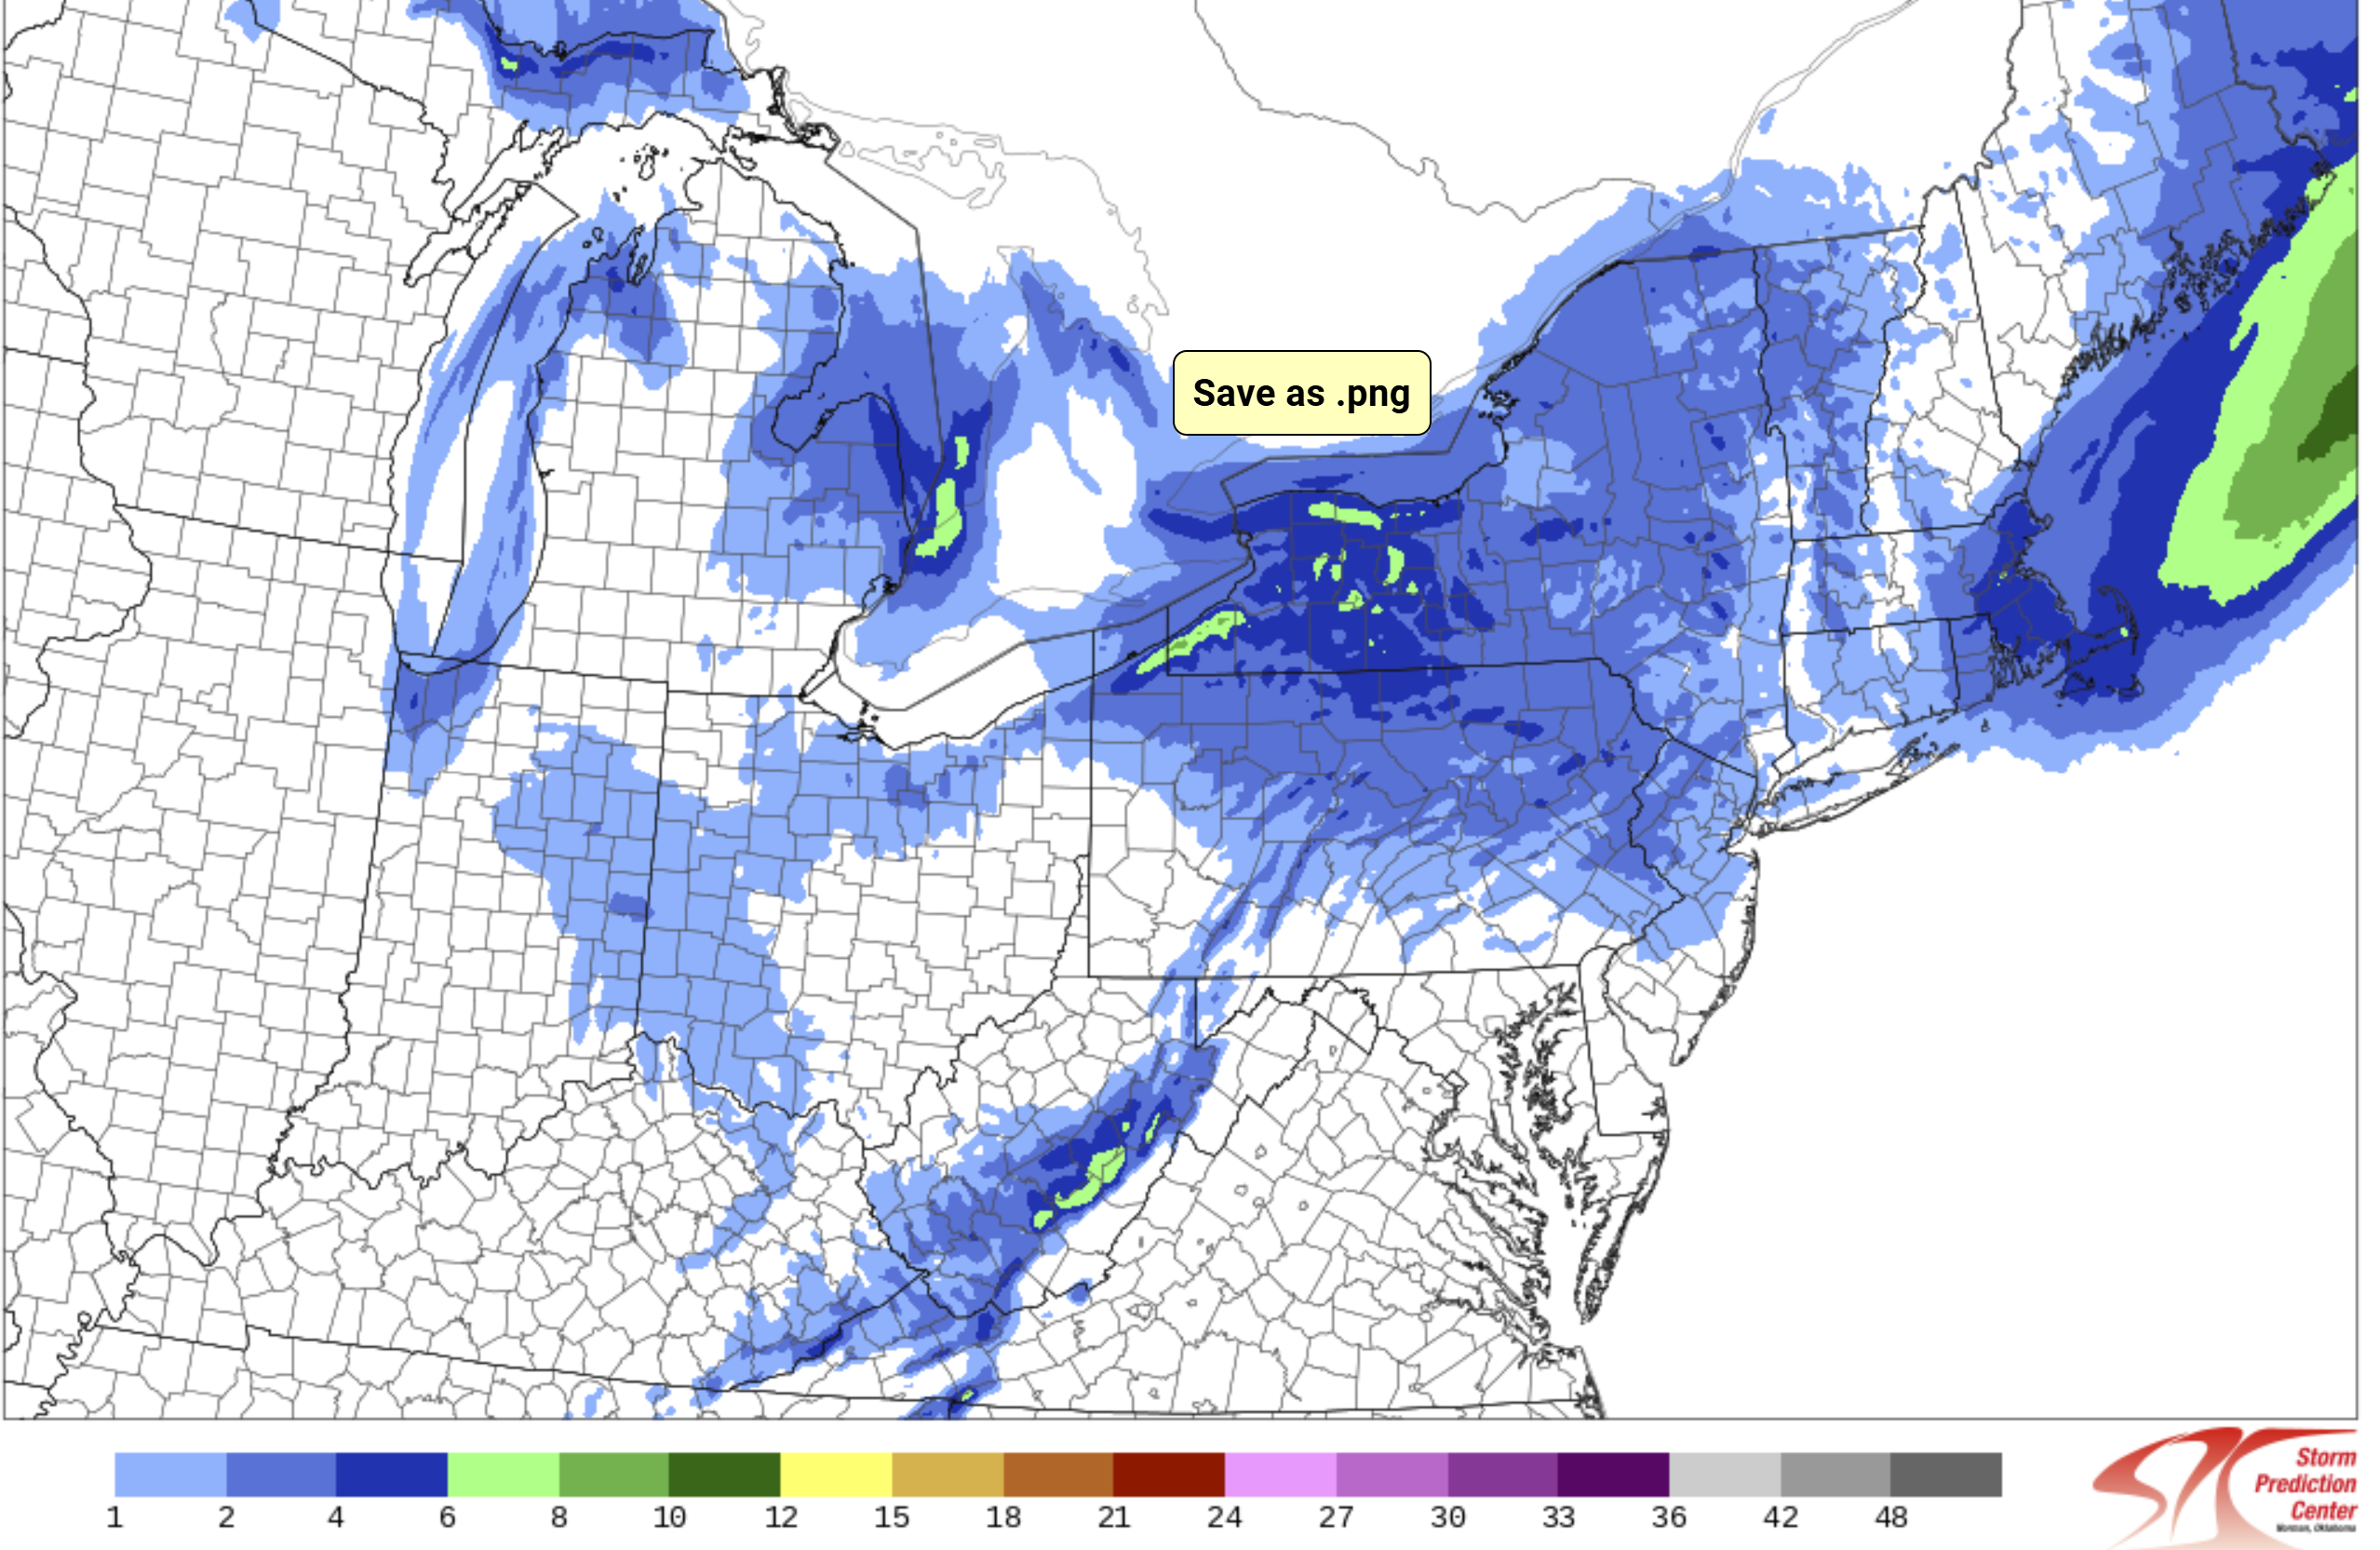
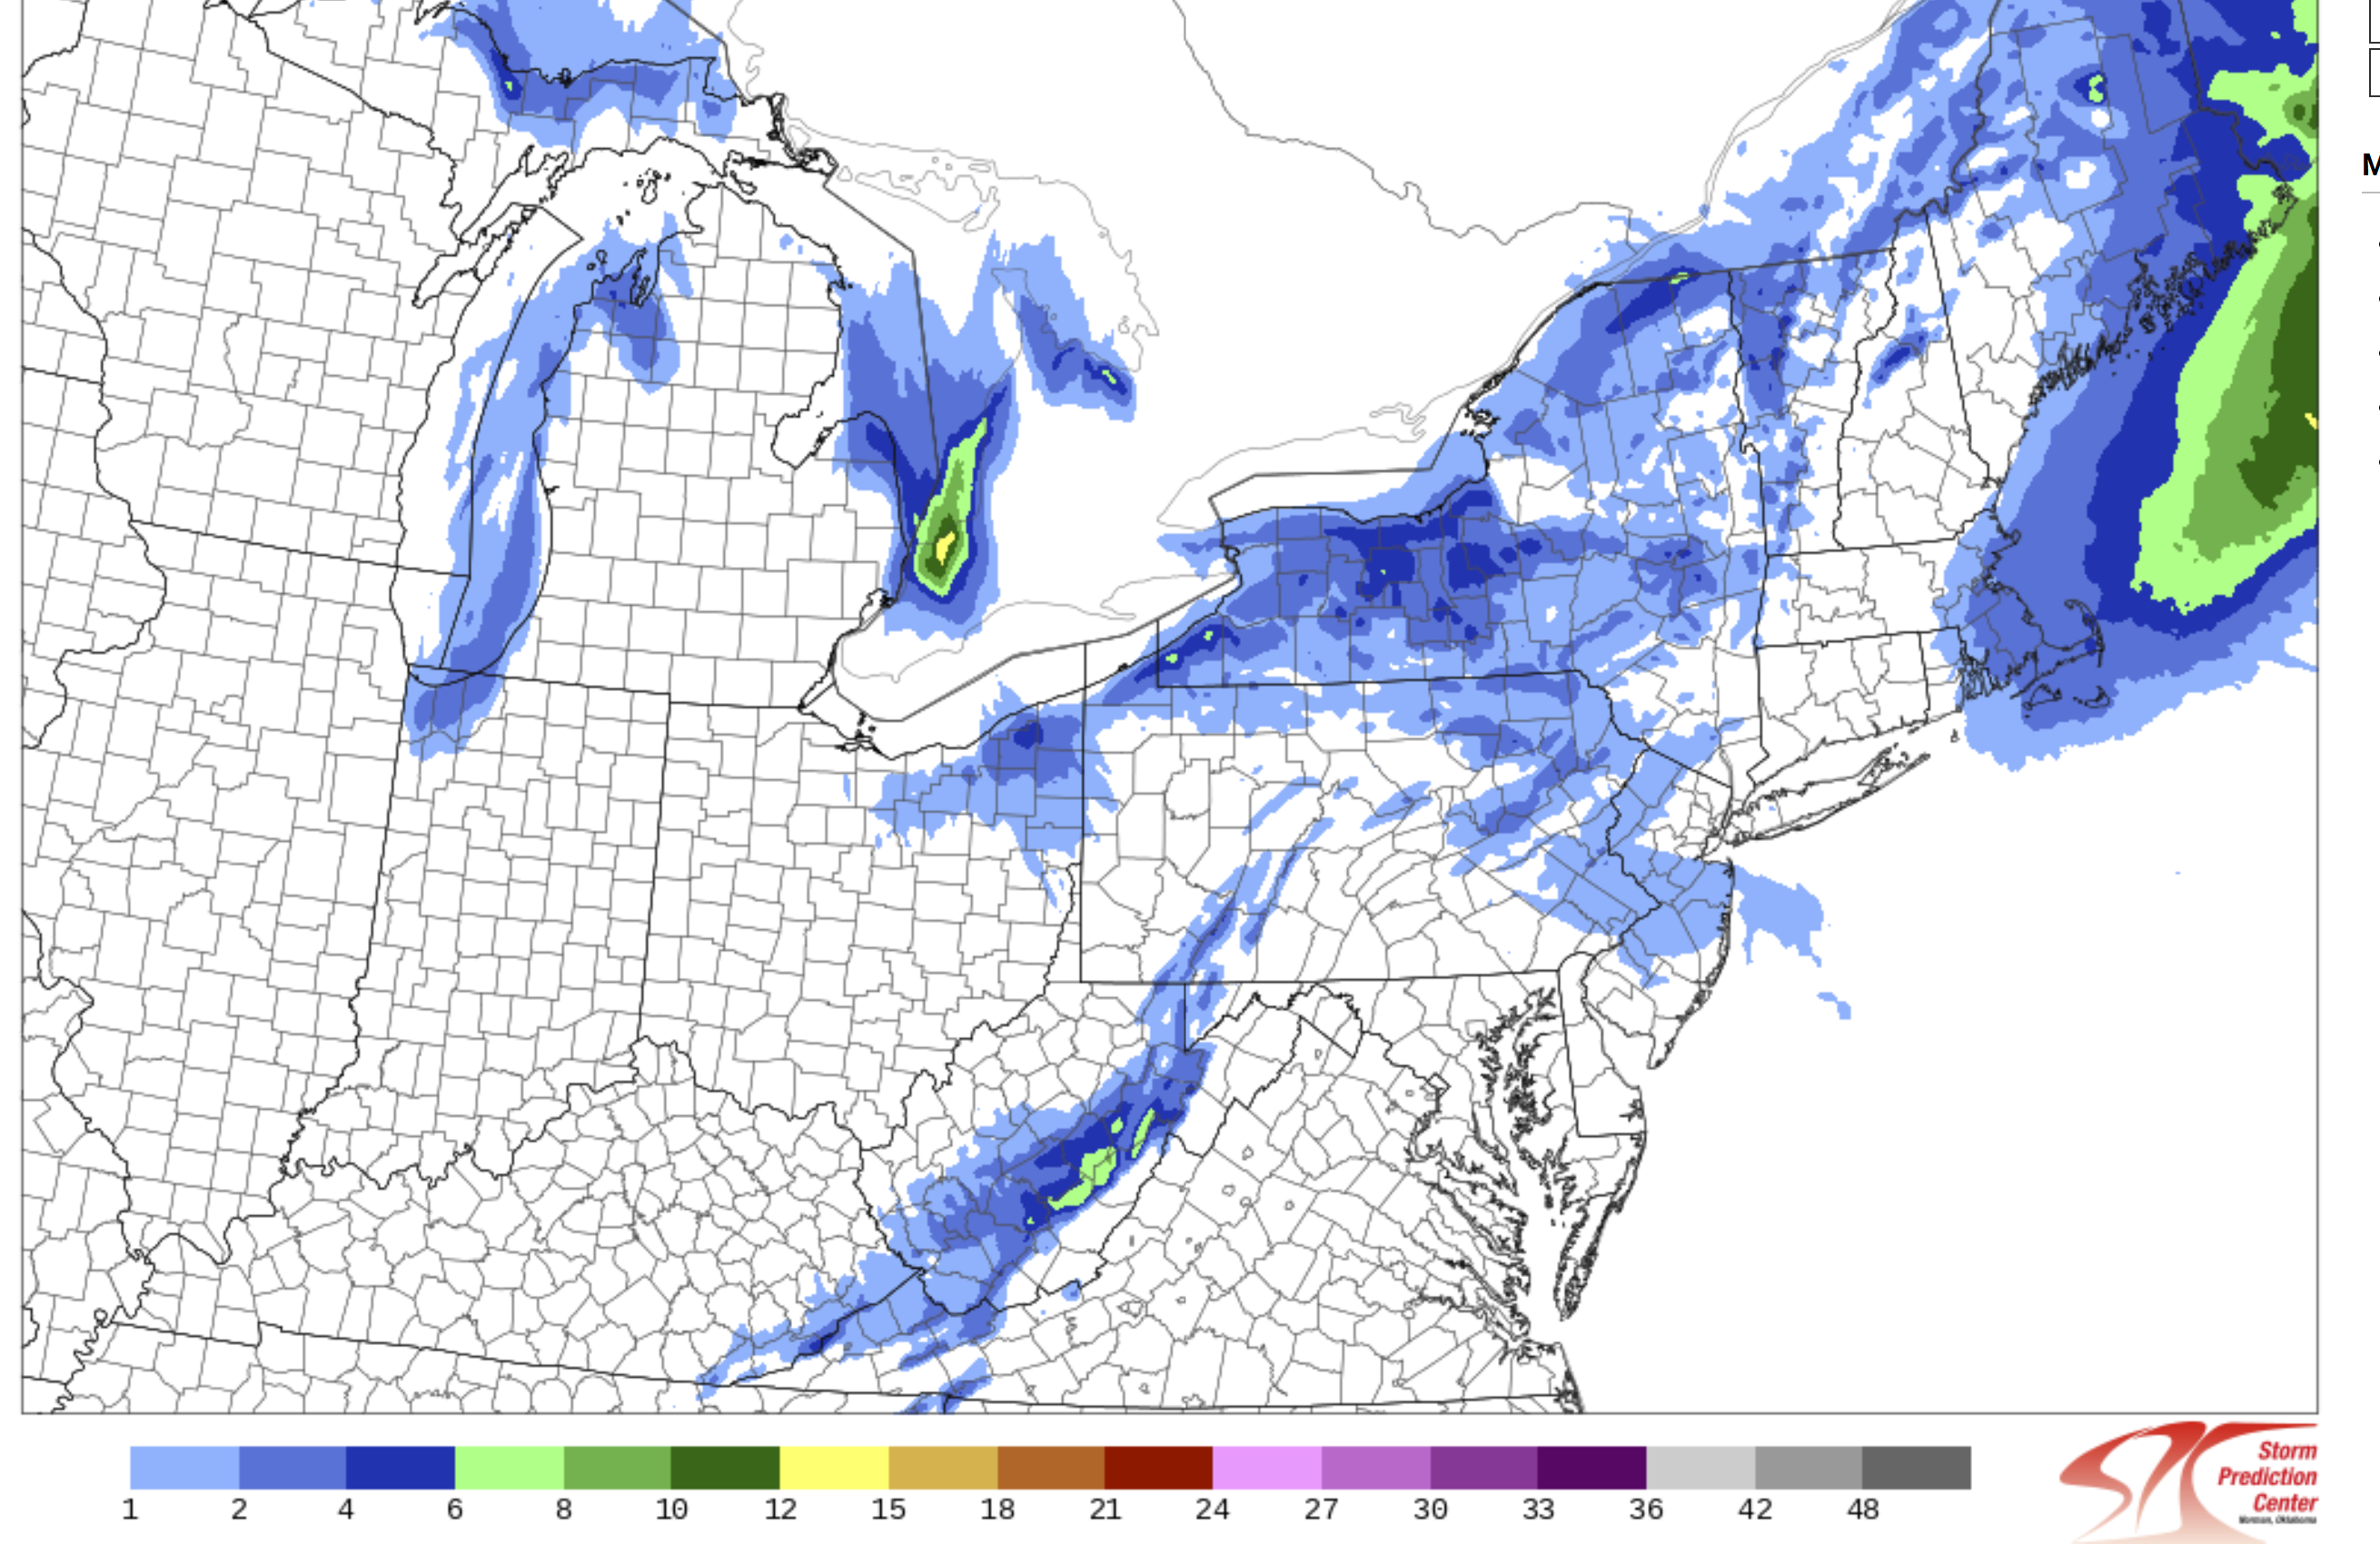
At this time, nobody should be relying too heavily on global (GFS, CMC, ECMWF) or regional (RGEM 10km, RAP 13km, NAM 12km, etc...) modeling systems. Stick with the mesos (HRRR 3km, WRF ARW, WRF ARW2, NAM 3km, etc...) and rely on data assimilation/nowcasting to follow any trends. That said, the 12z HREF (ensemble of mesos) increased mean snowfall for most areas in eastern MA and all of RI (compared to last night at 00z). It also expands accumulating snowfall westward.... More snow may be falling after this, but I'm too impatient to wait for the next panel... Follow it here: https://www.spc.noaa.gov/exper/href/?model=href&product=snowfall_024h_mean§or=ne&rd=20241220&rt=1200

-
December 2024 - Best look to an early December pattern in many a year!
MegaMike replied to FXWX's topic in New England
Good eye/question! The most recent version of the GFS has 127 hybrid sigma-pressure (terrain following at the surface and pressure aloft) vertical profile layers. In the plot you attached, the vendor is/appears to be plotting vertical profile data that has been interpolated to mandatory isobaric surfaces (1000, 925, 850, 700, 500, 400, 300, 250, 200, 150, and 100 mb). I'm assuming the same vendor uses a diagnostic categorical precipitation type/intensity field to plot precipitation type/intensity, which considers all 127 native vertical profile layers. So the Skew-T is only showing you a select few isobaric surfaces although the native model output possesses plenty more. -
I published a paper for the EPA regarding an air quality modeling system/data truncation, but I haven't collaborated with NCEP on atmospheric models/simulations. I do have experience with a bunch of different modeling systems though (in order): ADCIRC (storm surge), SWAN (wave height), WRF-ARW (atmospheric and air quality), UPP (atmospheric post-processor), CMAQ (air quality), ISAM (air quality partitioning), RAMS ( atmospheric), ICLAMS (legacy atmospheric model).
-
Just to be clear, the HREF and NBM are great tools (I specifically use them for precipitation forecasting), however, we can do better.
-
No problem, friend! I run simulations fairly regularly so I thought I'd chime in
-
The HREF is a Frankenstein model since it requires post-processing to obtain fields on a constant grid. It's not a standard modeling system like the HRRR, NAM, GFS, etc... NWP requires a lot of static/time varying fields to run atmospheric simulations: vegetation type, elevation height, ice coverage, etc... By interpolating data onto a grid (or even transforming a horizontal datum), you degrade model accuracy since this information is lost. The HREF exists simply because we created a high-resolution ensemble with what we currently have.
-
Consider the RRFS an ensemble consisting of multiple (9 members + 1 deterministic) high-resolution (3km) simulations on a constant grid (unlike the HREF and NBM). In other words, it's similar to the HREF, but without any post-processing... The HREF requires post-processing since its ensemble members have various domain configurations (which is a bit taboo). Based on < https://gsl.noaa.gov/focus-areas/unified_forecast_system/rrfs >, it's set to replace the NAMnest, HRRR, HiResWindows, and HREF modeling systems. Besides what I mentioned above, the lateral boundary conditions come from the GFS (control) and the GEFS (members). All share the same core (FV3). Currently, they're testing a bunch of different options to improve the initial conditions (data assimilation) of the RRFS. Overall, it sounds like it'll be a significant improvement over the HREF and NBM once the RRFS becomes operational (and well tested). Note: I can't find much on the RRFS' performance... Based on what I've seen so far, It performs better in terms of reflectivity detection < https://www.spc.noaa.gov/publications/vancil/rrfs-hwt.pdf >
-
You don't think our modeling systems are trusted? Most high-resolution modeling systems perform well within 12 hours (especially once a disturbance is properly assimilated). Additionally, most global models perform reasonably well within 4 days at the synoptic level. If you expect complete accuracy for moisture/precipitation fields, you (not you specifically, just in general) don't understand the limitations of NWP... Our initial conditions/data assimilation, boundary conditions, parameterizations, and truncations (dx,dy,dz increments) leads to significant error over time which aren't necessarily related to a modeling system itself. If we could perfectly initialize a modeling system, theoretically, there would be little to no errors post-initialization. You can't say the same thing about an AI model since it's likely trained on forcing variables such as temperature/moisture (at the surface and aloft) and is not simulated using governing equations and fundamental laws which the atmosphere adheres to. I wrote, 'AI can be used to improve the accuracy of NWP output that have a known, and predictable bias...' so if we used AI to correct singular fields prior to initialization and while a modeling system is running, sure... It will likely improve the accuracy of NWP. Bottom line; use AI to assist NWP or to correct fields with known biases. At this time, I don't trust atmospheric, AI models.
-
I'm not sure why anyone would use AI to forecast the weather. 1) AI is a glorified analog so it won't perform well for anomalous events. 2) We don't know what's incorporated in AI models so we can't correct for known biases. 3) Why use AI when we already have trusted NWP models? AI can be used to improve the accuracy of NWP output that have a known, and predictable bias though. For example, improving wind speed: < https://agupubs.onlinelibrary.wiley.com/doi/full/10.1029/2018JD029590 >.
-
The units are mm/hr, not inches/hr.
-
I totally agree with this. QPF has definitely improved over the past several decades. I just wish people would stop using mesos past 1pbl cycle. Thereafter, their reliability diminishes. It's the equivalent of using the GFS past day 7.
-
Snow continues to melt on contact in Albany. I'm not expecting much until after sunset. It's been like this since ~9am.
-
People trash a model if snowfall doesn't produce in their back yard. If someone says 'x' model sucks, I want them to cite an evaluation (post-hoc or operational) of meteorological forcing fields related to heat and moisture both at the surface and aloft. Those fields contributes significantly to the accuracy of NWP... Not snowfall at one location (which is typically calculated from a private website, excluding a couple NWP models). If someone were to run an evaluation of this event, you'll likely find that temperature performed well (sfc + aloft), moisture performed okay (Td or specific humidity at the sfc and aloft), and wind speed performed okay (directional and magnitudinal at the sfc and aloft - worse as you approach the surface). All NWP models struggle with QPF (for a number of reasons) so it's not solely used to determine a model's overall performance. Through my experience, it usually performs reasonable as a bulk statistic. IMO, ensembles should always be used for QPF forecasting. Diagnostic models should be used to determine trends.
-
Although the rates haven't been great, we've been getting fairly large cat paws (looks like conglomerates of multiple dendrites) out west near Albany, NY. Unfortunately, not much accumulation since ~9am. Treated surfaces appear wet, not white ATM.
-
I'd be surprised if they didn't. Plenty of time to go for them to accumulate 5''.
-
The most recent public information statement from KBTV, KBOX, KGYX, and KALY. Some impressive totals already. ------------------------------------------------------------ ***KBOX*** Location Amount Time/Date Provider ...Connecticut... ...Hartford County... 7 WNW Granby 11.3 in 0815 AM 03/14 Windsor Locks 4.4 in 0814 AM 03/14 ASOS ...Massachusetts... ...Franklin County... Hawley 24.0 in 0802 AM 03/14 CO-OP Observer Greenfield 5.8 in 0725 AM 03/14 CO-OP Observer 1 W Orange AP 3.0 in 0858 AM 03/14 ...Hampden County... Blandford 16.0 in 0845 AM 03/14 Granville 14.5 in 0845 AM 03/14 2 NW Montgomery 8.0 in 0705 AM 03/14 Southwick 6.0 in 0845 AM 03/14 Emergency Mngr 2 SW Chicopee 4.5 in 0711 AM 03/14 ...Hampshire County... 1 ESE Plainfield 24.0 in 0859 AM 03/14 1 ESE Plainfield 20.0 in 0741 AM 03/14 ...Middlesex County... Ashby 16.5 in 0905 AM 03/14 1 WNW Pepperell 4.0 in 0704 AM 03/14 2 SSE Dunstable 3.5 in 0832 AM 03/14 ...Worcester County... Templeton 14.0 in 0910 AM 03/14 2 NNW Sterling 13.3 in 0901 AM 03/14 1 WNW Holden 13.0 in 0838 AM 03/14 Ashburnham 12.7 in 0745 AM 03/14 CO-OP Observer 2 NNW Sterling 11.5 in 0729 AM 03/14 1 NE Lunenburg 10.1 in 0821 AM 03/14 Lunenburg 10.0 in 0905 AM 03/14 1 N Rutland 8.0 in 0717 AM 03/14 Worcester AP 4.5 in 0815 AM 03/14 ASOS 1 NNW Lancaster 4.5 in 0755 AM 03/14 ------------------------------------------------------------ ***KGYX*** Location Amount Time/Date Provider ...Maine... ...Franklin County... Farmington 4.8 NNW T in 0900 AM 03/13 COCORAHS ...New Hampshire... ...Belknap County... 2 WSW Meredith 2.0 in 0213 AM 03/14 Trained Spotter ...Carroll County... 1 N Madison 5.5 in 0619 AM 03/14 Trained Spotter ...Cheshire County... Walpole 5.5 in 0618 AM 03/14 Public 2 SW Keene 2.0 in 0707 AM 03/14 Trained Spotter ...Coos County... 4 NNW Whitefield 2.6 in 0626 AM 03/14 Trained Spotter ...Hillsborough County... 2 WNW Windsor 11.0 in 0641 AM 03/14 Trained Spotter 2 N Francestown 10.0 in 0728 AM 03/14 Trained Spotter 2 N New Boston 8.0 in 0734 AM 03/14 Trained Spotter 2 N Brookline 6.2 in 0711 AM 03/14 Public 3 N Hillsborough 6.0 in 0107 AM 03/14 Trained Spotter 2 S New Boston 5.6 in 0729 AM 03/14 Trained Spotter ...Merrimack County... 3 E Tilton 2.5 in 0745 AM 03/14 Public Concord Municipal Airport 0.7 in 0717 AM 03/14 ASOS ...Rockingham County... 3 ENE Derry 5.0 in 0720 AM 03/14 Trained Spotter Nottingham 1.2 S T in 0830 AM 03/13 COCORAHS ...Strafford County... 2 ENE Northwood 2.0 in 0616 AM 03/14 Trained Spotter ------------------------------------------------------------ ***KALY*** LOCATION TOTAL TIME/DATE COMMENTS SNOWFALL MEASURED (inches) CONNECTICUT ...Litchfield County... Lakeville 4.0 730 AM 3/14 Amateur Radio MASSACHUSETTS ...Berkshire County... Windsor 25.0 857 AM 3/14 Twitter 3 S Sandisfield 15.6 902 AM 3/14 Trained Spotter 2 ENE Pittsfield 11.4 800 AM 3/14 Amateur Radio Cheshire 7.5 800 AM 3/14 Amateur Radio Lenox 7.0 630 AM 3/14 Social Media Adams 6.5 800 AM 3/14 Amateur Radio Lenoxdale 6.5 800 AM 3/14 Amateur Radio Williamstown 3.5 728 AM 3/14 Twitter NEW YORK ...Albany County... CLARKSVILLE 10.0 800 AM 3/14 Elevation 1290 ft 1 NE Guilderland 8.0 700 AM 3/14 Amateur Radio Albany Intl AP 6.0 800 AM 3/14 ASOS Albany 5.8 905 AM 3/14 Meteorologist Boght Corners 5.8 755 AM 3/14 NWS Employee Colonie 5.5 735 AM 3/14 Trained Spotter New Scotland 5.0 640 AM 3/14 Amateur Radio ...Columbia County... Austerlitz 10.0 842 AM 3/14 WeatherNet6 Taghkanic 7.0 831 AM 3/14 WeatherNet6 Ancramdale 4.0 649 AM 3/14 WeatherNet6 Germantown 4.0 812 AM 3/14 WeatherNet6 ...Dutchess County... Rhinebeck 6.0 733 AM 3/14 Facebook Red Hook 4.0 703 AM 3/14 WeatherNet6 Poughquag 4.0 745 AM 3/14 Public ...Greene County... 5 SW Palenville 18.0 717 AM 3/14 Facebook 3 SSW Tannersville 16.0 630 AM 3/14 Facebook Greenville Center 11.0 901 AM 3/14 WeatherNet6 West Kill 10.0 822 AM 3/14 WeatherNet6 Cairo 6.0 632 AM 3/14 WeatherNet6 Halcott Center 6.0 826 AM 3/14 WeatherNet6 Catskill 4.0 725 AM 3/14 WeatherNet6 ...Hamilton County... Wells 10.0 700 AM 3/14 Amateur Radio 7 ENE Piseco 7.6 700 AM 3/14 Amateur Radio Piseco 7.0 816 AM 3/14 WeatherNet6 Long Lake 3.5 700 AM 3/14 Amateur Radio Inlet 3.0 705 AM 3/14 Trained Spotter ...Herkimer County... Ohio 6.4 855 AM 3/14 Amateur Radio 3 E Middleville 5.0 703 AM 3/14 Trained Spotter Dolgeville 4.5 835 AM 3/14 Amateur Radio Herkimer 4.0 850 AM 3/14 Amateur Radio Ilion 4.0 700 AM 3/14 Amateur Radio ...Montgomery County... Hessville 8.3 857 AM 3/14 WeatherNet6 Glen 8.0 801 AM 3/14 WeatherNet6 Amsterdam 6.8 759 AM 3/14 WeatherNet6 Canajoharie 6.0 830 AM 3/14 Facebook 3 NNE Sprakers 3.5 740 AM 3/14 Amateur Radio Fonda 3.1 723 AM 3/14 WeatherNet6 ...Rensselaer County... 1 NW Wyantskill 12.0 815 AM 3/14 Amateur Radio Brunswick 11.5 855 AM 3/14 Amateur Radio 1 N Sycaway 9.1 800 AM 3/14 0.96 inches liquid 1 N North Greenbush 8.5 726 AM 3/14 Trained Spotter Petersburg 8.0 826 AM 3/14 WeatherNet6 Berlin 7.5 703 AM 3/14 Facebook East Greenbush 7.5 630 AM 3/14 Trained Spotter Speigletown 4.0 721 AM 3/14 WeatherNet6 Hoosick Falls 3.2 806 AM 3/14 WeatherNet6 ...Saratoga County... Providence 12.5 813 AM 3/14 Elevation 1300 ft Clifton Park 6.5 710 AM 3/14 WeatherNet6 Galway 6.2 754 AM 3/14 WeatherNet6 Ballston Spa 4.5 632 AM 3/14 WeatherNet6 Ballston Lake 4.5 728 AM 3/14 WeatherNet6 Saratoga Springs 4.0 813 AM 3/14 WeatherNet6 ...Schenectady County... Delanson 14.0 919 AM 3/14 WeatherNet6 Schenectady 6.0 650 AM 3/14 WeatherNet6 1 SSW Aqueduct 6.0 720 AM 3/14 NWS Employee 1 NNE Hawthorne Hill 6.0 830 AM 3/14 NWS Employee Niskayuna 5.5 820 AM 3/14 Amateur Radio Duanesburg 5.0 728 AM 3/14 WeatherNet6 Pattersonville 5.0 732 AM 3/14 Meteorologist ...Schoharie County... Jefferson 13.0 800 AM 3/14 Elevation 1900 ft Middleburgh 8.2 630 AM 3/14 WeatherNet6 Richmondville 8.0 751 AM 3/14 WeatherNet6 ...Ulster County... Plattekill 6.1 730 AM 3/14 Trained Spotter Rosendale 3.5 815 AM 3/14 Public ...Warren County... 3 WSW North Creek 10.5 804 AM 3/14 Twitter Lake Luzerne 6.2 636 AM 3/14 WeatherNet6 Queensbury 5.5 841 AM 3/14 WeatherNet6 ...Washington County... Hartford 11.5 910 AM 3/14 Trained Spotter Hebron 6.0 813 AM 3/14 WeatherNet6 Granville 4.0 713 AM 3/14 WeatherNet6 Whitehall 1.0 731 AM 3/14 WeatherNet6 VERMONT ...Bennington County... Pownal 11.0 741 AM 3/14 Facebook Landgrove 9.0 710 AM 3/14 WeatherNet6 3 NNE Arlington 5.5 732 AM 3/14 Trained Spotter West Arlington 2.0 628 AM 3/14 WeatherNet6 ...Windham County... Windham 21.4 900 AM 3/14 CoCoRaHS Brattleboro 8.0 730 AM 3/14 Facebook **********************24 HOUR SNOWFALL********************** LOCATION 24 HOUR TIME/DATE COMMENTS SNOWFALL MEASURED (inches) CONNECTICUT ...Litchfield County... 2 WNW Warren 4.0 700 AM 3/14 CoCoRaHS 3 WNW New Milford 1.0 700 AM 3/14 CoCoRaHS 2 SSW Woodbury Cente 0.5 700 AM 3/14 CoCoRaHS 5 SSW New Milford 0.5 730 AM 3/14 CoCoRaHS MASSACHUSETTS ...Berkshire County... 1 NNW Cheshire 7.2 700 AM 3/14 CoCoRaHS 2 NW Sheffield 2.8 700 AM 3/14 CoCoRaHS NEW YORK ...Albany County... 3 SSW Altamont 14.8 808 AM 3/14 CoCoRaHS 4 NW Altamont 10.5 700 AM 3/14 CoCoRaHS 3 SW Glenmont 5.5 700 AM 3/14 CoCoRaHS 1 SW Albany 5.5 700 AM 3/14 CoCoRaHS NWS Albany 4.1 800 AM 3/14 CoCoRaHS ...Columbia County... 1 SW Chatham 8.5 700 AM 3/14 CoCoRaHS 3 N Valatie 7.2 700 AM 3/14 CoCoRaHS N Ancramdale 6.5 700 AM 3/14 CoCoRaHS 1 S Valatie 5.5 700 AM 3/14 CoCoRaHS 1 E Germantown 3.7 700 AM 3/14 CoCoRaHS ...Dutchess County... 3 NE Lagrangeville 5.8 700 AM 3/14 CoCoRaHS 3 SE Millbrook 5.6 700 AM 3/14 CoCoRaHS 1 NNE Red Hook 4.0 700 AM 3/14 CoCoRaHS 3 N Rhinebeck 3.6 700 AM 3/14 CoCoRaHS ...Fulton County... Gloversville 7nw 8.1 700 AM 3/14 Co-Op Observer 1 NE Northville 7.0 645 AM 3/14 CoCoRaHS 1 N Northville 5.2 635 AM 3/14 CoCoRaHS ...Greene County... 1 E Greenville 11.0 700 AM 3/14 CoCoRaHS 3 E Freehold 9.5 700 AM 3/14 CoCoRaHS 2 N Lexington 9.0 700 AM 3/14 CoCoRaHS WNW Athens 2.6 730 AM 3/14 CoCoRaHS ...Hamilton County... Indian Lake 9.3 750 AM 3/14 Co-Op Observer 10 SSW Speculator 8.5 700 AM 3/14 CoCoRaHS 2 WSW Lake Pleasant 7.6 655 AM 3/14 CoCoRaHS 1 N Long Lake 4.4 700 AM 3/14 CoCoRaHS ...Herkimer County... 3 NE Schuyler 4.5 745 AM 3/14 CoCoRaHS ...Montgomery County... 2 WSW Hessville 8.3 800 AM 3/14 CoCoRaHS 1 NNW Amsterdam 6.0 704 AM 3/14 CoCoRaHS SE Fort Plain 2.3 700 AM 3/14 CoCoRaHS ...Rensselaer County... 7 NE Troy 10.4 700 AM 3/14 CoCoRaHS 1 E Troy 10.0 700 AM 3/14 CoCoRaHS 2 NNE Troy 9.1 800 AM 3/14 CoCoRaHS 3 SW Stephentown 5.0 700 AM 3/14 CoCoRaHS ...Saratoga County... 4 WNW Rock City Fall 12.5 740 AM 3/14 CoCoRaHS 3 ESE Ballston Spa 8.0 845 AM 3/14 CoCoRaHS 2 W Greenfield Cente 7.0 800 AM 3/14 CoCoRaHS ...Schenectady County... 1 NE Niskayuna 5.9 700 AM 3/14 CoCoRaHS 3 SSE Niskayuna 5.0 700 AM 3/14 CoCoRaHS 2 ENE Schenectady 4.5 700 AM 3/14 CoCoRaHS 1 NW Scotia 3.5 700 AM 3/14 CoCoRaHS ...Ulster County... 4 E Wallkill 4.8 700 AM 3/14 CoCoRaHS 4 N Kerhonkson 4.3 700 AM 3/14 CoCoRaHS SW Highland 4.1 700 AM 3/14 CoCoRaHS 2 S Hurley 3.9 700 AM 3/14 CoCoRaHS 2 WNW Rosendale Vill 3.8 815 AM 3/14 CoCoRaHS 1 ENE Woodstock 1.5 700 AM 3/14 CoCoRaHS 5 NW Saugerties 0.1 900 AM 3/14 CoCoRaHS ...Warren County... 5 ESE Lake George 6.0 700 AM 3/14 CoCoRaHS 1 N Lake George 3.9 700 AM 3/14 CoCoRaHS VERMONT ...Bennington County... Peru 11.6 700 AM 3/14 Co-Op Observer 3 ENE Manchester 10.5 730 AM 3/14 CoCoRaHS W South Shaftsbury 2.5 720 AM 3/14 CoCoRaHS ...Windham County... 1 S Brattleboro 6.4 700 AM 3/14 CoCoRaHS 1 NNE Rockingham 3.9 700 AM 3/14 CoCoRaHS ------------------------------------------------------------ ***KBTV*** NEW YORK ...Clinton County... 4 E Dannemora 5.5 907 AM 3/14 1,200' elevation Chazy 1.2 654 AM 3/14 Mesonet ...Essex County... 1 E Newcomb 6.7 650 AM 3/14 Mesonet 2 W Wilmington 3.9 650 AM 3/14 Mesonet 3 S Crown Point 2.8 654 AM 3/14 Mesonet 4 NNE North Hudson 2.0 651 AM 3/14 Mesonet Moriah 2.0 710 AM 3/14 Public ...Franklin County... Lake Clear 6.0 815 AM 3/14 Public Saranac Lake 4.8 650 AM 3/14 Public 1 S Gabriels 1.2 648 AM 3/14 Mesonet ...St. Lawrence County... 9 NE Hammond 1.6 647 AM 3/14 Mesonet VERMONT ...Caledonia County... Danville 7.0 828 AM 3/14 Public Kirby 7.0 800 AM 3/14 Public West Danville 7.0 900 AM 3/14 1,600' elevation Walden 7.0 813 AM 3/14 1,640' elevation St. Johnsbury 6.0 901 AM 3/14 Public West Burke 4.0 738 AM 3/14 Public ...Chittenden County... 2 NW Westford 2.9 602 AM 3/14 NWS Employee Underhill 0.8 845 AM 3/14 1,100' elevation ...Essex County... 4 WNW Maidstone 7.5 841 AM 3/14 Public ...Franklin County... St. Albans 2.0 815 AM 3/14 Public ...Lamoille County... Morrisville 3.0 733 AM 3/14 Public ...Orange County... Randolph Center 11.5 800 AM 3/14 1,500' elevation Chelsea 9.0 730 AM 3/14 1,400' elevation East Randolph 8.0 914 AM 3/14 1300' elevation West Newbury 5.8 630 AM 3/14 Public Williamstown 5.0 700 AM 3/14 Public ...Orleans County... Albany 3.8 652 AM 3/14 Public ...Rutland County... Shrewsbury 11.0 659 AM 3/14 Public Mt. Holly 10.0 630 AM 3/14 Public ...Washington County... Marshfield 8.0 918 AM 3/14 1,600' elevation Fayston 7.5 735 AM 3/14 1,450' elevation Cabot 4.0 715 AM 3/14 1900 ft elev Barre 4.0 752 AM 3/14 Public Montpelier 4.0 900 AM 3/14 Public 2 NNE Waterbury Cent 3.0 543 AM 3/14 Trained Spotter ...Windsor County... 3 S Ludlow 16.0 900 AM 3/14 1.32 inch liquid Andover 14.0 715 AM 3/14 2000 ft elev 1 SE West Norwich 5.1 548 AM 3/14 Public Hartland 2.0 927 AM 3/14 Public
-
I never said they were great as operational forecast models. I seldom use them, if at all. At this range, I'd prefer the NBM, HREF, and HRRR over almost anything else. My point was, if you're going to disregard the WRF-ARW/2 because they're WRF models, you may as well disregard the WRF-NMM model (NAM), as well. Regardless, WRF-ARW is fantastic for post-hoc analysis using reanalysis data.
-
Let's be nice to the big, beautiful WRF models (which do have a cold bias). The NAM is WRF w/a Non-hydrostatic Mesoscale Model dynamic core (WRF-NMM). https://www.ncei.noaa.gov/products/weather-climate-models/north-american-mesoscale
-
I've mentioned this in the past, but 1) snow depth fields from NWP include gauge losses due to melting/compaction/sublimation/etc... and 2) the ratio algorithms are underestimated (from the land surface models I'm aware of, they only incorporate near surface temperature and wind speed). They basically assume immediate compaction. I agreed with another met on here that this product is helpful along the boundary b/n rain and snow. Further inland, it's best to use SWE (use 10:1 ratios if you must).