MegaMike
-
Posts
576 -
Joined
-
Last visited
Content Type
Profiles
Blogs
Forums
American Weather
Media Demo
Store
Gallery
Everything posted by MegaMike
-
It uses several different algorithms + a bunch of different modeling systems < https://vlab.noaa.gov/documents/6609493/6665561/NBM_v4.2_Eval_SlideDeck.pdf >. Definitely an improvement over the traditional, 10:1 methodology.
-
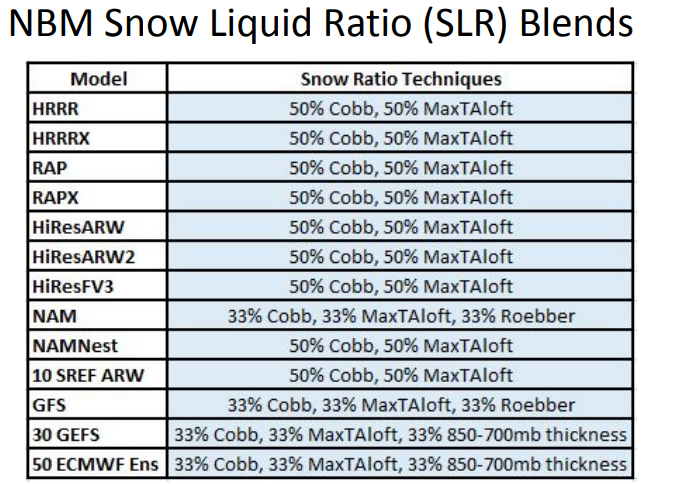
It's a great website and there's a lot provided! It's free and the HREF (and others) is available too. For the weenies: https://sites.gsl.noaa.gov/desi/?x4dLocations=%5B%22City%22%5D&chart=x4d&lat=40&lon=-1[…]1dSingleField=t2&x1dGraphStyle=pdf&x2dGraphStyle=boxwhisker For now, I'd stick with BUFKIT although the NBM does incorporate the Cobb snowfall algorithm. For S&Gs, the 13z NBM has ratios ~12-20:1 throughout the event. It's a bit early for this (and snowfall maps), but man... I miss following potential snow events.
-
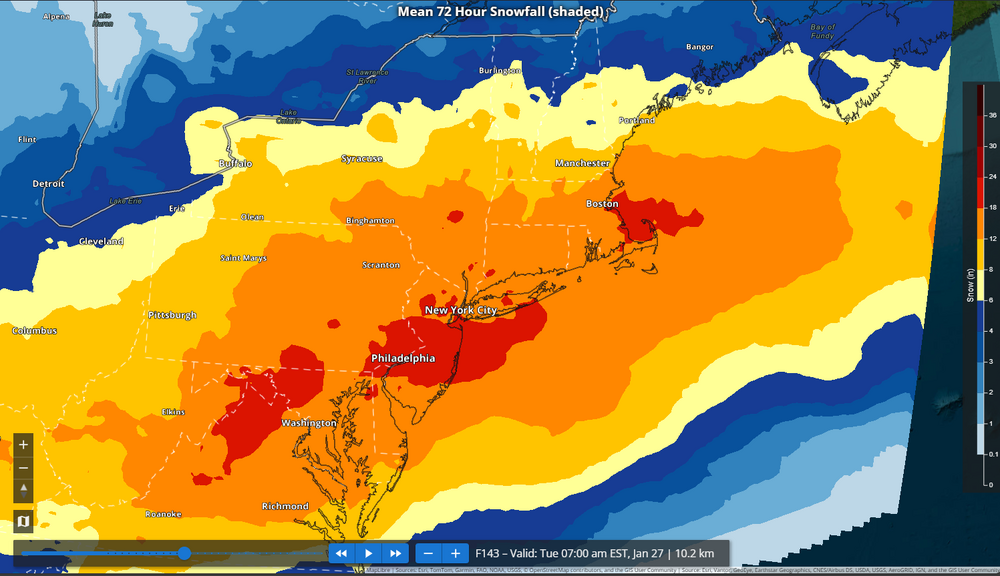
13z NBM will appease most of the forum... For a mean at D4.5, I think this is impressive.
-

January 2026 regional war/obs/disco thread
MegaMike replied to Baroclinic Zone's topic in New England
12z diagnostic mslp, prate, type, etc... and 12z ensemble spread at forecast hour 132:
-
January 2026 regional war/obs/disco thread
MegaMike replied to Baroclinic Zone's topic in New England
I can't find anything operational for the Clankers (AIGFS, etc...), but here's RMSE (x) versus isobaric surface (y) for some of the major diagnostic modeling systems at forecast hour 120 (day 5), for the northern hemisphere, and for the past 31 days: The smaller the RMSE value, the better the results... So, if I had to rank them as an aggregate of all isobaric surfaces, it'd go; 1) ECMWF 2) UKMET~=CMC [pretty close] 3) GFS 4) JMA 5) FNMOC 6) CFS. Let's remember weenies, this is for one forecast hour, for the northern hemisphere, and for the past 31 days. Accuracy changes when you adjust any of those parameters. That said, dabble with that if you'd like > https://www.emc.ncep.noaa.gov/users/verification/global/gfs/prod/atmos/grid2obs/hgt/ - it takes a while for the website to load on Chrome, unfortunately. -
First Legit Storm Potential of the Season Upon Us
MegaMike replied to 40/70 Benchmark's topic in New England
12z GEFS consolidated a bit and is east of its 06z position. For now, I'm still ignoring AI.
-
First Legit Storm Potential of the Season Upon Us
MegaMike replied to 40/70 Benchmark's topic in New England
Definitely! I'll never live this one down if AI outperforms NWP.
-
First Legit Storm Potential of the Season Upon Us
MegaMike replied to 40/70 Benchmark's topic in New England
I never imagined this forum diverge into a discussion about AI Admittedly, your last sentence is difficult to accept. I'm sure most of us feel the same too. To add to the discussion, here's the 12z ensemble spread and diagnostic prate/type at 90hr... Still uncertainty amongst the ensembles/models so we're not entirely dead yet. If I had to stratify it as is (for measurable precipitation), I'd call it the AIs+ICON+CMC vs. GFS+ECMWF+UKMET.
-
First Legit Storm Potential of the Season Upon Us
MegaMike replied to 40/70 Benchmark's topic in New England
That's a fair point. I didn't want to get technical, but I'll restate it as, "the ceiling for AI should be that of current NWP + bias correction." I've mentioned in the past that AI should be used to bias-correct ic/bcs, so I don't disagree. On top of bias-correction, I imagine the analysis datasets already incorporate 'nudging.' This is only done for the ic/bcs prior to initialization though, so you'd still need to do gridded bias correction post-simulation. -
First Legit Storm Potential of the Season Upon Us
MegaMike replied to 40/70 Benchmark's topic in New England
Thanks, dude. I always think of Ian Malcolm's quote from Jurassic Park when AI models are mentioned: Data scientists are so "preoccupied with whether or not they could, that they didn't stop to think if they should." I think they're more useful for climatological/ensemble purposes. Its resolution is too course for nowcasting, and whether people like it or not, the best real-time product we have is the HRRR (only model to update every hour not considering the RRFS). Users just need to understand its limitations... Within a few hours = good ||| outside a few hours = meh ||| beyond a PBL cycle = ignore... I've been thinking; theoretically, the ceiling for AI should be that of current NWP... I don't think it's possible to outperform the dataset its trained on, so to improve AI, you must improve NWP <OR> increase the size of your training dataset. As a result, NWP will never be phased out. :fist bump: If I remember correctly, the evaluation was conducted wrt an analysis dataset (not in-situ locations). To me, that implies they're evaluating its efficacy (can it 'hang' with a traditional modeling system?) and not its accuracy. I did this too when I compressed assimilation data and reran CMAQ simulations when I worked with the EPA. I won't trust AI until evaluations are conducted at remote sensing stations. Analysis datasets aren't entirely accurate. -
First Legit Storm Potential of the Season Upon Us
MegaMike replied to 40/70 Benchmark's topic in New England
In my opinion, there's too much trust in AI for weather prediction. I've mentioned this a few times, but It was made operational recently There's nothing wrong with current NWP excluding (a) it takes longer to run and (b) it requires a lot of resources vs. AI There is no significant evidence the EC-AIFS/AIGFS outperforms NWP for sensible weather at the surface during inclement weather (please provide a source if I'm wrong). For AI, nobody knows how forcing(x,y,z,t) is calculated (doesn't rely on traditional methods). ie... what is 1+1? Human = 1 + 1 == 2 ||| AI = :performs multi-dimensional math on 'n' fields: == 2. Do you trust that? Given the initial state of the atmosphere is captured flawlessly, there's no guarantee AI will perform well. AI is great when there is no known relationship/correlation between a predictor and many predictands. Weather is relatively predictable so I don't find AI useful unless the fields are bias-corrected then ingested back into data assimilation grids. If the AIs outperform NWP for this, *** and it evaluates well ***, I'll take it a little more seriously. Who knows... Maybe truncating/rendering certain fields may increase its accuracy for this one event <AND/OR> data assimilation is poor at the current location(s) where the disturbance(s) is/are, and AI could use historic events to predict this event with some level of accuracy. -
First Legit Storm Potential of the Season Upon Us
MegaMike replied to 40/70 Benchmark's topic in New England
Good observation. For the ECMWF/ECMWF-AI, the operational ECMWF has a horizontal resolution of ~9km. In comparison, the ECMWF-AI is trained on the ERA5 reanalysis dataset which has a resolution of ~31km (its operational product must be run on the same grid specifications). On top of resolution discrepancies, to my understanding, the ECMWF-AI uses its own, statistical relationship (AI and not traditional microphysical/physical schemes) to determine precipitation too. That likely compounds the resolution issue you mentioned, as well. I'm heavily leaning away from AI models for this event (and likely, for all events until it proves its accuracy for sensible weather). -
First Legit Storm Potential of the Season Upon Us
MegaMike replied to 40/70 Benchmark's topic in New England
Before 12z gets roll'n, here's what the 06z ensembles depict for QPF-mean and SFC MSLP: Will this trend into something like yesterday's 12z GFS? Probably not (as other mets mentioned), but at least the 0.5" QPF-mean contour is nearby (~Cape Cod; trying to be optimistic for the pessimistic weenies) for each ensemble. Given there's still a decent amount of spread at 96hrs, a lighter/moderate event may still be possible for eastern areas. I would like to see the EPS tick west at 12z, otherwise, I'd lower expectations if you haven't already.
-
First Winter Storm to kickoff 2025-26 Winter season
MegaMike replied to Baroclinic Zone's topic in New England
I completely agree. It was recently made operational (Feb. 2025) and its primary purpose (imo at the current moment) is to provide an efficient (few resources and fast to simulate), medium/long range ensemble... I consider it a less accurate version of the CFS, honestly. They're years, if not decades, away from making the AIFS comparable to any traditional NWP modeling system. I'm not even fully sold on that being a possibility either... I'll take it seriously when the AIFS outperforms the IFS at the surface and not 500-50mb Vendors will provide any modeling system to stand out, unfortunately... At this range, I'd primarily consider the ECMWF, GFS, CMC, ICON, and UKMET (with more emphasis on their ensembles). Maybe look at trends of the AIFS for S&Gs. -
I respect the effort. It takes a long time doing an analysis on one storm. You did it for 200+ events and manually conducted/plotted an interpolation. That's wild.
-
November 2025 general discussions and probable topic derailings ...
MegaMike replied to Typhoon Tip's topic in New England
Pretty cool looking! Consensus is, that's the exhaust plume from the European Space Agency's Ariane 6 rocket (launched at Kourou, French Guiana). -
Absolutely not. Maybe it performed well for this one event, but that doesn't mean it's better than traditional NWP. You really need to conduct a thorough evaluation at the surface and aloft (for forcing variables) to make such conclusions. As an example, it's possible something can be right for the wrong reason. You wouldn't know unless you evaluated it... So, if AI did well with forcing, wrt NWP, over a duration of 1 year, then you can entertain the idea. This is just imo, but we're years, if not decades, away from this. We likely need to significantly improve data assimilation for this to occur.
-
Narragansett is look'n pretty wavey: https://northeastsurfing.com/narragansett-cam/
-
July 2025 Obs/Disco ... possible historic month for heat
MegaMike replied to Typhoon Tip's topic in New England
More! (Tip's writing ability) x (Wiz's excitement over New England, severe weather) I'm not a fan of heat, so I ran script to figure out the median date of the max. (Summer) daily temperature via GHCND .csv files (TMAX field). Based on what I ran (32 different records/1 per-year from 1994-2025), the median date is ~Jul. 13th for KBOX (labeled, 'NWS BOSTON/NORTON' at https://www.ncei.noaa.gov/pub/data/ghcn/daily/ghcnd-stations.txt). After July 24th, there's a good chance (75%) KBOX experienced their warmest day of the year. Just for S&Gs.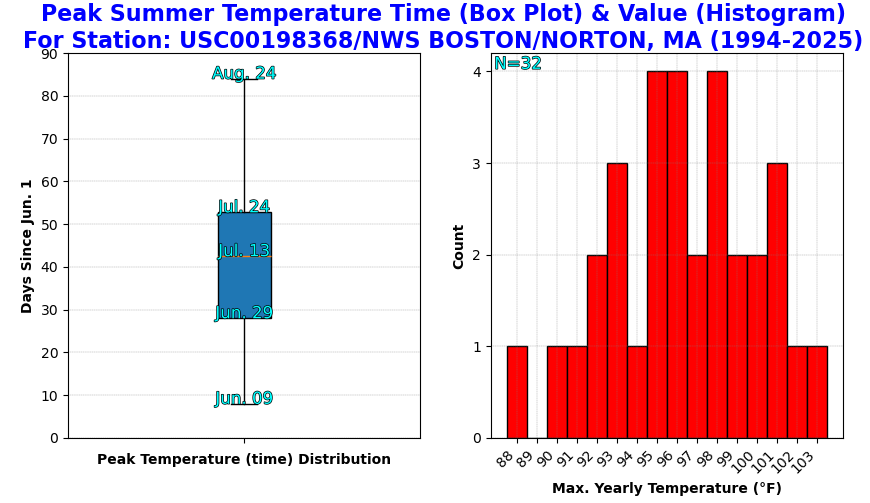
-
July 2025 Obs/Disco ... possible historic month for heat
MegaMike replied to Typhoon Tip's topic in New England
Definitely! If CM1 missed this one (Reno), it likely can't resolve tornadoes unless (maybe) you beef up the model specs. The amount of resources to even run that simulation still gets me... A quarter of a trillion grid points, for a 42 minute simulation (time steps = 0.2s), that spans an area of ~5,600 miles^2 (~6x size of RI), and it took their cluster 3 days to run. That's crazy. Imagine running that for the entire U.S.? -
July 2025 Obs/Disco ... possible historic month for heat
MegaMike replied to Typhoon Tip's topic in New England
Right? Super cool! I believe they used VAPOR to create most/all of their graphics. Agreed in that I doubt they'll be able to replicate their success for most other tornadoes -
July 2025 Obs/Disco ... possible historic month for heat
MegaMike replied to Typhoon Tip's topic in New England
My advisor would always tell me that! Someone did manage to simulate a tornado (EF5 in El Reno 2011) using a modeling system intended for very fine atmospheric phenomena (CM1): https://www.mdpi.com/2073-4433/10/10/578 If you wanted, had the resources (19,600 nodes -> 672,200 cores & 270 TB worth of space), and had a lot of time, you can run the simulation too! In serial mode (single CPU), it'd take decades for this simulation to complete. Really, we have the modeling systems to run highly accurate simulations, but unfortunately, data assimilation and (relatively) limited resources is inhibiting us. A nice video of the results: -
July 2025 Obs/Disco ... possible historic month for heat
MegaMike replied to Typhoon Tip's topic in New England
Logically, it doesn't make sense to me: Let's bring in data scientists to create a stand alone, meteorological modeling system lol. I'm sure it'll get better (build dat' training dataset), but for now, I'd say they're 1-2 decades away from making anything comparable to traditional NWP. I still think using AI to bias correct ic/bcs is the way to go. I know that has merit. Yea, it's a bit misleading... They used HRRR analysis as ground truth to make the conclusion that 'HRRR-Cast is comparable to HRRR...' I'd still rather see evaluations/comparisons at METAR/radiosonde sites. -
July 2025 Obs/Disco ... possible historic month for heat
MegaMike replied to Typhoon Tip's topic in New England
New model development from NOAA: The Global Systems Laboratory is set to release an experimental, high resolution AI product called, 'HRRR-Cast.' It's been trained on 3 years worth of HRRR analysis data... Lately, computational efficiency is starting to dominate the modeling world and I'm incredibly skeptical of it. According to https://arxiv.org/html/2507.05658v1 (assuming this is the same modeling system): "HRRRCast outperforms HRRR at the 20 dBZ threshold across all lead times, and achieves comparable performance at 30 dBZ." "HRRRCast can produce ensembles that quantify forecast uncertainty while remaining far more computationally efficient than traditional physics-based ensembles." Big caveat: The study used HRRR analysis data as 'ground truth.' Therefore, it's no surprise that HRRR-Cast, and their other AI model, performed well compared to diagnostic HRRR/forecast output. Until I see AI outperform conventional NWP at METAR/radiosonde sites (surface and aloft), I'm not going to get excited. -
Embrace the NAM while you can, weenies. Change is coming.