MegaMike
-
Posts
576 -
Joined
-
Last visited
Content Type
Profiles
Blogs
Forums
American Weather
Media Demo
Store
Gallery
Everything posted by MegaMike
-
 Oh, absolutely! Knowing potential error in forecasting is useful. It can help determine an edge Agreed. Models struggle along tight gradients. That's universal regardless of boundary type (dry-moist, warm-cold, land-water, etc...) ... Advantage will always go to the finer resolution modeling system.
 -
That I know of, no... Would save me a lot of time if there was. Maybe some members from the NWS has (special) access to some evaluations?
-
Although, likely skewed by courser models, the 07z NBM has a high (mean) of 104F for KBOS on Friday w/a std of 2F. Definitely entered the hawt'est time of the year. Won't escape (climatologically speaking) until late July. For KBOS, the mean high doesn't start getting colder until July 23rd. Was planning on staying outside for most of the day just west of Albany on Friday. May have to delay the trip by a day or two.
-
I haven't experienced a high gradient weather event I didn't like Similar, but unrelated uncertainty today. Got 1/2 my $ back from yesterday's losses... The weather market is a lot like weather challenge, but far more competitive. You can definitely make a profit. Although I trash bots, I am developing one to monitor observations/forecasts and automate trades. The combination b/n statistics, weather, and gambling is too stimulating to ignore.
-
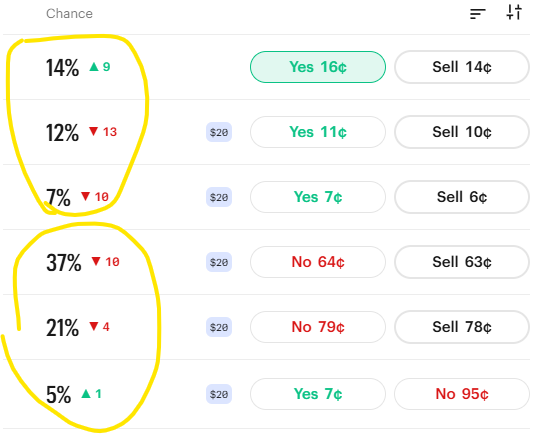
I'll definitely remember this one. Really, the only near full-proof plan with Kalshi is to wait on DSMs/remarks and "trade" on highs/lows that already occur. You need to compete with bots and that's difficult to accomplish unless you develop a bot yourself. I do wonder where people get observations from in near real-time. Odds flipped well before an observation was provided at https://www.weather.gov/wrh/timeseries?site=KBOS Anyone from the NWS know? I think MADIS is the closest you can get to ~real-time.
-
Duplicate observations too. I claim foul play! There were other 88 degree observations afterwards, and the DSM does have 88 at 14:59LST (after the random gusts to 51kt) so I'll take the 'L' on this one. If I mention AI again, ban me. Every time I question AI's reliability/efficacy/etc..., I get lit up lol
-
+6 degrees within 5 minutes. Definitely didn't expect that. The first few observations looked suspicious too. Good call, @CoastalWx I guess I gotta' torch the sensor to collect on the over
-
Winds out of the north now. Probably no good for highs staying below 88.
-
Winds are getting weaker and the temp is starting to increase. The timing was modeled pretty well by the HRRR, but the magnitude is likely off by a few degrees since a) HRRR==WRF (pretty observable negative bias) and b) HRRR has KBOS entirely over water. I just need the temp to stay below 88 and I do well Give me another hour of dat' muted sea-breeze, and I'll feel more confident.
-
Good day for meteorologists on Kalshi! High has been stuck at 78-81 since ~10am due to the sea breeze. Winds are still out of the SSE at ~12mph w/several hours of daytime heating remaining. Despite that, lots of "bots" are bang'n highs of 88+. This is one of those situations where humans dominate bots... Anomalous, small-scale weather. You love to see it. Judging by the distribution, looks like 65% bots vs. 35% humans (predicting the max. temperature at KBOS). The bots are too caught up on the NWS gridded forecast (expected high of 89 as of this morning).
-
'A' for me in Wrentham, MA. If we got significant snow one month earlier, or if it was a little snowier, it'd be an A+. It was a little dry when I prefer snow the most. Otherwise, can't complain about two 18"+ snowstorms w/lots of cold.
-
Glad to help @The 4 Seasons! You could vectorize those images using QGIS (free software). It'd be incredibly tedious though. You'd have to geo-reference the images, then trace the contours. I think it'd be worth it
-
It'd be awesome if you could calculate return rates/quartiles/means with all your interpolations, @The 4 Seasons. Are your products still images, or are they vectorized/rasters? Random, but a colleague sent me an image of your 1888 interpolation yesterday
-
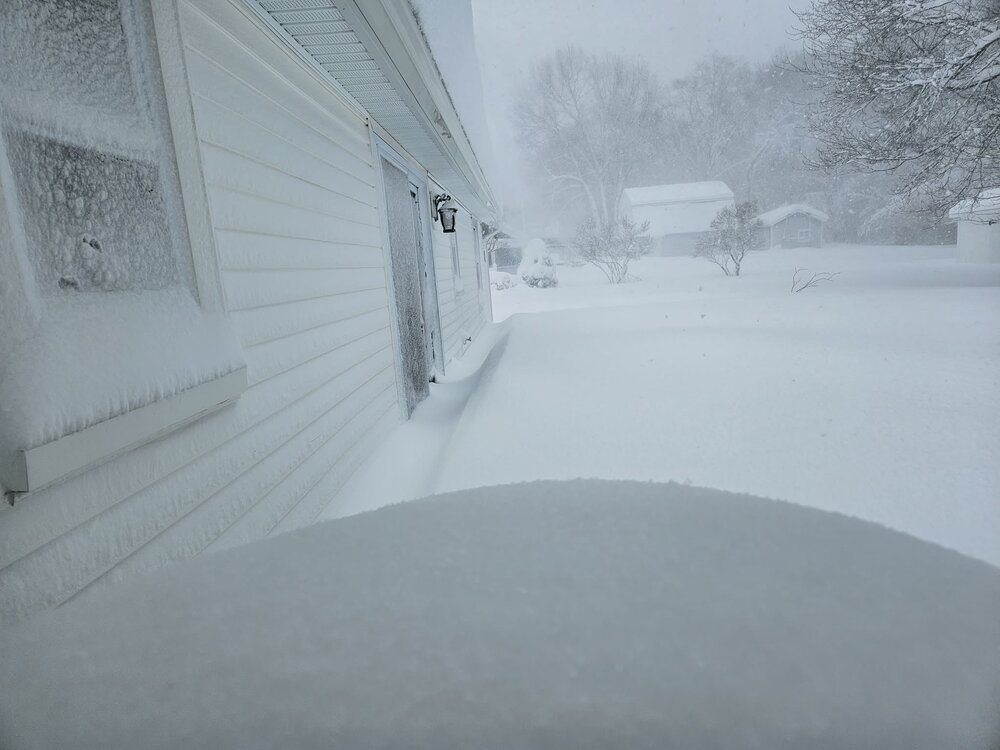
"Don’t do it" 2026 Blizzard obs, updates and pictures.
MegaMike replied to Ginx snewx's topic in New England
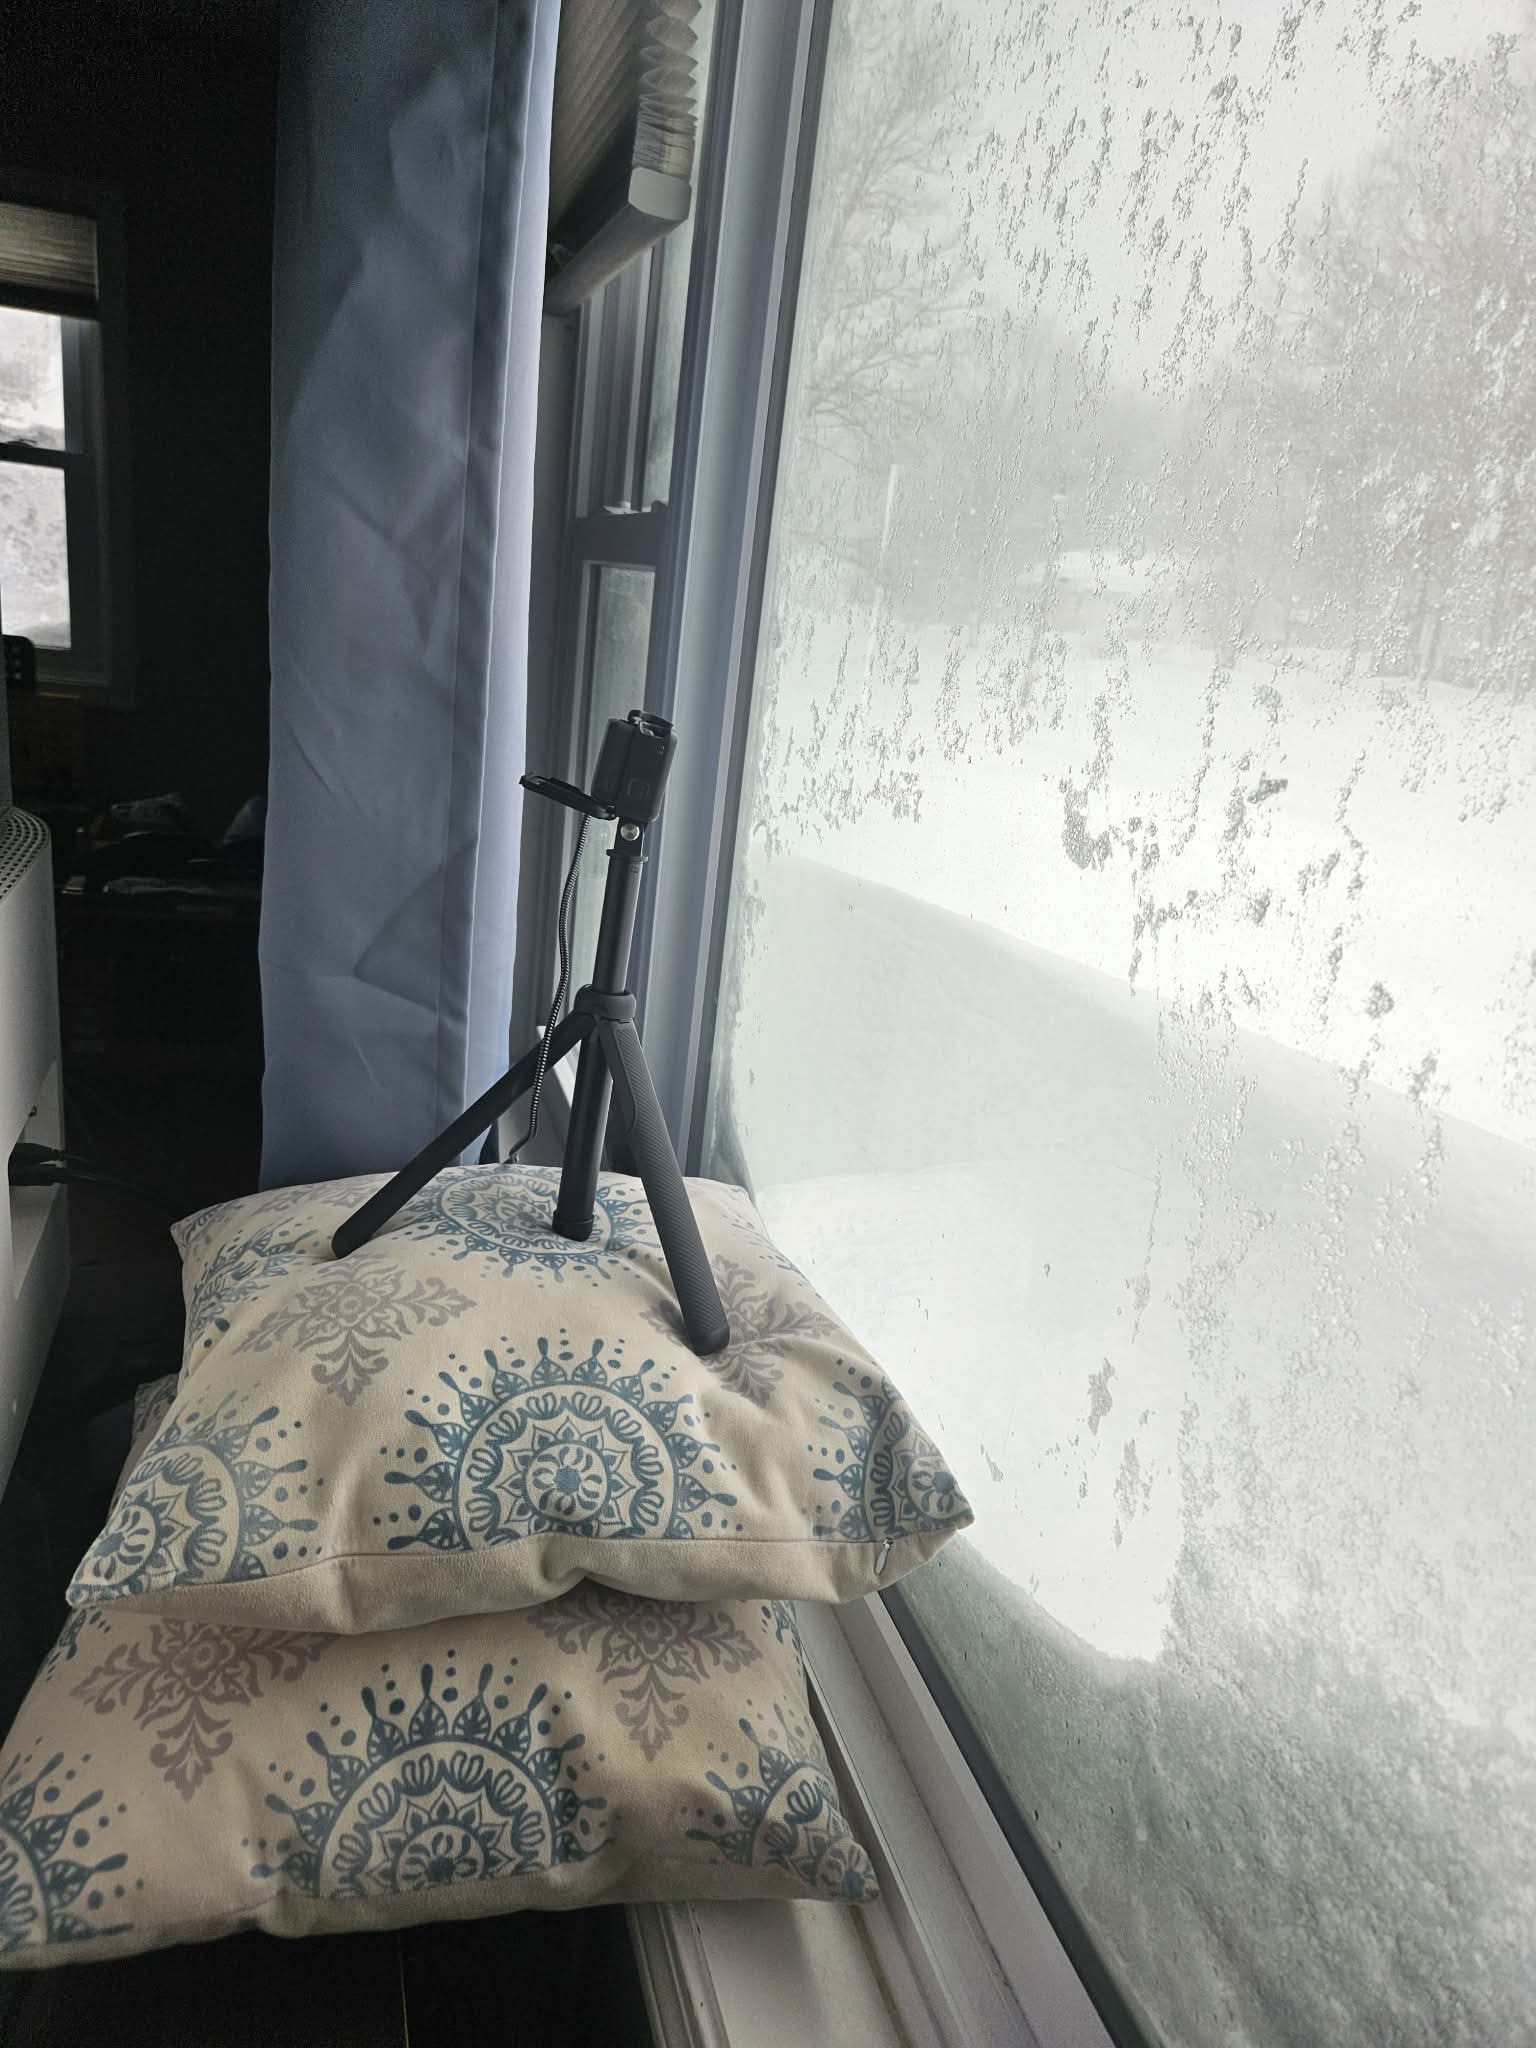
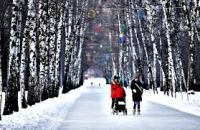
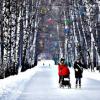
Was finally able to edit my time lapse out of Norton, MA. It's not my place (brother's), but man... I wish I was there. His kids finally returned to school today (all <4th grade). -
"Don’t do it" 2026 Blizzard obs, updates and pictures.
MegaMike replied to Ginx snewx's topic in New England
Still accumulating nicely here... ~0.5"/hr, it looks like. Total of ~20" -
"Don’t do it" 2026 Blizzard obs, updates and pictures.
MegaMike replied to Ginx snewx's topic in New England
HRRR has an additional 2-5" for most locations east of 190 for E MA, far W CT, and all of RI. More (4/5") towards SE MA. -
"Don’t do it" 2026 Blizzard obs, updates and pictures.
MegaMike replied to Ginx snewx's topic in New England
Oh, for sure! Looking at photos/accumulations, the Norton, Taunton, and Raynham area will break 30" if they haven't already. -
"Don’t do it" 2026 Blizzard obs, updates and pictures.
MegaMike replied to Ginx snewx's topic in New England
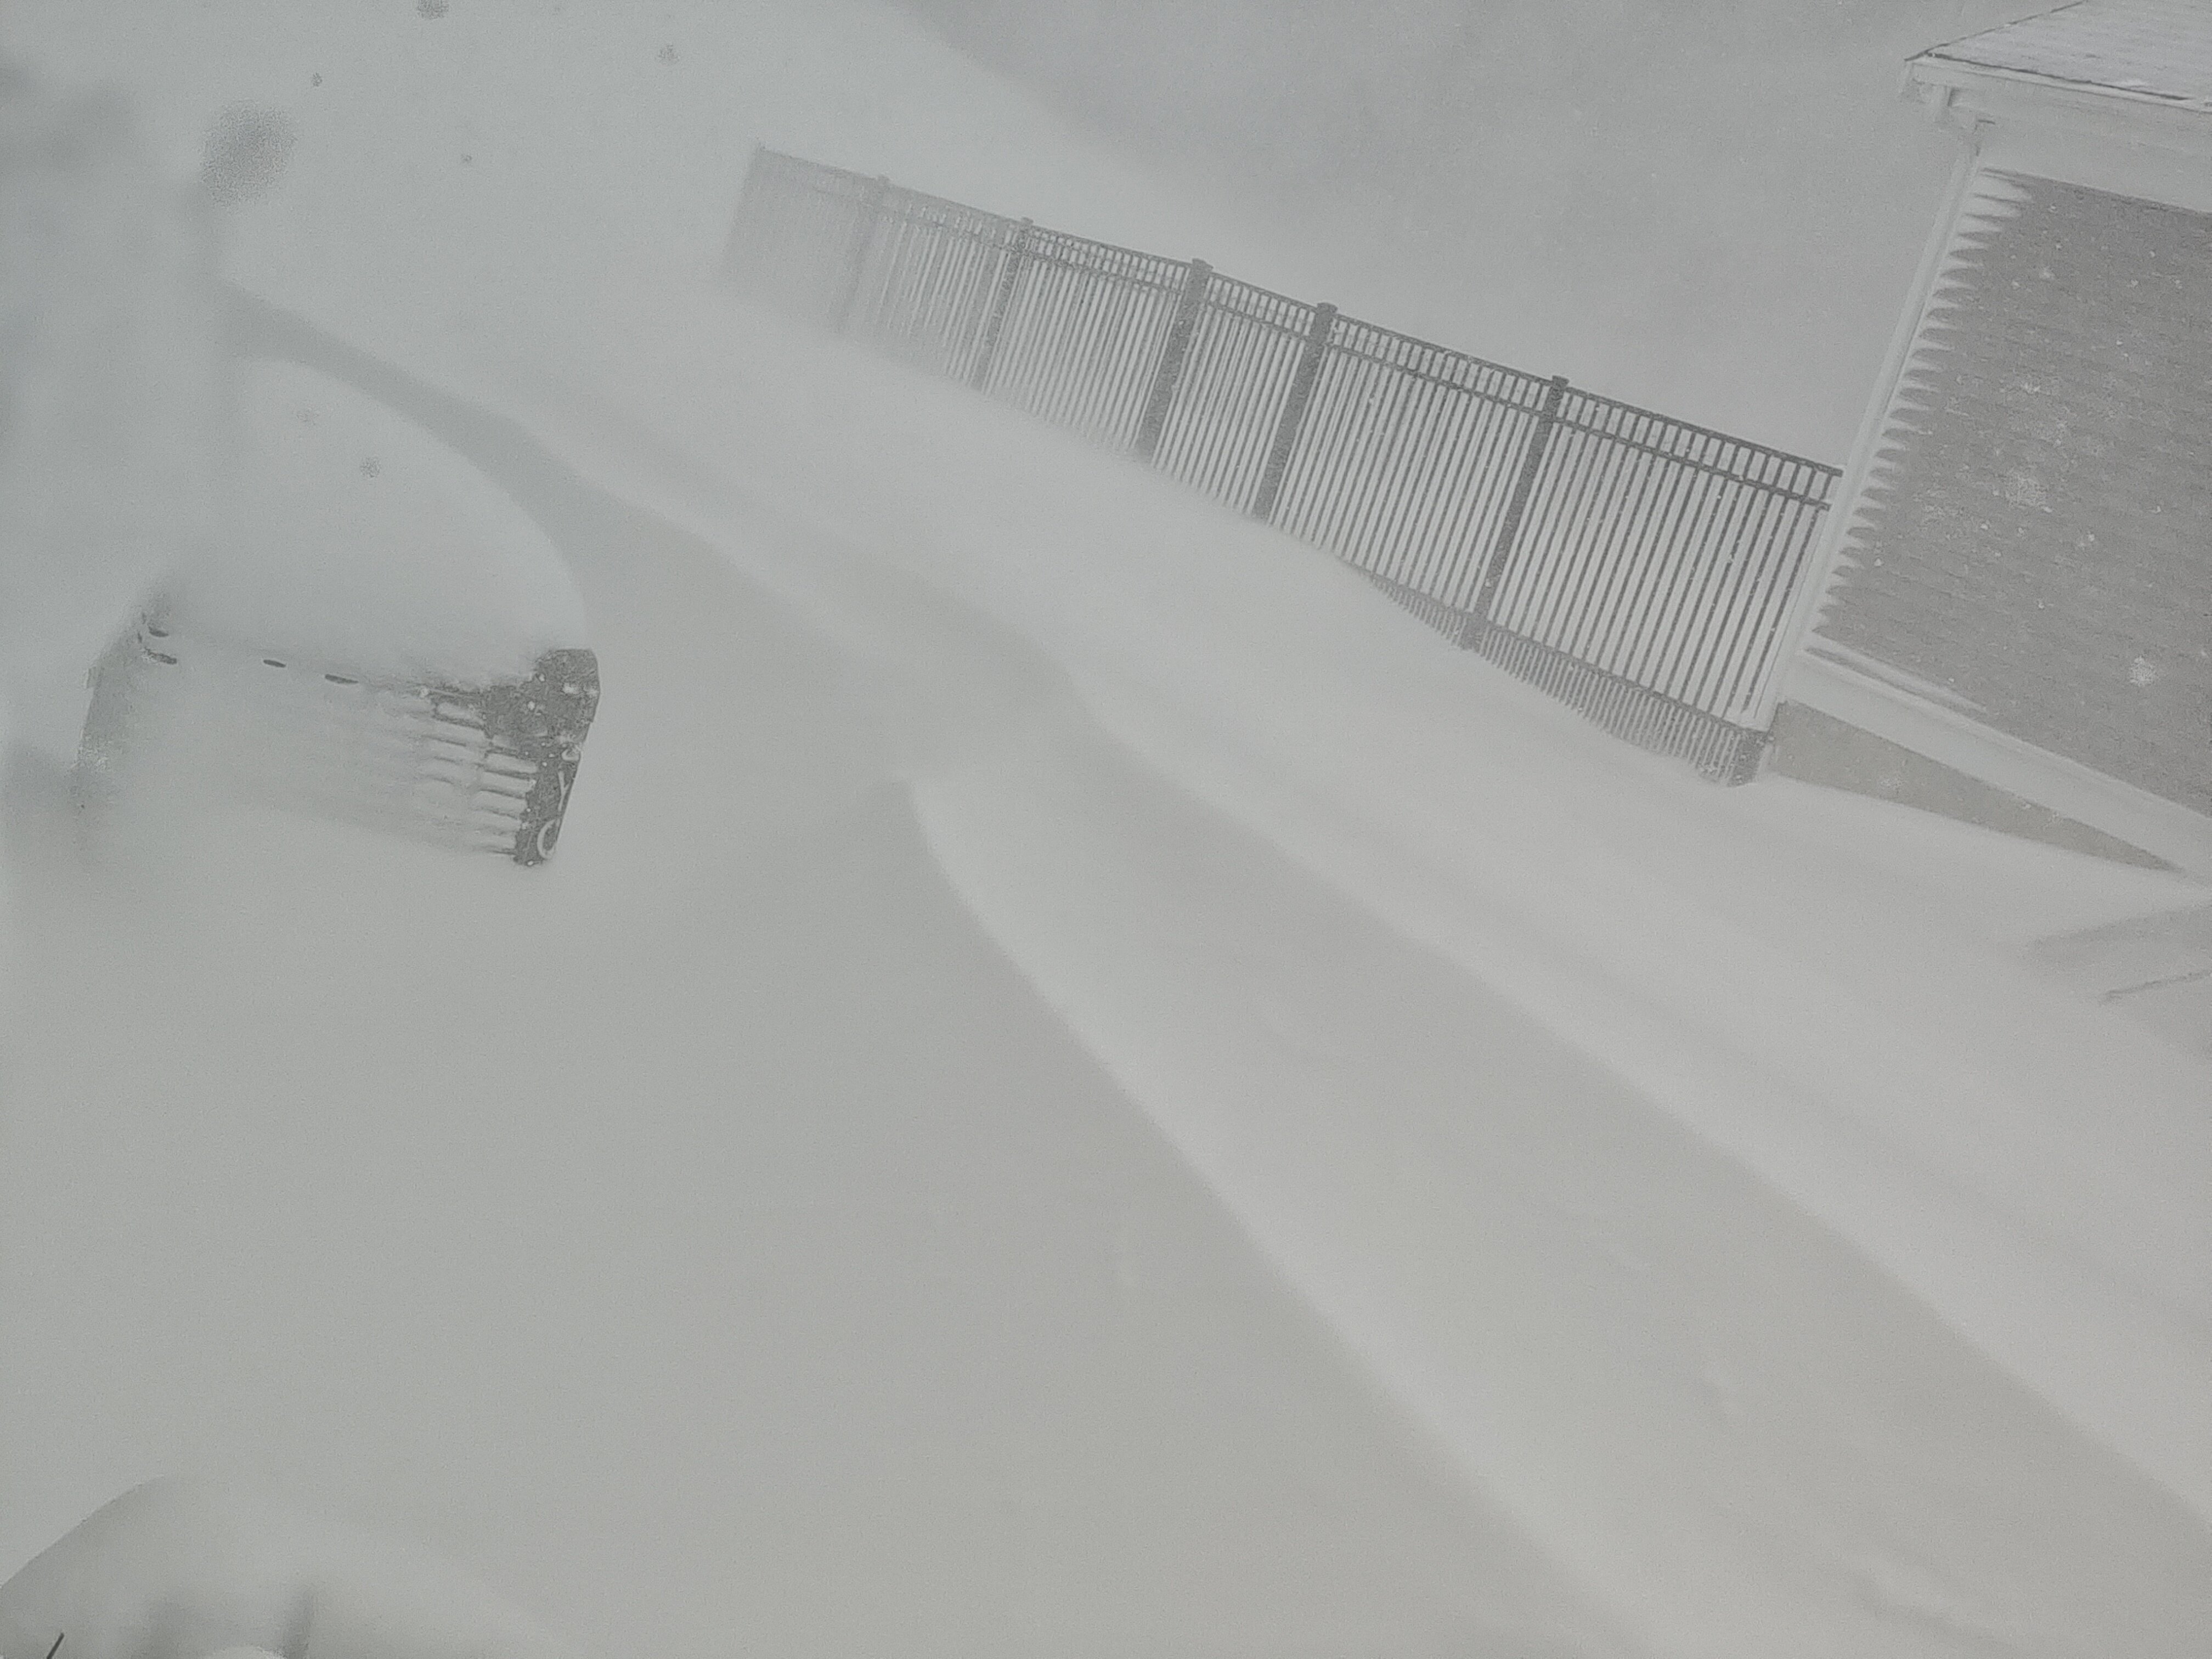
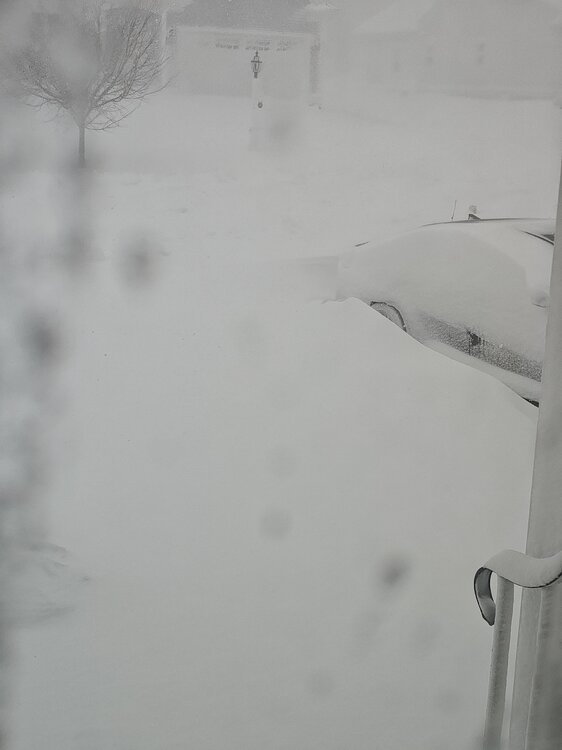
Drift got too high in Norton. Had to adapt.
-
"Don’t do it" 2026 Blizzard obs, updates and pictures.
MegaMike replied to Ginx snewx's topic in New England
Awesome! Sounds like amounts may surpass 05' for Attleboro. That's my #1 all time. -
"Don’t do it" 2026 Blizzard obs, updates and pictures.
MegaMike replied to Ginx snewx's topic in New England
The gusts have been impressive! Not sure how credible it is, but a station in Wellfleet, MA (F3885) gusted to 98mph.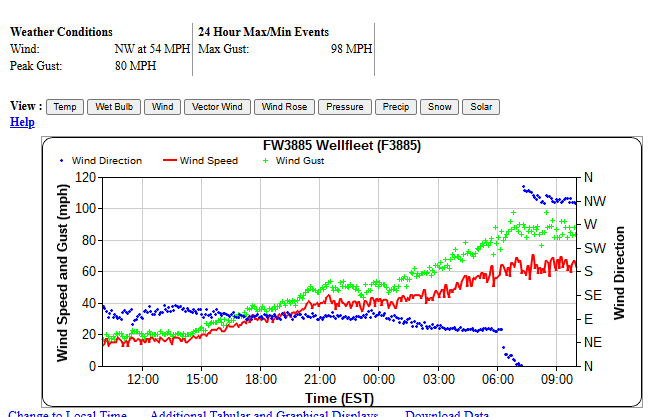
-
"Don’t do it" 2026 Blizzard obs, updates and pictures.
MegaMike replied to Ginx snewx's topic in New England
HRRR maxes out gusts over the next hour across SNE (followed by a slow decline). Brace yourself... I think I may have just gusted close to 50mph a little while ago. -
"Don’t do it" 2026 Blizzard obs, updates and pictures.
MegaMike replied to Ginx snewx's topic in New England
It'd be wild if they break 30". It never happened in the city. -
"Don’t do it" 2026 Blizzard obs, updates and pictures.
MegaMike replied to Ginx snewx's topic in New England
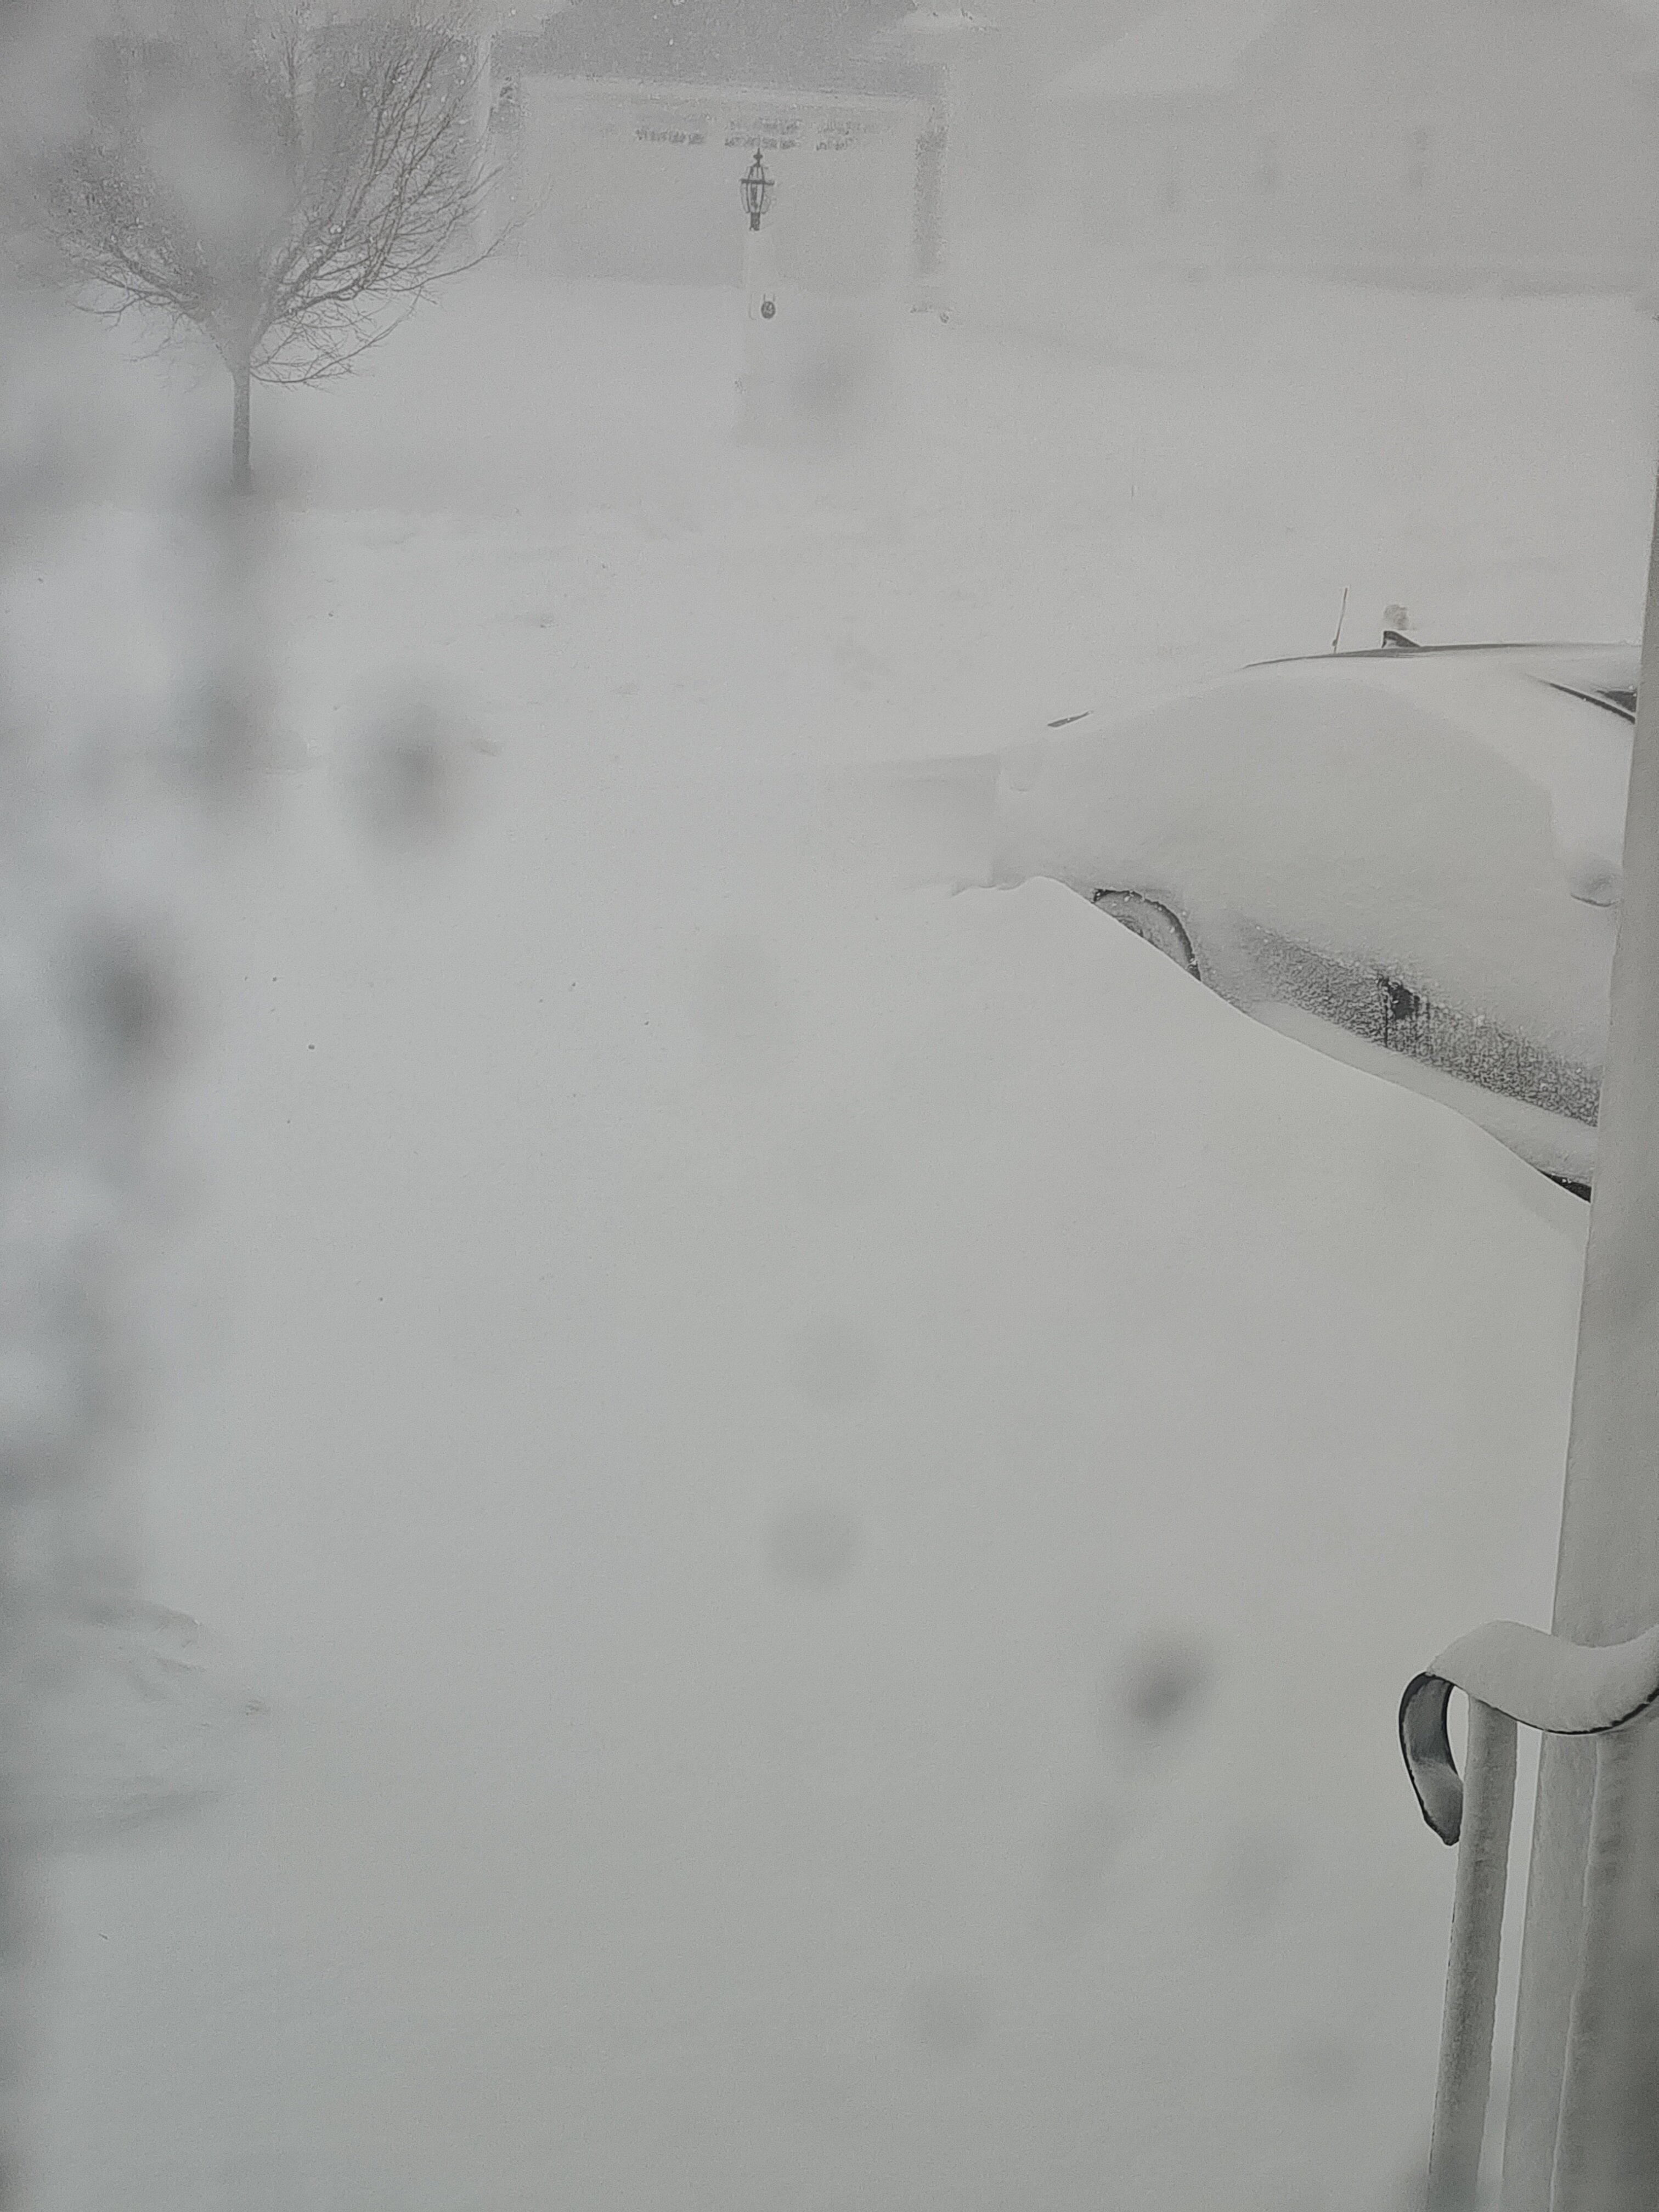
Still heavy snow with lots of drifting in Wrentham. I'm thinking ~16". Drift approaching 3-4'.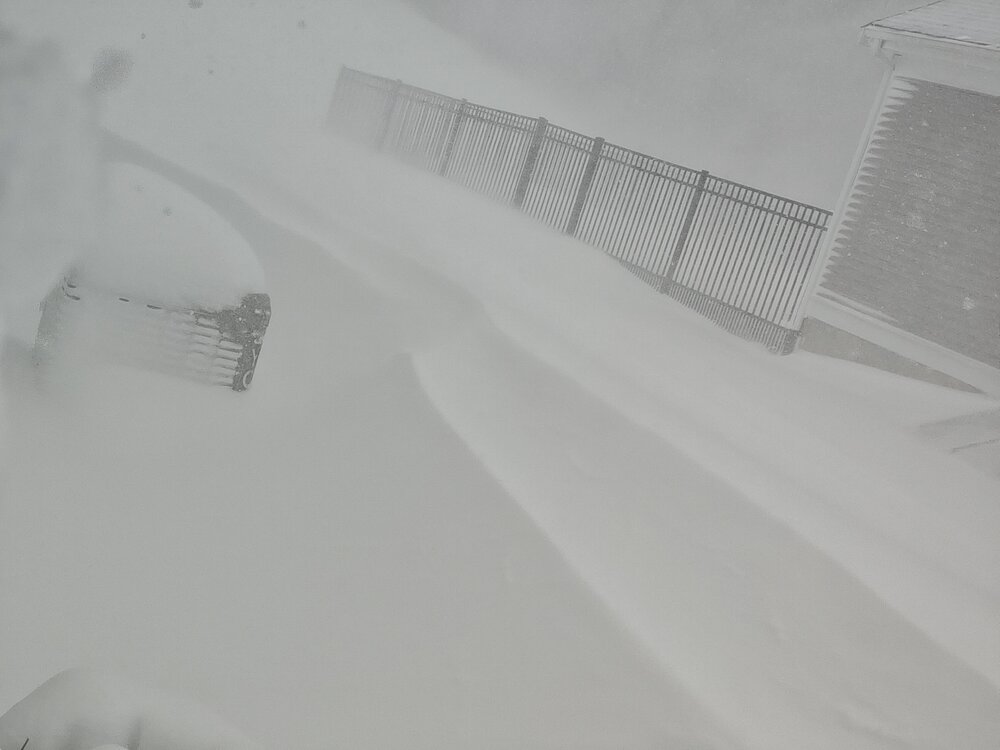
-
"Don’t do it" 2026 Blizzard obs, updates and pictures.
MegaMike replied to Ginx snewx's topic in New England
That's about what I expected. My brother in Norton looks to have ~16" with drifts approaching 3'. Good to see Providence and Attlehole doing well. -
"Don’t do it" 2026 Blizzard obs, updates and pictures.
MegaMike replied to Ginx snewx's topic in New England
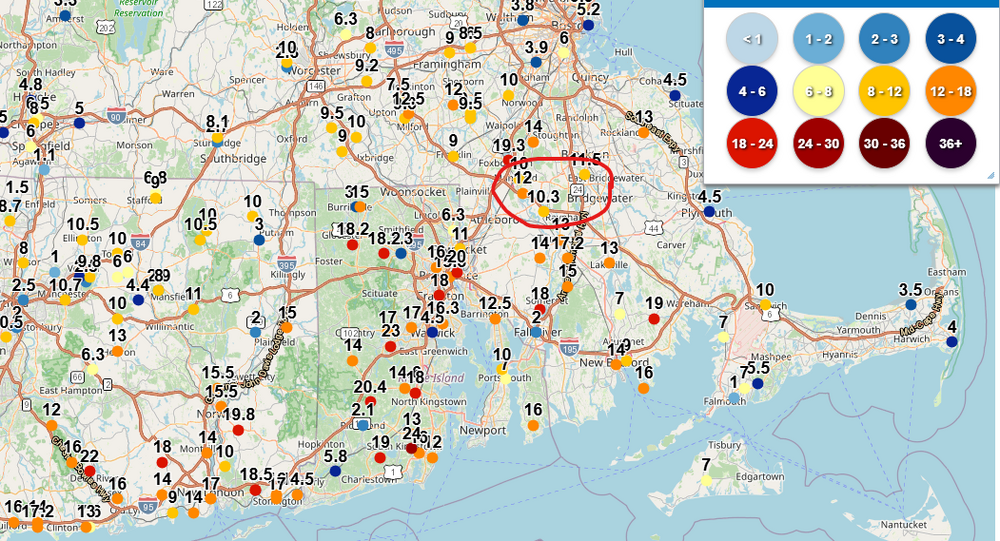
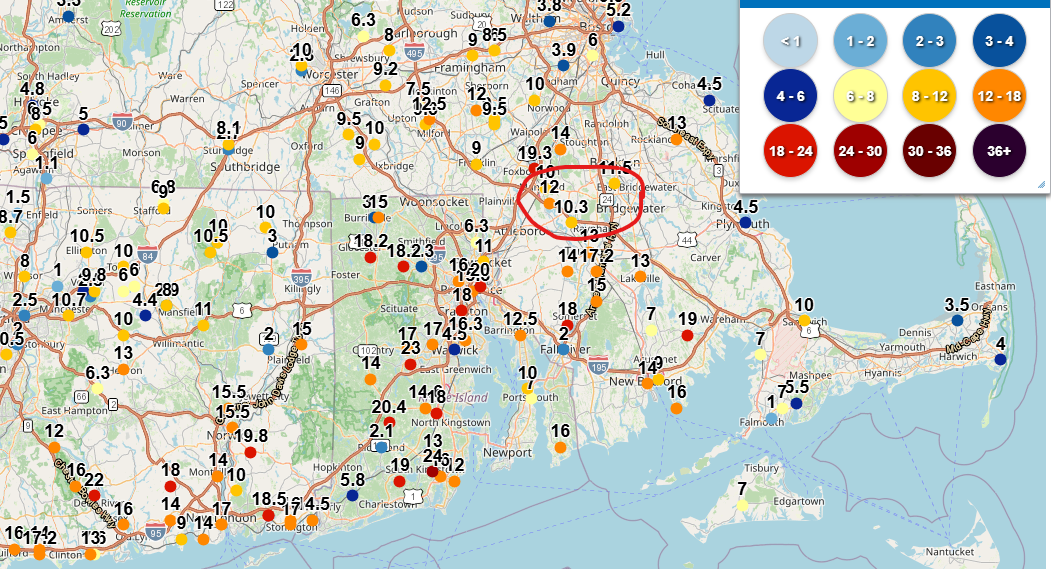
There are two observations in Foxboro of 19.3" (~9am) and 16" (8am). That checks out. Not directed to you, but the Taunton/Norton/Mansfield observations (circled below) need to be updated. They must be approaching 16+" by now. E. Providence w/a 20" observation now too. Good for them!