MegaMike
-
Posts
576 -
Joined
-
Last visited
Content Type
Profiles
Blogs
Forums
American Weather
Media Demo
Store
Gallery
Everything posted by MegaMike
-
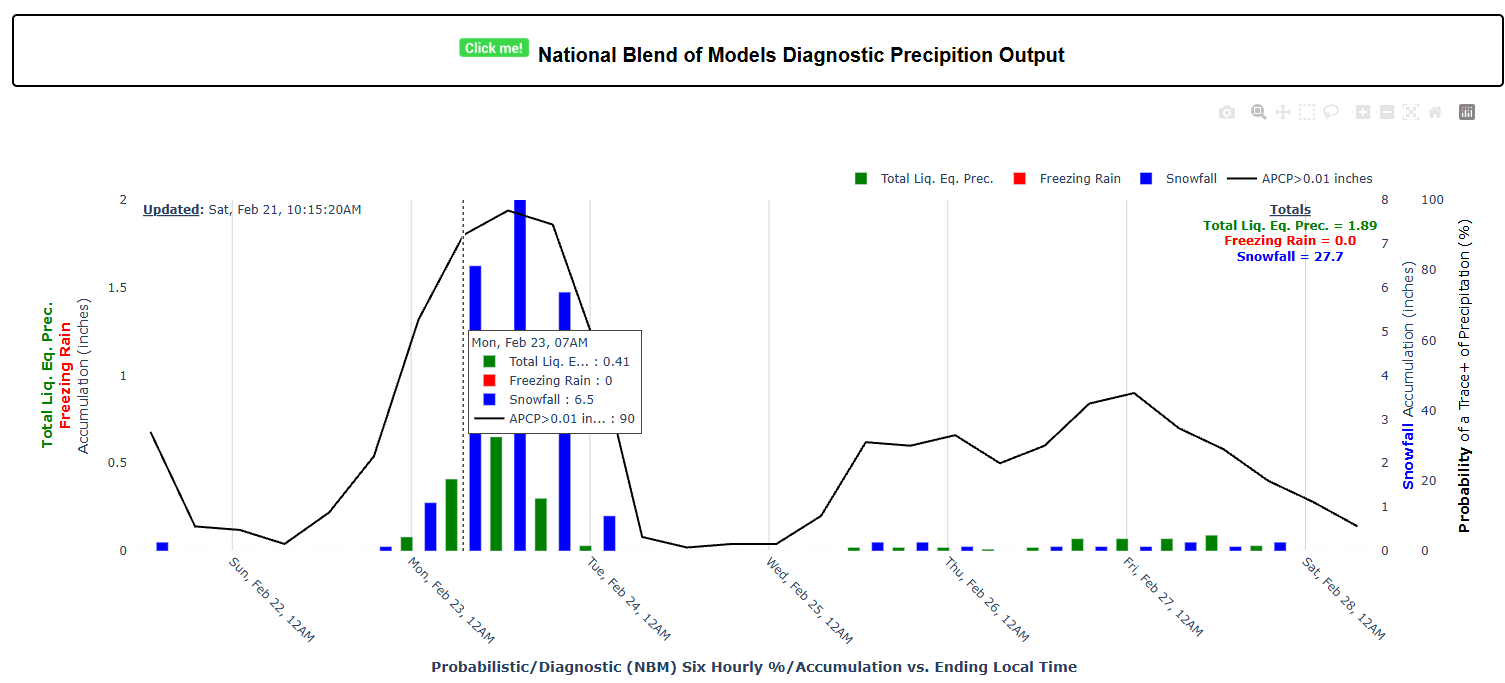
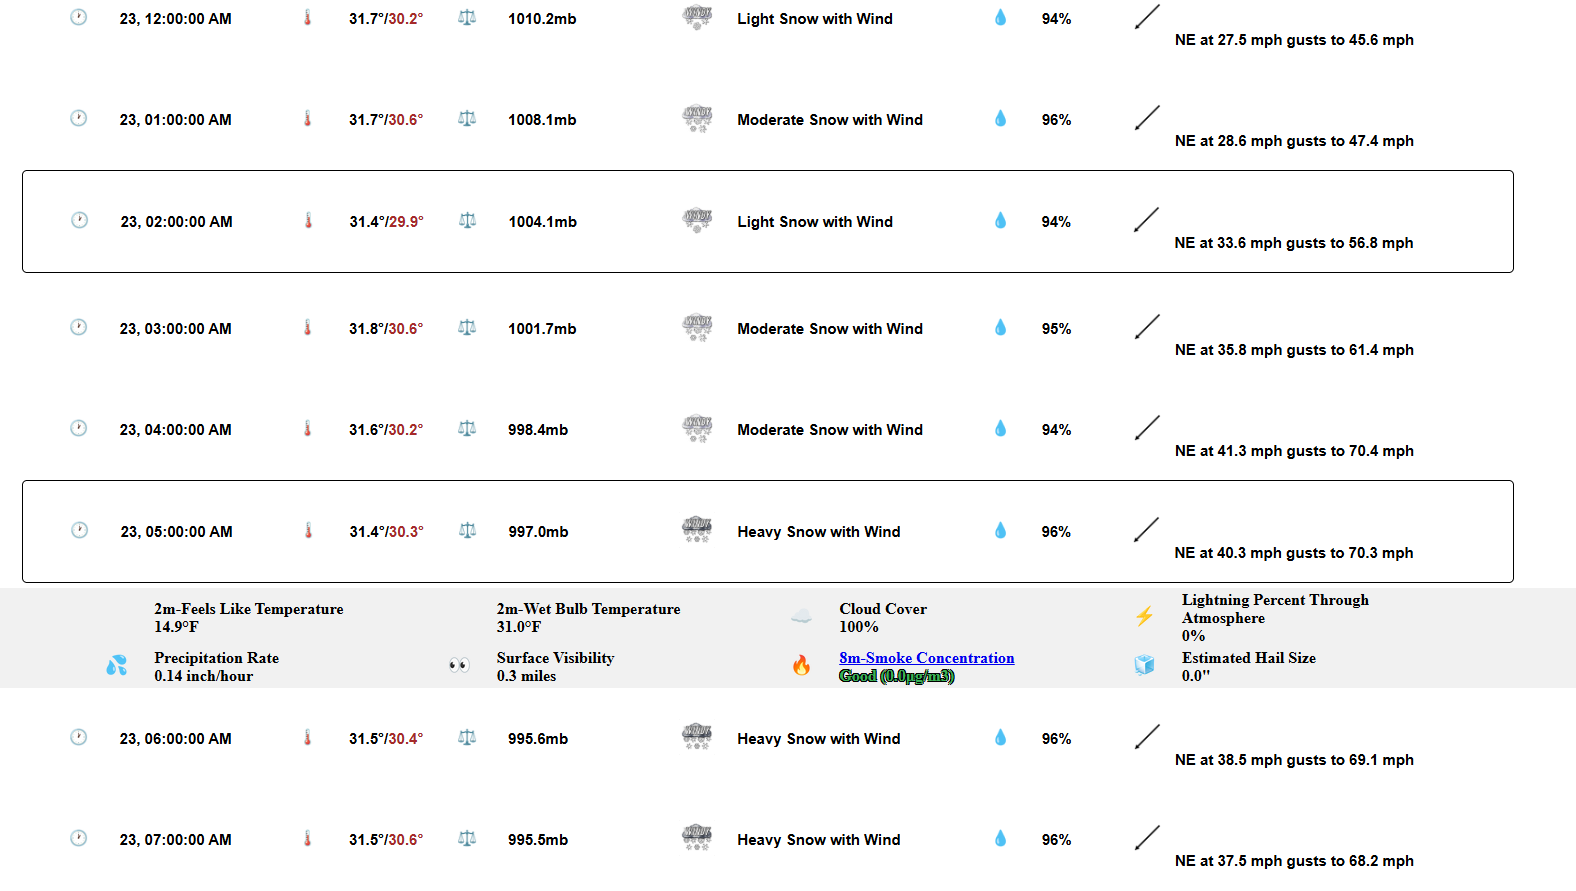
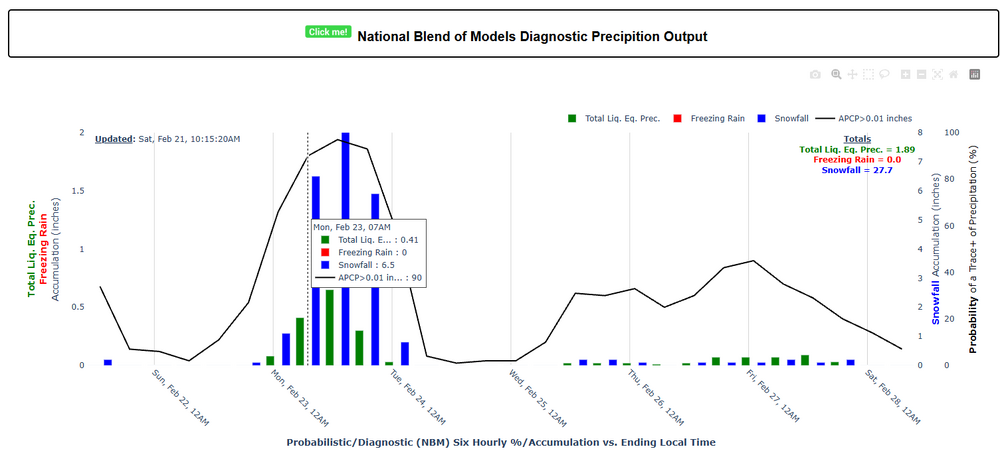
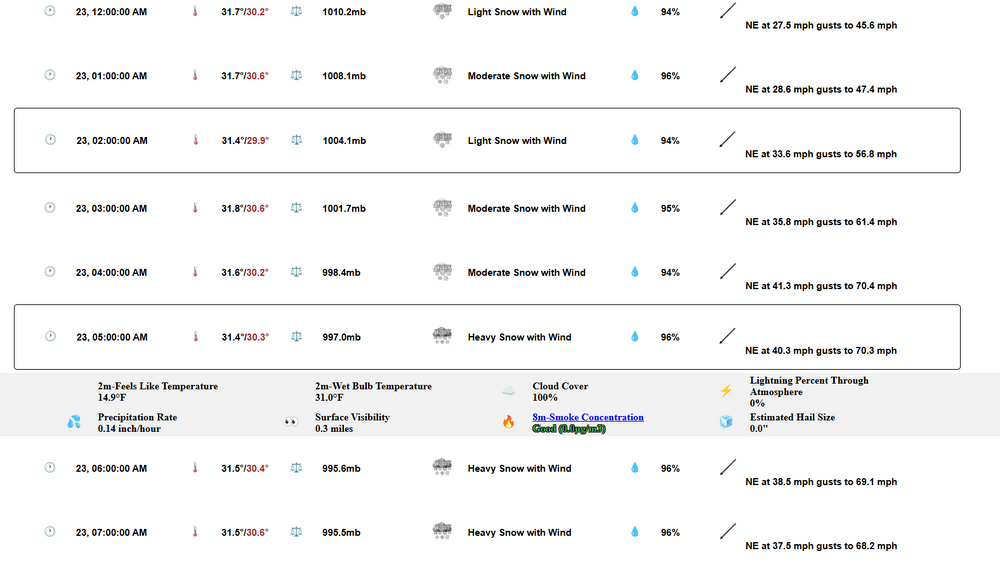
I'm excited to test my weather application for this event. Here's what it looks like for Boston (NBM): And the HRRR: I stole the icons from The Weather Channel
-
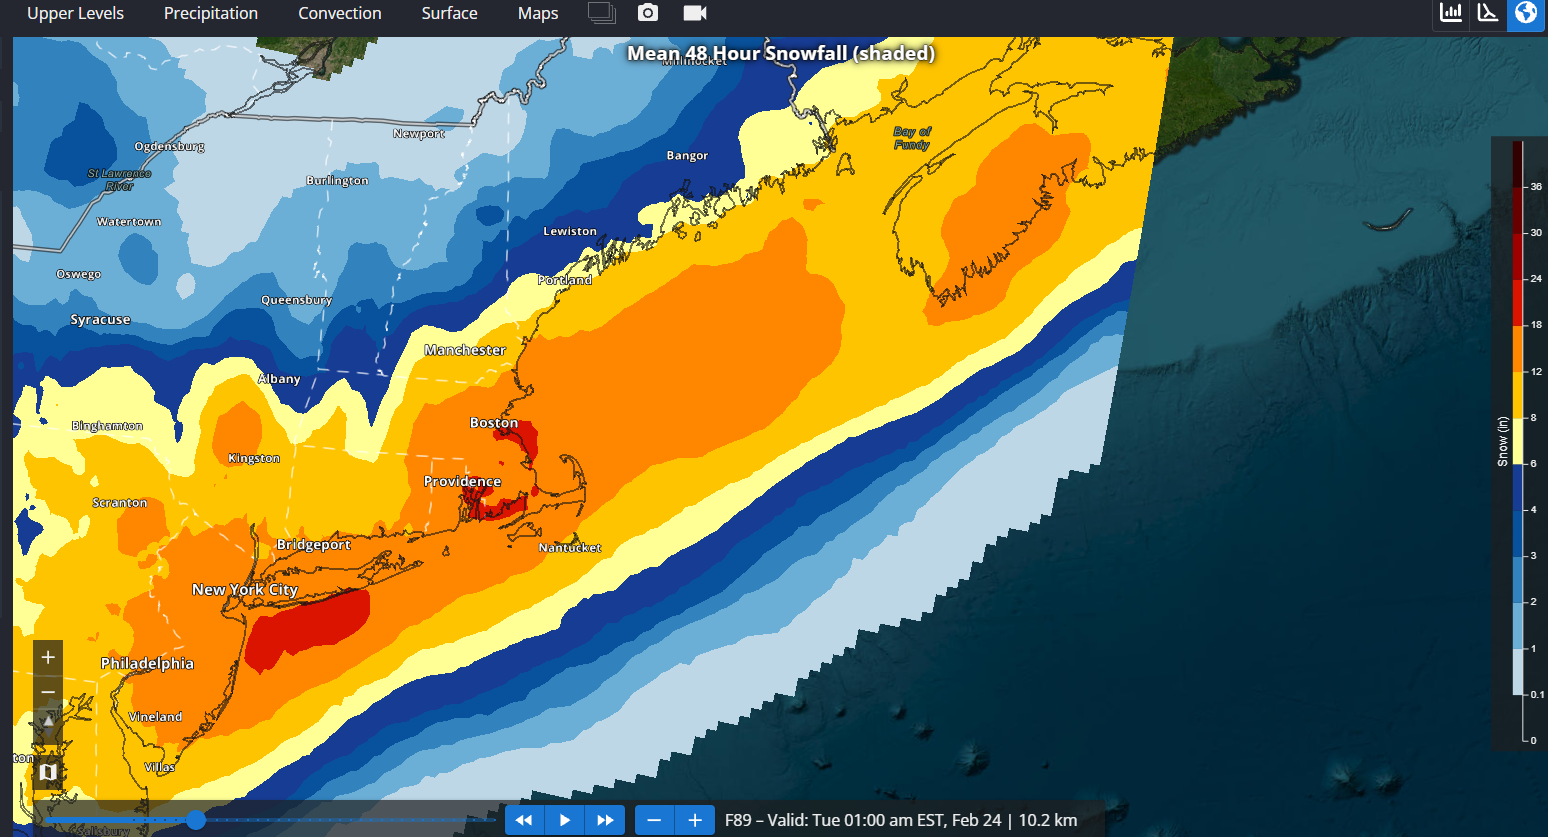
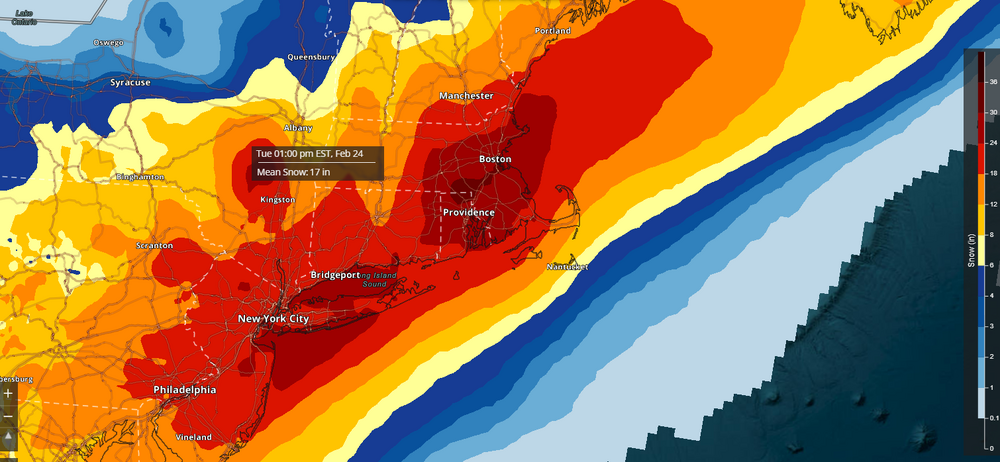
13z NBM is pretty wild. The mean(!!!) has a large area of 24-30" across the Boston/Providence area (even 30-36"). The diagnostic ratios are likely too high considering winds will be strong. EDIT: for NYC weenies, this is 48hr-snowfall accumulation maxed out for SNE... The totals are higher for the NYC area, but you need an earlier image to capture it better.
-
Man. I was thinking whiff/graze yesterday at noon. It's wild how well this has trended since yesterday. The GFS looks so hawt'
-
Still ongoing, friend: While on the subject, I wrote to Don and someone else about how snowfall is determined by the NBM several weeks ago. For clarity, I mentioned that the weights (available here: https://vlab.noaa.gov/documents/6609493/32850490/CONUS_SNOICEACCUM.pdf) temporally vary. On top of time-varying weights, the ensemble members incorporated into the mean are lagged by ~1-2 cycles (depends on modeling system)... To see which models/cycles are included by the NBM at any forecast time, you can use this link: https://blend.mdl.nws.noaa.gov/nbm-dashboard Additionally, it takes ~1 cycle to post-process the NBM. Therefore, the most up-to-date NBM snowfall product will have a lag of ~2-3 cycles. This is where the confusion is imo.

-
I never imagined the GFS/GEFS scoring a coup against almost every available modeling system. Yet, here we are... As we continue to see westward trends, the NBM (13z) is starting to beef up mean-snowfall considerably. This doesn't include today's snow event (map goes from Sunday 1am to Tues. 1am). As modeled, it looks like it'll start snowing b/n ~1pm-7pm on Sunday and ending late Monday night across SNE. For clarity, the NWP members incorporated into the NBM are (generally) lagged by 1-2 cycles... For example, the cycles utilized for the 13z NBM are 00z (EPS), 06z (GEFS), and 03z (SREF). Additionally, on DESI, the 13z NBM is the most up-to-date cycle available, so on top of the 1-2 cycle delay, you have another 1 cycle delay for post-processing... I understand why people are so confused with the NBM's snowfall depiction (not even considering how weights are incorporated which vary by time). You can see which cycles are used at https://blend.mdl.nws.noaa.gov/nbm-dashboard. In the past, I only added the weights (https://vlab.noaa.gov/documents/6609493/32850490/CONUS_SNOICEACCUM.pdf). Based on the most recent model cycles, the mean will bump up next cycle too.

-
Yea, unless the ECMWF/EPS improve at 12z, I think this will be a graze, at best. Definitely tossing the GFS/GEFS.
-
At this point, regardless of trends, I'm leaning towards the ECMWF/UKMET and their ensembles (graze/OTS)... Especially since they're both near misses at the moment and the CMC backtracked a little bit. No matter what I analyze in terms of evaluations (fields, isobaric surface, space, and time), the GFS performs comparably to the CMC and JMA. The ECMWF and UKMET are 1 and 2, respectively. Maybe the UKMET went to rehab over the past few decades and became an accomplished businessman?
-
I agree with you. Ignoring trends, this looks like a graze verbatim. Most ensemble means (I think Ryan posted probabilities earlier) barely, if at all, get the 24hr-QPF 0.5" contour to the Cape/Islands. Definitely keep expectations low, for now.
-
Agreed with dendy and Coastal. Better than the NAM, but would kick OTS. I would say it looks worse than its 06z cycle too.
-
It's still ~5 days out. Still plenty of time for trends, as Mr. Sey-Mour alluded to. Would ease my if the EPS improves.
-
It's hard to dispute the verification webpage. I guess it's possible results are skewed in favor of fair weather, but I agree with what Tip wrote a few days ago: I think most members focus on single events and get too emotionally biased. Anywho, as INS mentioned, the 12z EPS is a step back when looking at the mean...
-
Generally, the ECMWF outperforms the GFS, CMC, JMA, and UKMET for every variable (gph, wind, temperature, etc...), isobaric surface, and for all spatial (CONUS, N-Hem, etc...) and temporal (fcst hr 0-240) stratification over the past 31 days. I would say, the UKMET is a close 2nd place though (at least, for gph). It even slightly outperforms the ECMWF from ~122-140hr. For visualization (https://www.emc.ncep.noaa.gov/users/verification/global/gfs/prod/atmos/grid2obs/hgt/): Regardless, I'm still placing more weight on ensembles. If the EPS improves/holds steady, I'll still follow the event.
-
How bout' an EPS trend gif before its 12z cycle? Definite improvement on the mean since yesterday's 18z run. I wonder if models over corrected last night given some sort of data assimilation feedback... We'll see!
-
GEFS mean is ~50-100 mile improvement. If the ECMWF + EPS look better at 12z, I'll feel more enthusiastic about this event.nt.
-

Possible coastal storm centered on Feb 1 2026.
MegaMike replied to Typhoon Tip's topic in New England
Go to this link, https://vlab.noaa.gov/web/mdl/nbm-weather-elements then click the parameter you're curious about. If the field has a 'CONUS' option, click it. You'll get a table that specifies model weights. Despite the description, I still can't make sense of the NBM snowfall maps that correspond to their model weights. Something else seems missing... The map seems too high and I don't see much that supports those values b/n the SREFs, EPS, GEFS, and GFS. -
It's frustrating, for sure. I think to be 100% satisfied with their documentation, they need to provide an example for one case study. ie... Provide a table of snowfall accumulations (and exactly what field/how they processed snowfall) for all ensemble members + diagnostic models, take the weighted sum of all ensembles/models, then show the final result superimposed onto their NBM map. When I ran the calculations as you did, my value was far off from what the map showed too. I do trust that their documentation is correct (consisting models and weights wrt time), but something else does seem missing. I may ask the developers when I have time, but I think Don already did this.
-
From hour 61-84 the NBM snowfall (it's different per variable) product composes of the GEFS (30 members; weighted 24.75%), EPS (50 members; 41.25%), GFS (weighted 4%), and SREF (10 members; weighted 30%). Likely, either the SREFs, and or EPS, beefed up snowfall a little bit... The GEFS/GFS still look poor.
-
Excellent! Now try running these modeling systems (similar to the AIGFS and EC-AIFS). They'll perform better and you'll get a good challenge out of it https://github.com/google-deepmind/graphcast
-
Based on the link I sent, let's see if this checks out... Both the EPS and GEFS have the same weights. 1.2% for each individual member (1.2%*[50+30]=96%)... The GFS has a weight of 4%, so the ensemble snowfall contribution would be, 9 = 8 GEFS + 1 EPS SF_ens = 9 * 0.012 * 6" + 1 * 0.012 * 16" SF_ens ~ 1" NBM snowfall is SF_ens + 0.04*SF_GFS. I don't know what the GFS had for the city at 12z, but it could be calculated; NBM = 5.9" based on the map 5.9" = 1" + 0.04 * SF_GFS SF_GFS = 4.9"/0.04 = a very unrealistic answer... So something is off. Do you have the 6z totals? Mathematically, that's how the NBM (imo) calculates its mean.
-
Oh, the irony! I just commented about this in a different thread. At hour 84+, for snowfall specifically, the NBM uses the EPS (50 members), GEFS (30 members), and the GFS (https://vlab.noaa.gov/documents/6609493/32850490/CONUS_SNOICEACCUM.pdf)... So there must be some GEFS/EPS members that still support a (significant) snow event. You'd have to look at the individual members themselves to determine how (are there a few members skewing the mean, are there two different 'camps', etc..) that map you posted above is produced. I thought it was odd too. For skewness, you could also look at quartile ranges provided at https://sites.gsl.noaa.gov/desi/?x4dLocations=["City"]&chart=x4d&lat=40&lon=-105&theme=dark&timeZone=local&hourFormat=12&x4dviewState={"latitude"%3A40.5%2C"longitude"%3A-100%2C"bearing"%3A0%2C"pitch"%3A0%2C"zoom"%3A4}&dset=HREF-CONUS&clusHghlgt=true&x4dMapStyle=3D&x4dMaps={"basemap"%3A{"value"%3A"Mapbox"}%2C"mapboxBasemap"%3A{"value"%3A"Satellite"%2C"parentValue"%3A"mapboxBasemap"}%2C"Airports"%3A{}%2C"ARTCC"%3A{}%2C"Cities"%3A{"checked"%3Atrue}%2C"Coastlines"%3A{"checked"%3Atrue}%2C"County+lines"%3A{}%2C"Countries"%3A{}%2C"Country+lines"%3A{}%2C"Countries+NonUS"%3A{}%2C"Country+NonUS+lines"%3A{}%2C"CWAs"%3A{}%2C"Graticules"%3A{}%2C"HUC+6+(CONUS+%26+OCONUS)"%3A{}%2C"HUC+8+(CONUS)"%3A{}%2C"PSAs"%3A{}%2C"RFCs"%3A{}%2C"Roads"%3A{}%2C"State+lines"%3A{}%2C"Tribal+Lands"%3A{}%2C"Vulnerability"%3A{"value"%3A"Social+Vulnerability+Index"%2C"parentKey"%3A"Vulnerability"%2C"parentValue"%3A"Vulnerability"}%2C"Watches%2FWarnings%2FAdvisories"%3A{}%2C"Zones+(public)"%3A{}%2C"Zones+(fire+wx)"%3A{}%2C"Zones+(coastal+marine)"%3A{}%2C"Zones+(offshore+marine)"%3A{}}&preferredFontSize=14&x4dDset={"renderOptions"%3A"t2"%2C"plotargs"%3A[{"fields"%3A["t2"]%2C"fieldOption"%3A"statisticalMeasures"%2C"trackingID"%3A"tracking_643d2e8c-941e-4f4a-99f4-e0f3eeab9bd4"%2C"layerorder"%3A1769554913471}]%2C"name"%3A"statistics"%2C"default"%3Atrue}&x1dGroup=Default&x1dSection=overview&x1dSingleField=t2&x1dGraphStyle=pdf&x2dGraphStyle=boxwhisker
-
Possible coastal storm centered on Feb 1 2026.
MegaMike replied to Typhoon Tip's topic in New England
The 13z NBM has a 12-18" mean contour for SE MA (looks similar to the map DIT posted). According to dat' link (https://vlab.noaa.gov/documents/6609493/32850490/CONUS_SNOICEACCUM.pdf), snowfall values at 84hr+ are calculated from 30 GEFS members, 50 ECMWF members, and the GFS. Needless to say, some individual members still support this event. 12z GEFS fcst hr 138: 12z EPS fcst hr 138 (last available hour at the moment): -
Snow up to thy' neck... The trooper is 24" tall and snow is ~2/3rds to the top of the figurine. I'd call it ~13-16" (removing some inches that drifted from the roof). Just shoveled the driveway and measured just under 11" on my car. Getting a fine snow that steadily accumulates. Spent about 45mins shoveling and picked up a half inch. Good day overall and it's still snowing!

-
Yea, that band coming through Boston now produced large dendrites in Wrentham. Enjoy it!
-
Ignore it for the coastline. Snow depth is a diagnostic product from each modeling system. It's masked for bodies of water... If you interpolate snow depth from a body of water (always 0") to a place over land (>>>0", in this case), it'll always have a tight gradient for coastal locations.
-
I think @EastonSN+ is asking for someone to post it. Generally, a little less QPF for all locations... I wouldn't overanalyze it though. It's about time to focus on regional/meso-scale models.