MegaMike
-
Posts
576 -
Joined
-
Last visited
Content Type
Profiles
Blogs
Forums
American Weather
Media Demo
Store
Gallery
Everything posted by MegaMike
-

"Don’t do it" 2026 Blizzard obs, updates and pictures.
MegaMike replied to Ginx snewx's topic in New England
This is incredible. Pretty consistent whiteout. -
"Don’t do it" 2026 Blizzard obs, updates and pictures.
MegaMike replied to Ginx snewx's topic in New England
Haven't seen wind/snow like this since 05'. This feels like a true blizzard. Lights are flickering here too. I would like no work today (remotely), but I also need power to film a time lapse. I have two going: One in Wrenthan and one in Norton. Both should look great assuming snow doesn't coat the windows :waves fist: -
"Don’t do it" 2026 Blizzard obs, updates and pictures.
MegaMike replied to Ginx snewx's topic in New England
Must be wild to my SE. Even where I am, it's basically a whiteout. Got woken by the wind, now I probably won't be able to get back to sleep. -
Now, wind gust parameterizations perform terribly (usually overestimated), but the (edit: 18z) HRRR has gusts approaching 70mph for Norton, MA around 9am tomorrow morning.
-
I'd love a real-time mesoscale ensemble (updates every hour with ~10 members on one, unison domain)... It's a shame the RRFS isn't performing well.
-
No problem, my dewd'! At the moment, I agree that more weight should be placed on real-time analysis/mesos. I don't think global models will do well with this latent heat bomb this close to an event without being able to spin up for 12-24 hours (I know most models are initialized hot and it shouldn't matter too much)... Regardless, I wouldn't completely ignore their trends either. My weights (as Dendrite said, our opinions vary): 60% mesos. 20% regionals 10% globals
-
For the record, the Thompson microphysics scheme is currently widely used in research (WRF). The RAP + HRRR have it. I don't think this would matter too much unless a scheme diagnosis only a few moments (ie... just snow and liquid water). For funzies: https://www2.mmm.ucar.edu/wrf/users/wrf_users_guide/build/html/physics.html
-
It'd be a combination of things, but at 3km, the microphysics scheme is the most important. No need for convective parameterization since the resolution will resolve it explicitly. The NAM uses the 'Ferrier-Aligo' which is pretty old (2001), but that's just part of the story. It's performance w/forcing is important too... Looking real quick, it overpredicts specific humidity below 850mb (+ bias). I think that's probably a bigger culprit. I'm sure there are some articles about this somewhere. You'd really need to do a thorough investigation.
-
I've been looking at the evaluation webpage again. This time, for precipitation (at fcst 24hr for 12z cycles) thresholds. Anywho, for frequency bias, an ideal prediction is 1.0. Negative values indicates underprediction (doesn't predict the occurrence as much as it should), and + values indicate overprediction (predicts the occurrence too often). Note: The NAM 3km consistency overpredicts for all thresholds and is outperformed by the other mesos. For equitable threat score (removes outliers), an ideal prediction is 1.0 (0.0 indicating no skill). Based on this metric, HRRR performs best for all thresholds over the past 90 days: Seeing some of the globals trend unfavorably will only bother me if the mesos follow.
-
It composes of the current (no lag like the NBM) cycles of the HRRR, WRF-NSSL, WRF-ARW, FV3, and NAM 3km models (00z cycles)... So only the high-resolution stuff.

.thumb.png.ef711a7ce6b8dc64b26dc5b71329cad9.png)
-
00z HREF. Sum the two to get your total:
-
Likely the SREFs, but the NBM consists of 80+ different, individual ensemble members. I'm going off memory here, but it includes 10 SREF, 30 GEFS, 50 EPS, 3kmNAM, GFS, RAP, the high-res ARW models, and maybe 1 or two different (experimental) diagnostic models. The models incorporated into the NBM are lagged by a couple cycles too so it's not ingesting the most recent simulations. Honestly, I get why people get so confused with it.
-
Ensembles are usually more truncated (courser, less dz layers, greater time step), but a model (NAM, GFS, etc...) is just a name given to a set of model configurations. The core (dictates how the atmosphere acts) is one aspect of multiple modeling options/schemes. Here's a table of some NCEP modeling configurations: https://www.emc.ncep.noaa.gov/users/meg/home/table.html
-
That's interesting. Would you oppose retiring the SREF? Looking at the evaluation webpage, the GEFS currently outperforms the SREF.
-
I hate to call any model useless, but if my name was 'Big Balls' and I worked at DOGE, I'd probably get rid of the SREF (and maybe the CFS in favor of AI). It's consistently overamped during costal storms and I never use it either. It's configuration isn't ideal for severe weather/convection too (16km dxdy/only 40 vertical levels). The one + about it, the individual members are very diversified. Some fun combinations of schemes which promotes a huge model spread (ideal for an ensemble!)... It'd be replaced by the RRFS though. It's quite fun to work with! Unfortunately, I do think WRF will be replaced by something like the MPAS. In terms of efficiency, the MPAS is better (takes less resources to run)... No need to feed bcs onto 3 different grids. It's the future and we're already experiencing it (FV3 core; ignoring AI). Generally, we're told not to configure modeling systems with a resolution ~12km. It's a gray zone for convective parameterization... Too fine for parameterization, but too course to explicitly predict it. We need NAM 12km to feed NAM 3km bcs. It's a sacrificial lamb. <4km should do fine with convection.
-
lol I get it. Yea, I remember another meteorologist mentioning that they didn't like the WRF-NMM/ARW models. I've worked with them for a decade, so I guess I'm a bit biased. I think @vortex95 works with the MPAS(?) so I wonder what his thoughts are regarding the WRF models. The RSM must be before my time. I'm not familiar with it
-
The table comes from NCEP. I just formatted them differently so I can sort the weights. My opinions: They need a modeling system to encompass the entire country, so the HRDPS wouldn't be applicable. I think the ECMWF is included as one of the 50 EPS members. (a) Too soon for the AI models as they recently became operational. (b) I'm guessing they didn't include the RGEM because of a licensing/boundary issue (cells close the boundaries can produce wacky results). (c) The ECMWF outperform the UKMET so no need to include it. (a+b+c) More importantly, everything must be post-processed onto a constant grid - it's not worth including a single diagnostic model when the ensemble itself already composes of 80 members. You'd just be complicating things with little in return if you include modeling systems with different dxdy configurations.
-
For 20-42hrs? I agree that they can get pretty erratic past one daytime cycle and I've mentioned that before. It's a weird gray zone for modeling (24-48hrs), but I'm sure NCEP created those weights with solid reasoning/evidence/support.
-
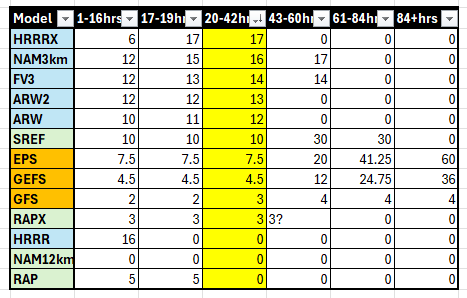
Mesos should definitely be weighted more as you get closer to an event... Small scale features impacts sensible weather and courser models cannot resolve them/assimilate them well. A lot of members repeat this tidbit each storm, but the s need their dopamine fix. Here's how NCEP weighs the models for the NBM (snowfall specifically because I'm obsessed with it). Regardless, the weights won't vary much by variable. Since we're ~20-42hrs away from the event, I sorted that column by importance (values are in %). Note: The top 5 model weights are all mesoscale modeling systems and the GFS (diagnostic) is only weighted by 3%.
-
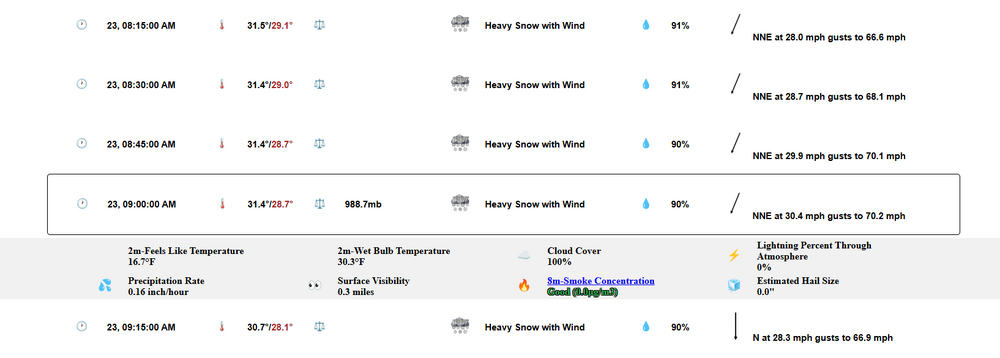
I could see him going to either Providence, Boston, central NJ, or somewhere along the Cape. I bet they announce the location later tonight. 18z HRRR gives Hartford higher percentages of lightning than Providence... 3-6% from 12am-3am on Monday. NYC too at 3-7% from 11pm-2am Sunday-Monday.
-
So impressive! The 18z HRRR has a 3-5% chance of lightning (throughout the entire atmosphere) for Providence from 12am-3am on Monday.
-
Shameless bump. I ran an analysis simulation w/WRF for the 78' blizzard that evaluated well
-
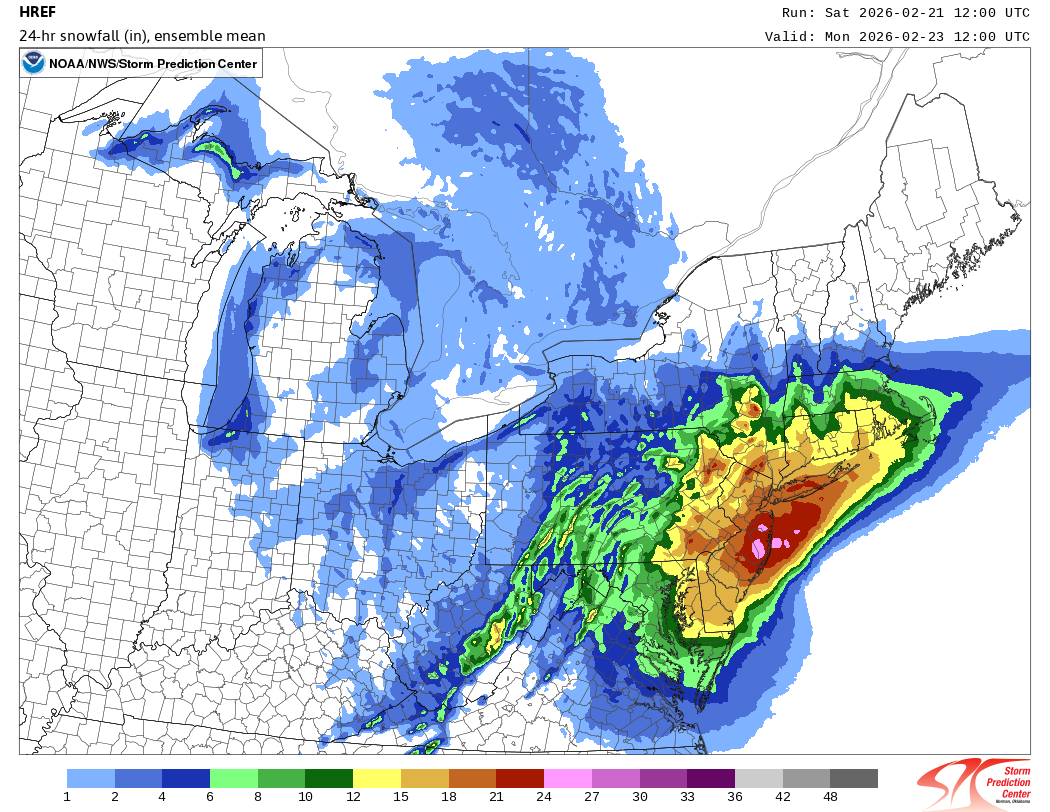
HREF and NBM be honking. Still not completely in range of the HREF though (still snowing):

-
If I had to take a wild guess, the SREFs are likely beefing up the mean.
-
It's so hawt' I can barely contain myself, Tippy!


.png.124f821fc887cef02615abafde16bb69.png)