donsutherland1
-
Posts
24,182 -
Joined
Content Type
Profiles
Blogs
Forums
American Weather
Media Demo
Store
Gallery
Everything posted by donsutherland1
-
Congratulations. I hope all goes well.
-
A warming trend has gotten underway. The warmth will continue to build through the remainder of June before culminating in a severe heatwave to start July. Some of the guidance suggests that the heat could rival that of early July 1966. Much of the region will likely experience its highest temperatures so far this summer. Baltimore, Newark, Philadelphia, and Washington, DC will all likely see the temperatures peak at or above 100°. Washington, DC could make a run at its all-time record of 106°. The ENSO Region 1+2 anomaly was +3.0°C and the Region 3.4 anomaly was +1.7°C for the week centered around June 17. For the past six weeks, the ENSO Region 1+2 anomaly has averaged +2.42°C and the ENSO Region 3.4 anomaly has averaged +1.22°C. The ongoing El Niño will continue to strengthen through the summer. The SOI was -11.81 today. The preliminary Arctic Oscillation (AO) was +1.126 today. Based on sensitivity analysis applied to the latest guidance, there is an implied near 100% probability that New York City will have a warmer than normal June (1991-2020 normal). June will likely finish with a mean temperature near 73.2 (1.2° above normal). Supplemental Information: The projected mean would be 1.8° above the 1981-2010 normal monthly value.
-
Occasional Thoughts on Climate Change
donsutherland1 replied to donsutherland1's topic in Climate Change
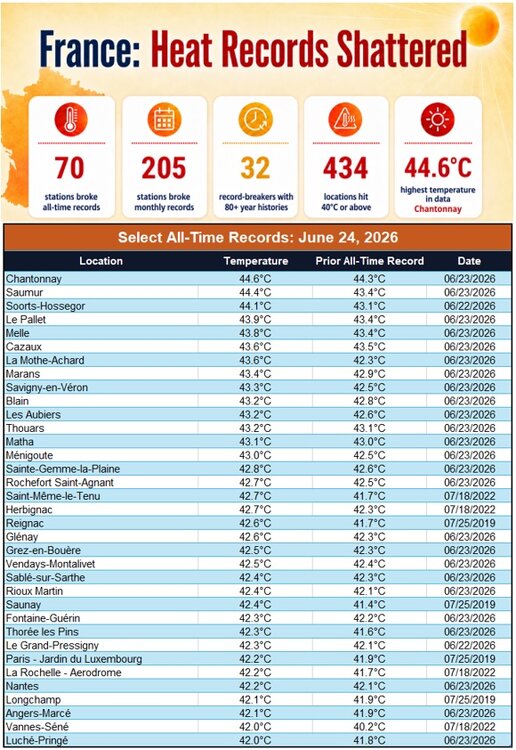
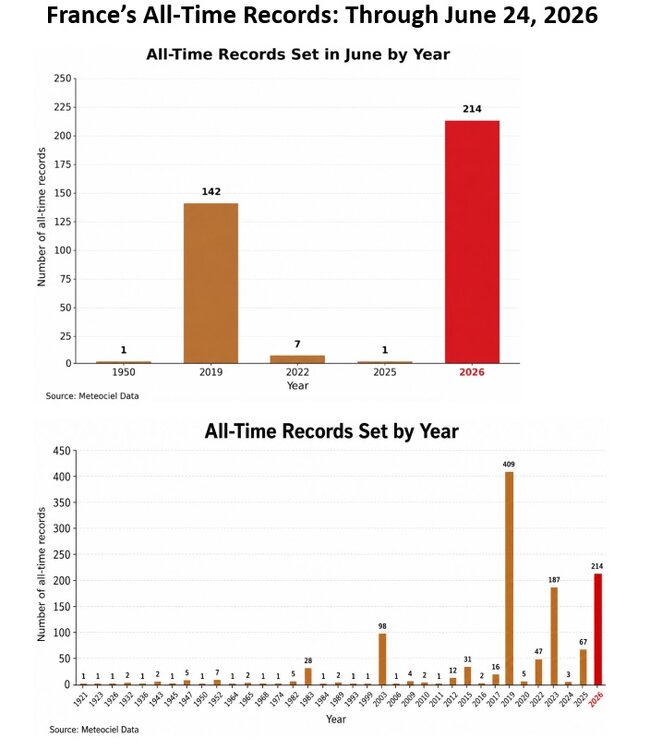
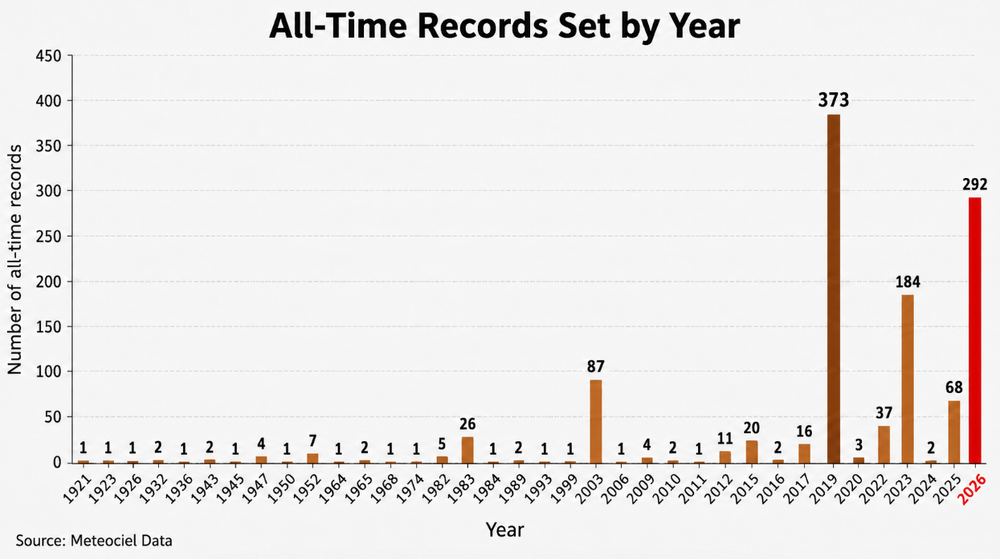
The historic June 2026 heatwave finally began to release its grip on France. Nevertheless, a few locations set monthly and all-time records. Germany (41.7C) and Czechia (41.9C) also set all-time heat records. As a result of the heatwave, June 2026 accounts for the most all-time records for the month of June and 2026 accounts for the second most all-time records for any calendar year. The clustering of all-time records in recent years is consistent with a warming climate from fossil fuel-driven anthropogenic climate change.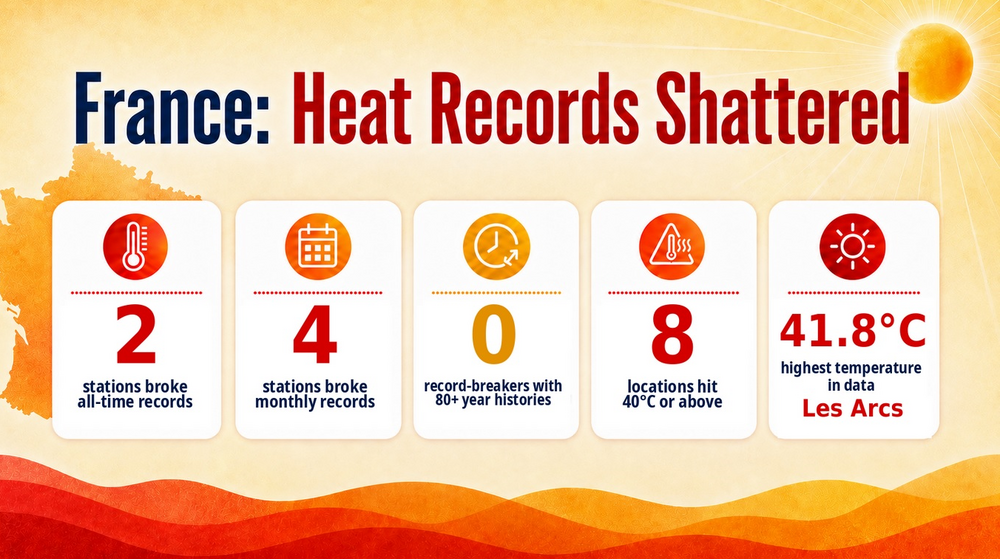
-
With the temperature rising into the lower 80s, it was a great day to see some summer scenes at the New York Botanical Garden.


-
For reference:

-
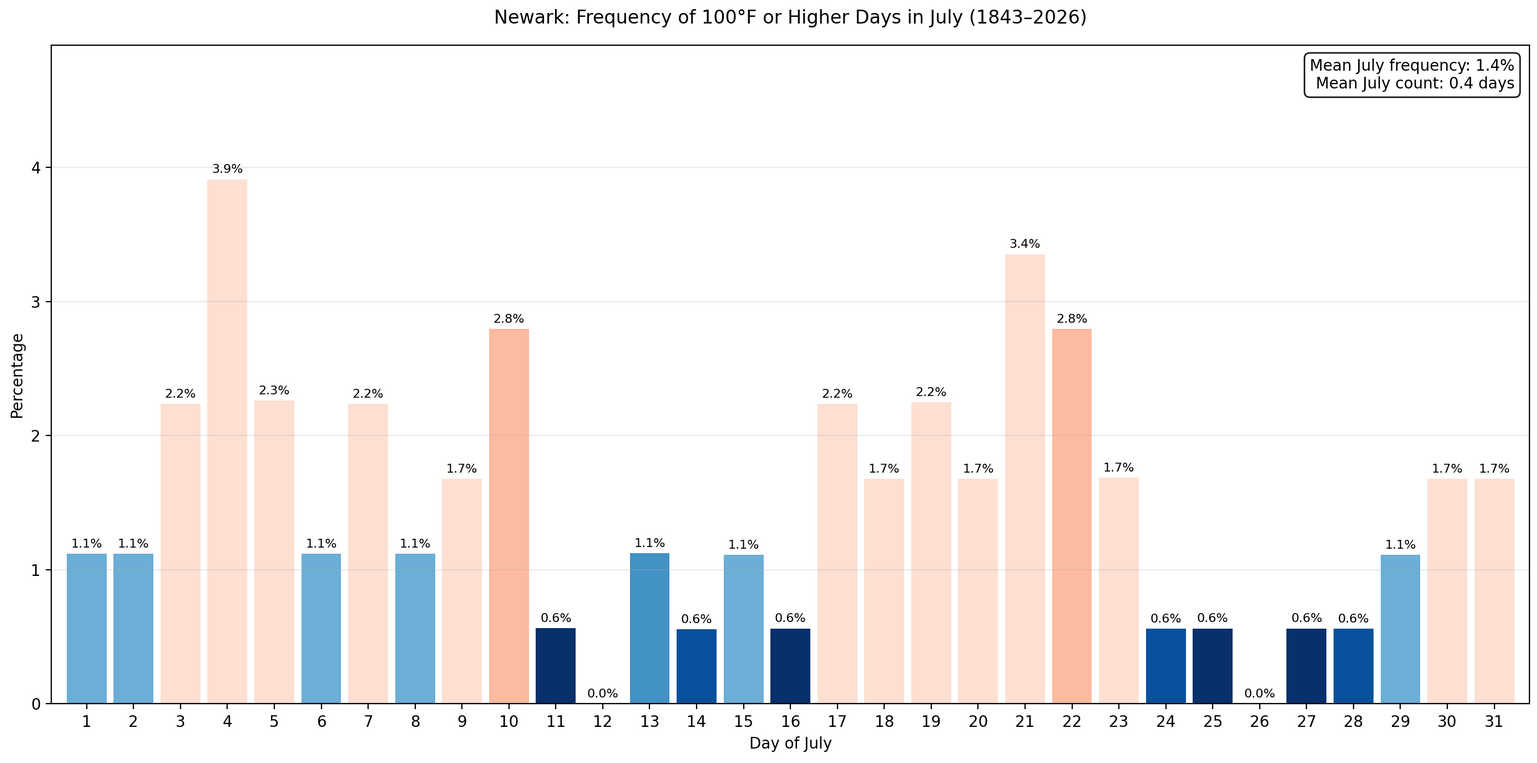
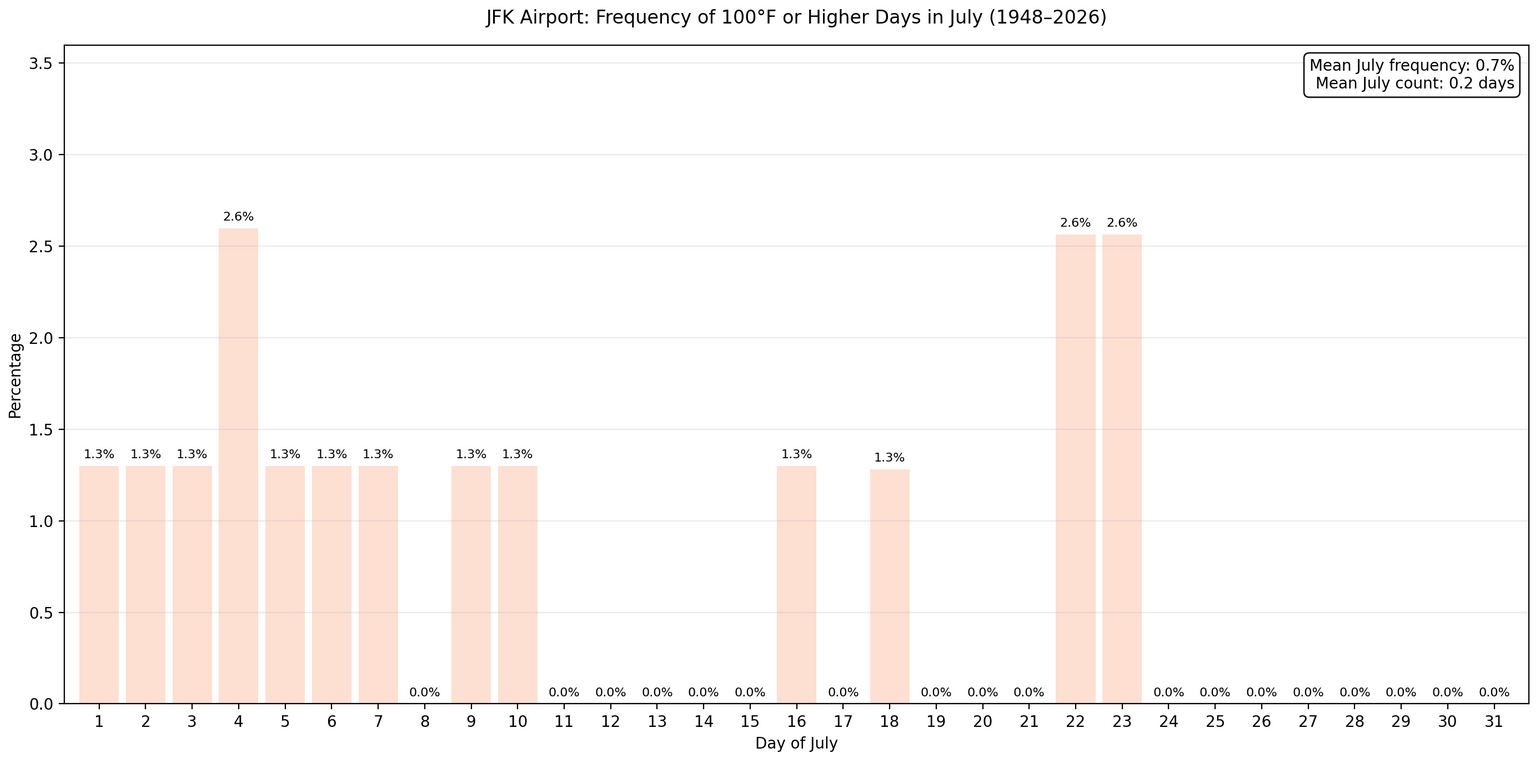
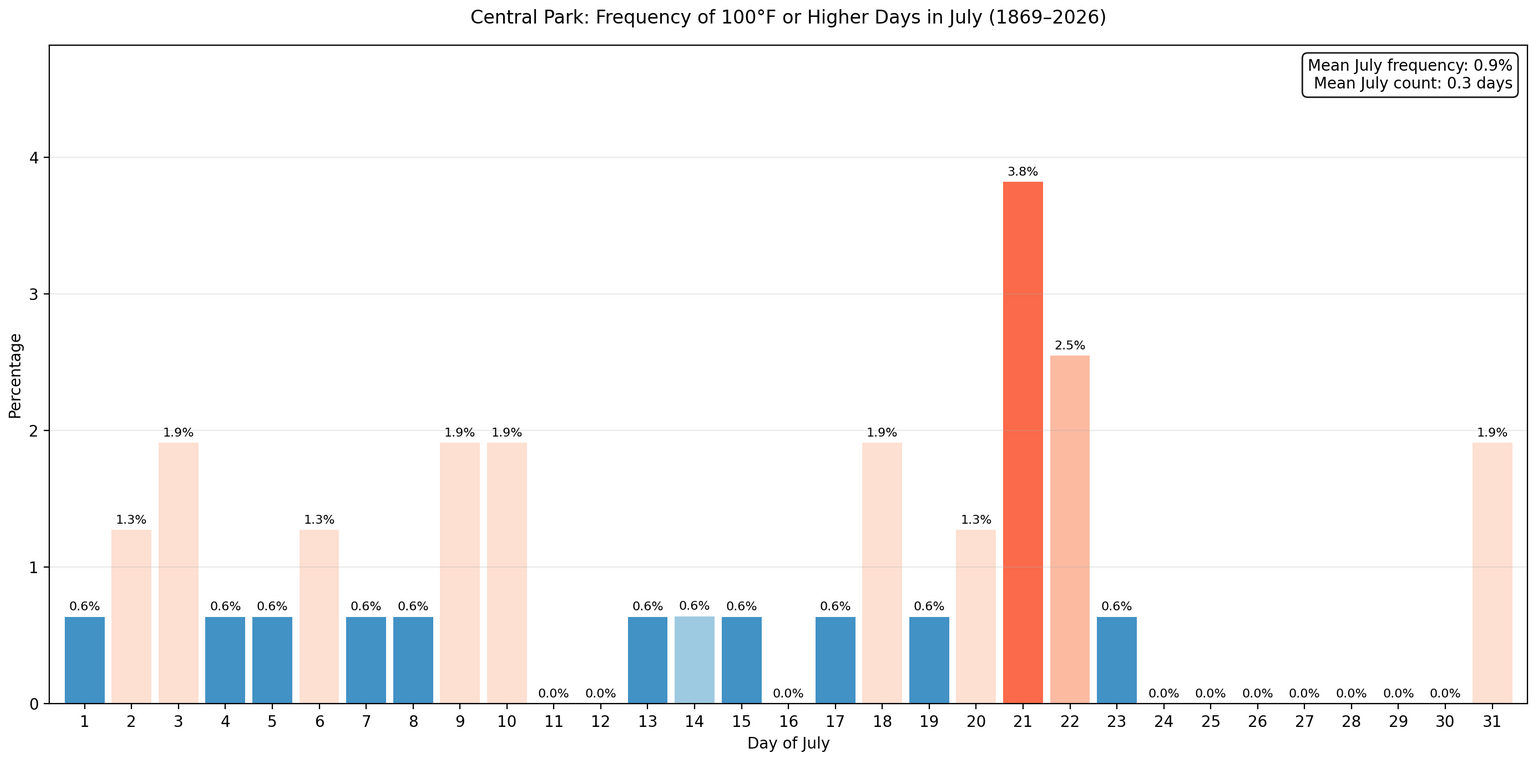
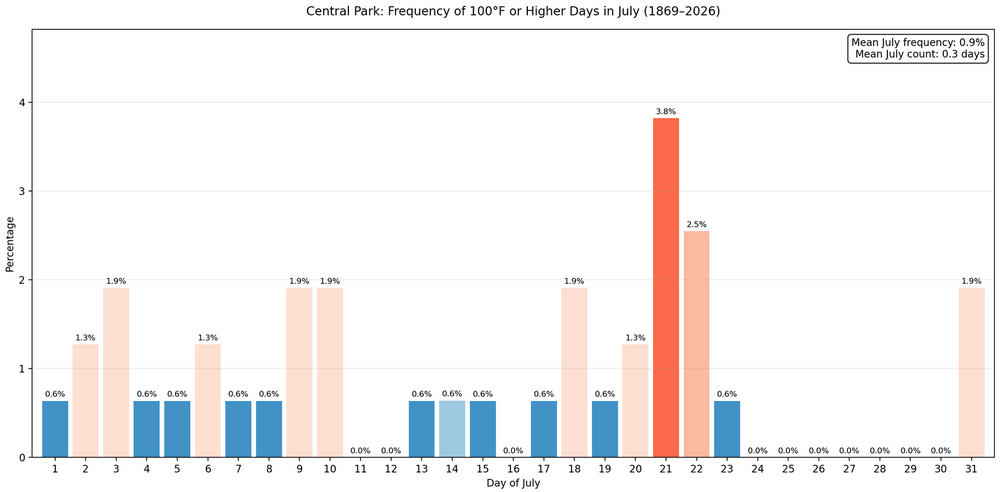
It's probably overdone, but Central Park might make a run for 100 on at least one day. I think ISP, JFK, LGA, EWR will probably have one or more such days.
-
July 4th thread. Its numbers are unreal for NYC.
-
A warming trend will commence tomorrow. June will conclude with above normal temperatures. The guidance is increasingly suggesting the potential for extreme heat to open July. Some of the guidance suggests that the heat could rival that of early July 1966. Much of the region will likely experience its highest temperatures so far this summer. Baltimore, Newark, Philadelphia, and Washington, DC will all likely see the temperatures peak at or above 100°. Washington, DC could make a run at its all-time record of 106°. The ENSO Region 1+2 anomaly was +3.0°C and the Region 3.4 anomaly was +1.7°C for the week centered around June 17. For the past six weeks, the ENSO Region 1+2 anomaly has averaged +2.42°C and the ENSO Region 3.4 anomaly has averaged +1.22°C. The ongoing El Niño will continue to strengthen through the summer. The SOI was -19.61 today. The preliminary Arctic Oscillation (AO) was +1.016 today. Based on sensitivity analysis applied to the latest guidance, there is an implied near 99% probability that New York City will have a warmer than normal June (1991-2020 normal). June will likely finish with a mean temperature near 73.3 (1.3° above normal). Supplemental Information: The projected mean would be 1.9° above the 1981-2010 normal monthly value.
-
Occasional Thoughts on Climate Change
donsutherland1 replied to donsutherland1's topic in Climate Change
It’s a metaphor, not literal description. -
Occasional Thoughts on Climate Change
donsutherland1 replied to donsutherland1's topic in Climate Change
June 2026 in France and much of Europe isn't merely "hot." Hot is a beach day, lemonade, and open windows. This is different. Stoked by rising atmospheric greenhouse gases, the air is seemingly breathing fire in one's face. The shade is failing to offer much relief. Today, France saw additional all-time records. The Czech Republic, Denmark, and Germany set all-time national records.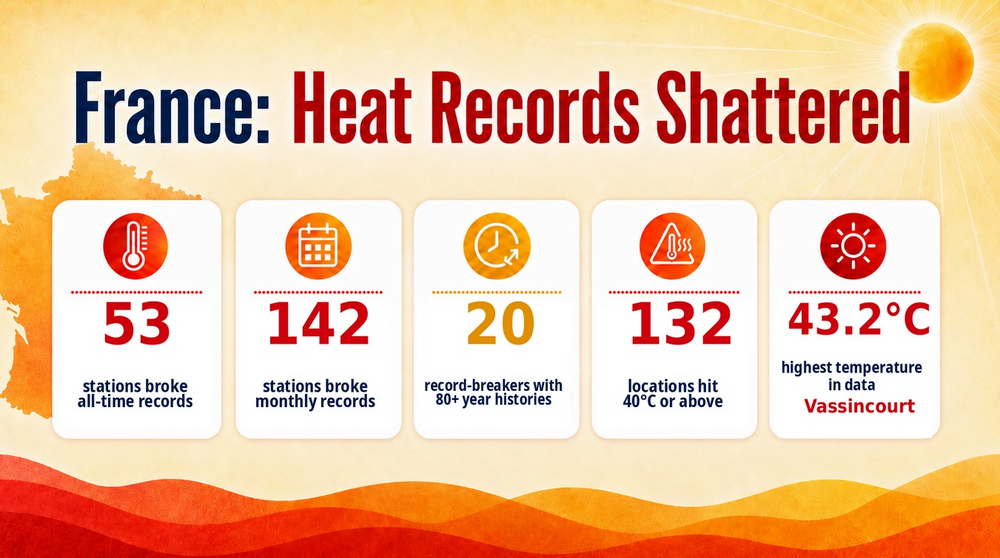
-
2026-2027 Super El Nino
donsutherland1 replied to Stormchaserchuck1's topic in Weather Forecasting and Discussion
The strong and strengthening PMM+ is noteworthy. It will likely have an influence on the upcoming seasons. -
Occasional Thoughts on Climate Change
donsutherland1 replied to donsutherland1's topic in Climate Change
On that, I also agree. Summer 2026 is becoming much like Summer 2019 with wave after wave of intense heat in Europe. -
Occasional Thoughts on Climate Change
donsutherland1 replied to donsutherland1's topic in Climate Change
The forecast heat dome is looking more and more impressive. The NBM shows a peak of 105° +/- 5° at Washington, DC. The all-time mark is 106°. This situation will merit watching. -
It will be mainly cloudy tomorrow. Some showers are possible tonight into tomorrow. A warming trend could commence on Sunday. The guidance increasingly suggests that hot weather could return to conclude June and start July. Some of the guidance suggests that the region could see its highest temperatures so far this summer during the middle of next week. Baltimore, Newark, Philadelphia, and Washington, DC will all likely see the temperatures peak at or above 100°. The ENSO Region 1+2 anomaly was +3.0°C and the Region 3.4 anomaly was +1.7°C for the week centered around June 17. For the past six weeks, the ENSO Region 1+2 anomaly has averaged +2.42°C and the ENSO Region 3.4 anomaly has averaged +1.22°C. The ongoing El Niño will continue to strengthen through the summer. The SOI was -13.92 yesterday. The preliminary Arctic Oscillation (AO) was +0.710 today. Based on sensitivity analysis applied to the latest guidance, there is an implied near 97% probability that New York City will have a warmer than normal June (1991-2020 normal). June will likely finish with a mean temperature near 73.4 (1.4° above normal). Supplemental Information: The projected mean would be 2.0° above the 1981-2010 normal monthly value.
-
Occasional Thoughts on Climate Change
donsutherland1 replied to donsutherland1's topic in Climate Change
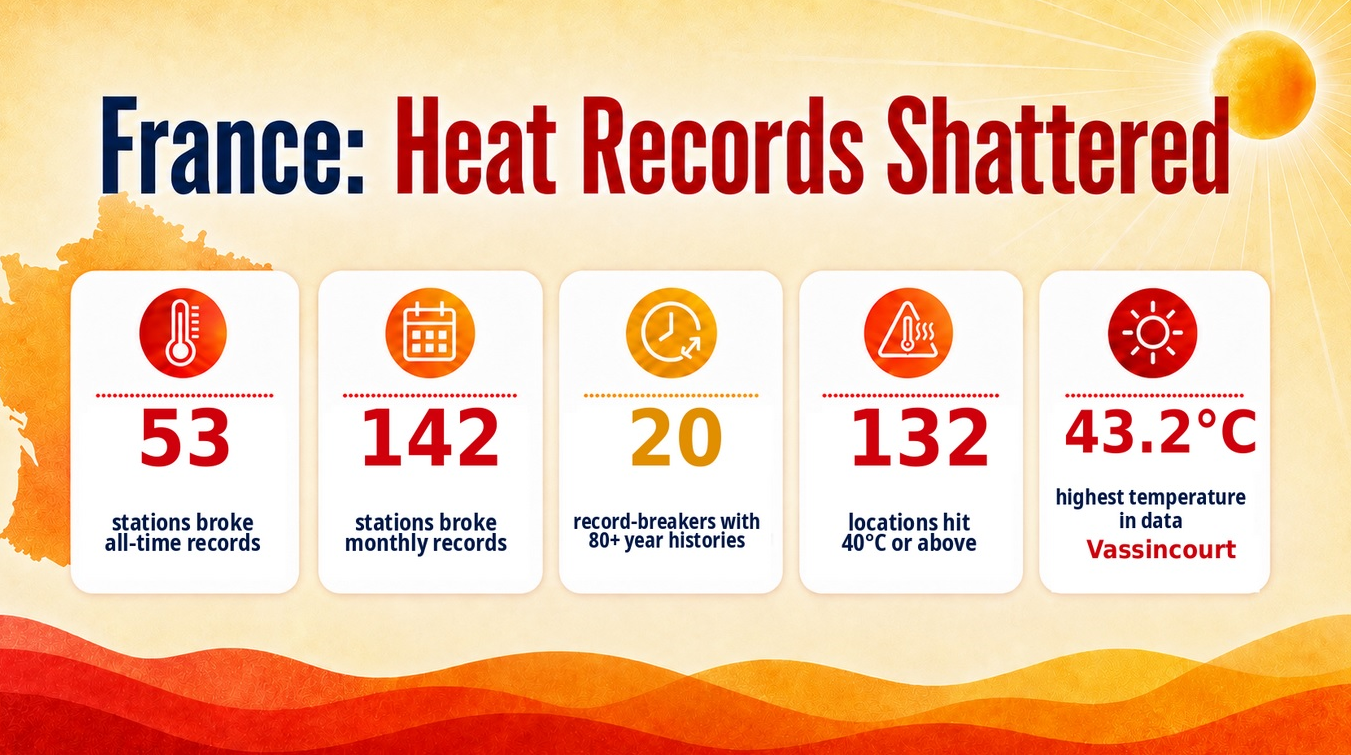
Today was another day of crushing inescapable heat in much of Europe. Saarbrücken, Germany (41.3C/106.3F) and Basel, Switzerland (38.8C/101.8F) set new national all-time heat records. Locations in France also set additional all-time records. Santon Downham (37.3C/99.1F) set a national UK June record.
-
Occasional Thoughts on Climate Change
donsutherland1 replied to donsutherland1's topic in Climate Change
Excerpts from World Weather Attribution concerning Europe's record-breaking June heatwave: Fossil fuel emissions have rapidly worsened European heatwaves in just a few decades Over the region studied this heatwave is the most severe ever recorded. In 1976, when some of the previous European records were set, the 2026 temperatures would have been virtually impossible to occur in June, while also highly unlikely at any time of the year. In 2003, the first major heatwave of this century, daytime heat like this would still have been very rare, about 10 times less likely than today, while nighttime temperatures such as this June would have been more than a hundred times less likely in 2003. Across large parts of Western Europe, June is warming faster than any other month. In addition, daily maximum temperatures are warming faster than night time temperatures, though both are warming much faster than global warming. The hottest daily temperatures are warming at about triple the rate of global warming and night time temperatures at about twice the rate. Many capital cities are experiencing not only their hottest June 3-day period but also the hottest three-day period since 1950, according to the ERA5 dataset. However, due to global warming, these very high temperatures are now expected regularly during the summer months in many capitals. This means that a similar heatwave in June would have been about 3.5°C cooler during the day in 1976 and about 2°C cooler in 2003. The nighttime temperatures would have been about 2.4°C cooler in June 1976 and about 1.3°C cooler in June 2003. This June 2026 heatwave occurred under a circulation pattern broadly similar to historical analogues – Southerly Flow. However, a similar circulation pattern now produces significantly hotter temperatures than it did in the mid-20th century because the climate baseline has warmed... This summer shows that at 1.4°C of global warming, extreme heat is already reaching the limits of our societies’ ability to cope. Our analysis here shows that intense heat is increasing rapidly even in living memory, with such events tens to hundreds of times more likely since only 2003 and virtually impossible just 50 years ago. A rapid phase-out of fossil fuels is critical if we are to avoid even higher temperatures and their consequences in the future. https://www.worldweatherattribution.org/fossil-fuel-emissions-have-rapidly-worsened-european-heatwaves-in-just-a-few-decades/ -
A shower or thundershower is possible tonight into early tomorrow. Afterward, tomorrow will be pleasantly warm with highs in the lower to perhaps middle 80s. Some showers are possible tomorrow night and then again Friday night or Saturday. A warming trend could commence on Sunday. The guidance increasingly suggests that hot weather could return to conclude June and start July. The ENSO Region 1+2 anomaly was +3.0°C and the Region 3.4 anomaly was +1.7°C for the week centered around June 17. For the past six weeks, the ENSO Region 1+2 anomaly has averaged +2.42°C and the ENSO Region 3.4 anomaly has averaged +1.22°C. The ongoing El Niño will continue to strengthen through the summer. The SOI was -18.28 yesterday. The preliminary Arctic Oscillation (AO) was +0.424 today. Based on sensitivity analysis applied to the latest guidance, there is an implied near 94% probability that New York City will have a warmer than normal June (1991-2020 normal). June will likely finish with a mean temperature near 73.4 (1.4° above normal). Supplemental Information: The projected mean would be 2.0° above the 1981-2010 normal monthly value.
-
Occasional Thoughts on Climate Change
donsutherland1 replied to donsutherland1's topic in Climate Change
Today was another day of furnace-like heat in France, Jersey, and the UK. The extreme heat will shift eastward over the next few days.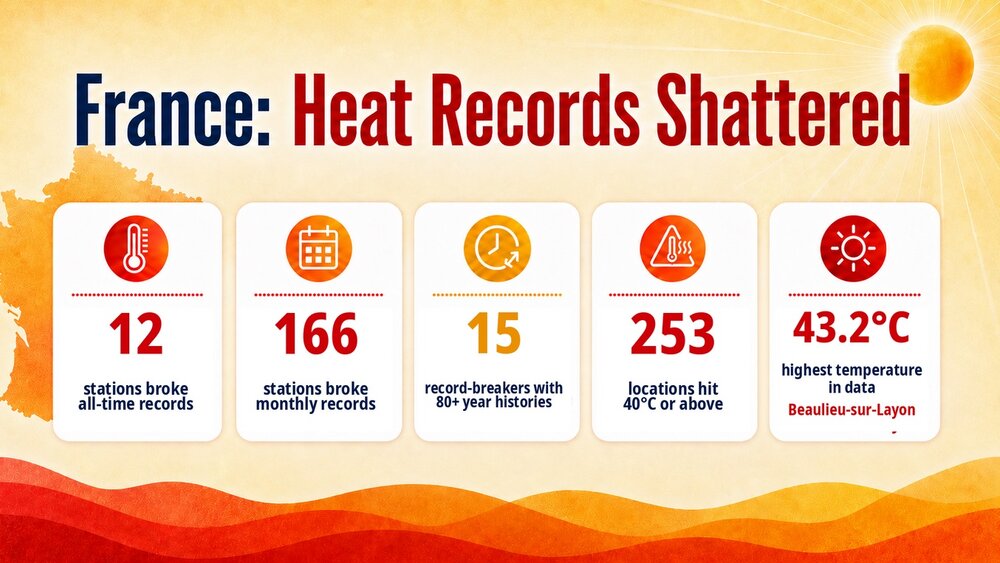
-
Occasional Thoughts on Climate Change
donsutherland1 replied to donsutherland1's topic in Climate Change
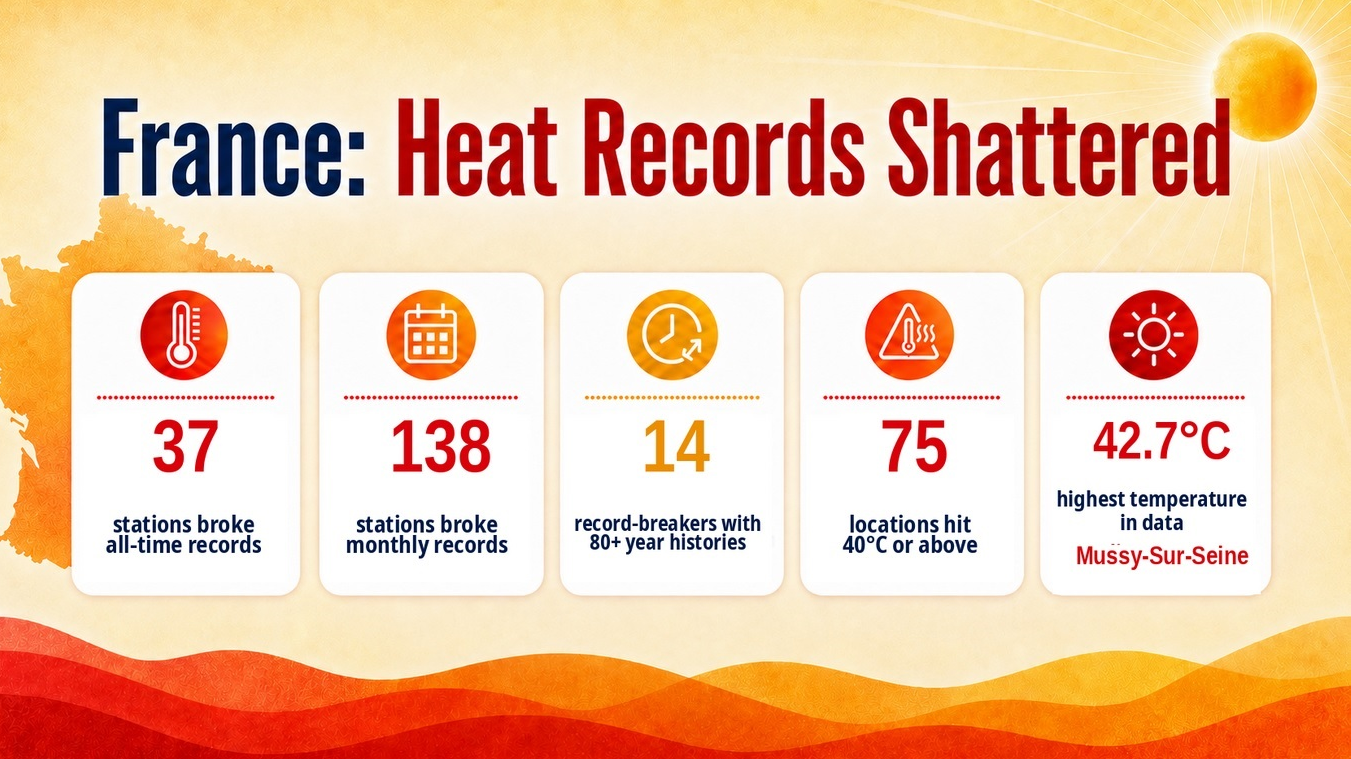
The Paris-Montouris station, for which records go back to 1872, has recorded its first case of two consecutive 40°C (104°F) or above days. Paris-Jardin du Luxembourg topped out at 41.2°C (106.2°F). Jersey (Maison St. Louis: 39.3°C/102.7°F) and Switzerland (Basel: 38.0°C/100.4°F) set national all-time records. The UK (Merrifield: 36.7°C/98.1F) set a national June monthly record. -
Occasional Thoughts on Climate Change
donsutherland1 replied to donsutherland1's topic in Climate Change
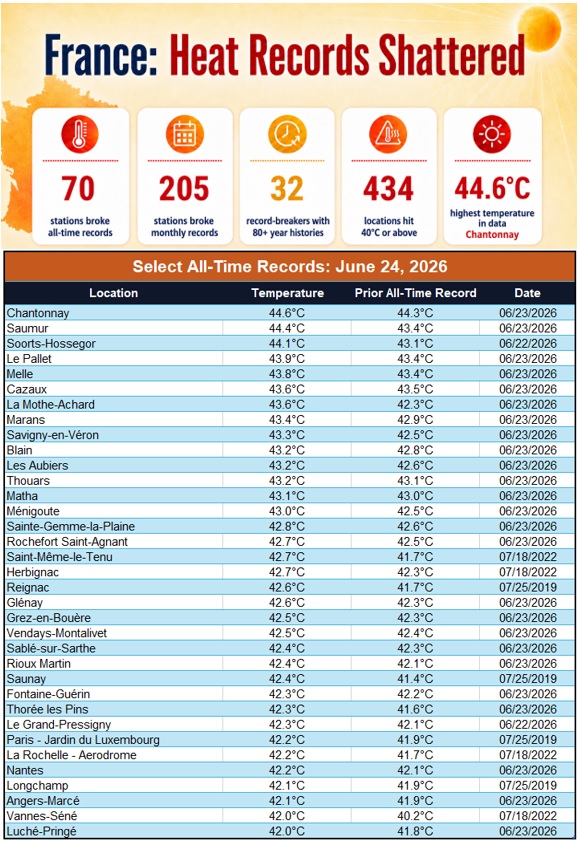
The official announcement from Météo-France: Translation: June 24, 2026 France has just experienced its hottest day ever recorded. Across the country, the average temperature over 24 hours reached 30°C, exceeding the 29.9°C measured... the day before, which was already the hottest day ever recorded since measurements began in 1947.
-
Occasional Thoughts on Climate Change
donsutherland1 replied to donsutherland1's topic in Climate Change
It showed up on the list of all-time records, so I noted it. -
Tomorrow and Friday will be pleasantly warm days with highs in the lower 80s. Some showers are possible tomorrow night and then again Friday night or Saturday. A warming trend could commence during or after the next weekend. Some of the guidance suggests that hot weather could return to conclude June. The ENSO Region 1+2 anomaly was +3.0°C and the Region 3.4 anomaly was +1.7°C for the week centered around June 17. For the past six weeks, the ENSO Region 1+2 anomaly has averaged +2.42°C and the ENSO Region 3.4 anomaly has averaged +1.22°C. The ongoing El Niño will continue to strengthen through the summer. The SOI was -22.92 yesterday. The preliminary Arctic Oscillation (AO) was +0.406 today. Based on sensitivity analysis applied to the latest guidance, there is an implied near 91% probability that New York City will have a warmer than normal June (1991-2020 normal). June will likely finish with a mean temperature near 73.5 (1.5° above normal). Supplemental Information: The projected mean would be 2.1° above the 1981-2010 normal monthly value.
-
Occasional Thoughts on Climate Change
donsutherland1 replied to donsutherland1's topic in Climate Change
Paris, like NYC, has multiple sites. I referenced one such site. -
Occasional Thoughts on Climate Change
donsutherland1 replied to donsutherland1's topic in Climate Change
I agree. Indeed, one location in coastal France beat its all-time record that was set just yesterday by 4.0C (7.2F).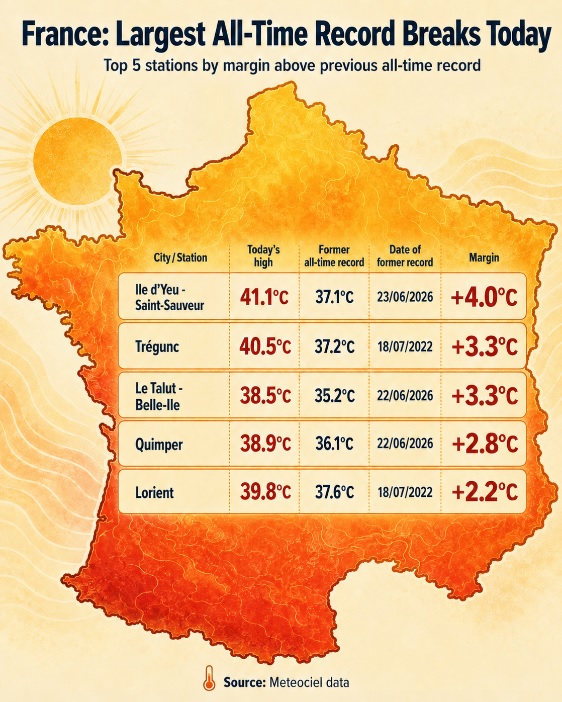
-
Occasional Thoughts on Climate Change
donsutherland1 replied to donsutherland1's topic in Climate Change
"Intense heat destroys even the temper of steel..."-George Prentice. It was that kind of day in France, Spain, and the UK today. In Paris, no relief was found under the trees of Jardin du Luxembourg as the mercury rose to 42.2C (108.0F). The UK recorded its hottest June temperature on record with a high of 36.1C (97.0F) at Gosport. As a result of the ongoing heatwave, which is France's worst June heatwave on record, 2026 already accounts for the second most all-time record high temperatures for any calendar year.