donsutherland1
-
Posts
23,825 -
Joined
Content Type
Profiles
Blogs
Forums
American Weather
Media Demo
Store
Gallery
Everything posted by donsutherland1
-
January 30th- Feb 1st ULL and coastal storm obs
donsutherland1 replied to JoshM's topic in Southeastern States
So far, Lexington, NC in Davidson County has picked up 16.0" of snow. 5 SW Thomasville, also in Davidson County, has 15.5". -
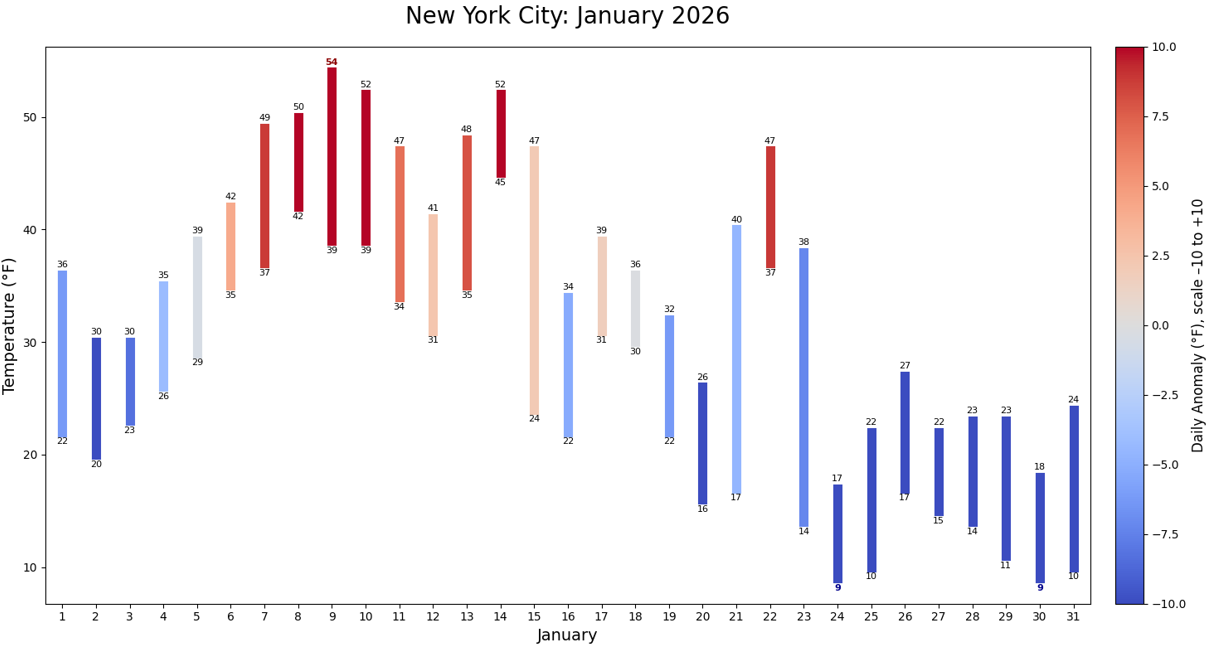
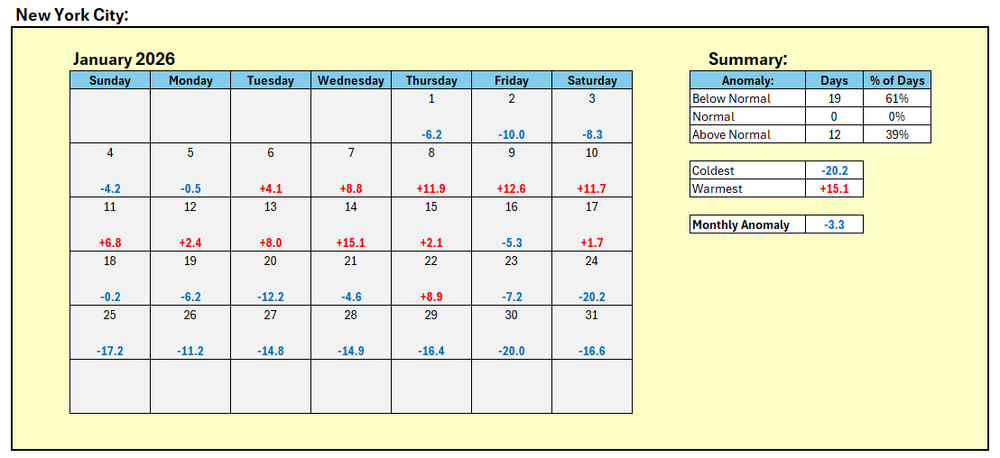
January finished with a mean temperature of 30.4° (3.3° below normal) in New York City's Central Park.

-
February 2026 OBS & Discussion
donsutherland1 replied to Stormlover74's topic in New York City Metro
Today is NYC's 8th consecutive subfreezing day. -
There should certainly be opportunities.
-
It's fading and will continue to fade during February. There will likely be above normal tornado activity during March-May.
-
January 30th- Feb 1st ULL and coastal storm obs
donsutherland1 replied to JoshM's topic in Southeastern States
8" or Above Snowfall Amounts: Location State Amount Source 5 NNE Faust NC 14.5 Public 1 SW Kannapolis NC 12.5 Trained Spotter Rockwell NC 12.0 Public Faith NC 12.0 Public 6 ENE Huntersville NC 12.0 Public China Grove NC 11.5 Fire Dept/Rescue Sylva NC 11.0 Public 4 NNW Craven NC 11.0 Public 1 W Concord NC 11.0 Public 5 W Salisbury NC 10.0 Trained Spotter 3 WNW Sunburst NC 10.0 Public 2 NNE Sylva NC 10.0 Public 2 E Kannapolis NC 10.0 Public 1 E Concord NC 10.0 CO-OP Observer 4 E Huntersville NC 9.5 Public 2 W Paw Creek NC 9.5 Public 1 ENE Mooresville NC 9.5 Public Tuckasegee NC 9.0 Public Salisbury NC 9.0 Public Elk Park NC 9.0 Public Davidson NC 9.0 Public Balsam NC 9.0 Public 5 NE Croft NC 9.0 Public 4 ENE Paw Creek NC 9.0 Trained Spotter 3 SSW Cherokee NC 9.0 Public 2 S Maggie Valley NC 9.0 Public 3 SSW Candler NC 8.7 Public Marshall NC 8.5 Public 3 SW Kannapolis NC 8.3 Public 3 WSW Woodfin NC 8.2 Public 3 NW Mooresville NC 8.2 Public Troutman NC 8.0 Public Marion NC 8.0 Public Maiden NC 8.0 Fire Dept/Rescue Clyde NC 8.0 Public Bryson City NC 8.0 Public Boiling Springs Nc NC 8.0 Public Belmont NC 8.0 Public 4 NNE Maggie Valley NC 8.0 Public 4 N Eastanolee GA 8.0 Public 3 NNE Cullowhee NC 8.0 Public 2 WNW High Shoals NC 8.0 Trained Spotter 2 WNW Concord NC 8.0 Public 2 WNW Balsam NC 8.0 Public 2 ESE Sunburst NC 8.0 Public 1 WNW Clayton GA 8.0 Broadcast Media 1 W Broad Creek NC 8.0 Public 1 SW Newport NC 8.0 NWS Employee 1 ESE Mount Holly NC 8.0 Public -
January 30th- Feb 1st ULL and coastal storm obs
donsutherland1 replied to JoshM's topic in Southeastern States
Yes. It could be a top 5 or bigger snowstorm. -
January 30th- Feb 1st ULL and coastal storm obs
donsutherland1 replied to JoshM's topic in Southeastern States
As of 4 pm, Charlotte, NC has picked up 6.1" of snow. That breaks the daily record for January 31 of 0.9" from 1948. That makes the current storm Charlotte's biggest since February 11-13, 2014 when 8.4" fell. Charlotte could see its first 10" or above snowstorm since February 26-27, 2004. The daily snowfall of 6.1" is Charlotte's biggest daily snowfall since February 26, 2004 when 11.6" accumulated. The snow continues to fall heavily as of 5:15 pm. -
January is concluding with a monthly mean temperature of 30.4° (3.3° below the 1991-2020 baseline and 2.2° below the 1981-2010 baseline). January 2026 is the coldest month since January 2022 when the monthly average temperature was 30.3°. The January 24-31 period has had a mean temperature of 16.9°. That is the coldest eight-day period since December 31, 2017-January 7, 2018 when the eight-day average temperature was 16.4°. Temperatures should begin to moderate tomorrow into early next week and could briefly rise to or above freezing. Nevertheless, readings are likely to remain below normal into at least next weekend. Overall, January 20th-February 3rd will likely be the coldest and perhaps snowiest two-week period this winter. The forecast WPO-/EPO-/AO-/PNA+ pattern is typically the coldest pattern in January and among the coldest during the first half of February. A persistently positive PNA will have above climatological risk of moderate or significant snowfalls. For perspective, the coldest two-week period this winter prior to January 20th was January 3-16, 2026 and January 4-17, 2026 with a mean temperature of 30.3°. The snowiest two-week period was December 14-27, 2025 when 7.2" of snow fell. Already, snowfall since January 20th has surpassed that figure. The ENSO Region 1+2 anomaly was -0.3°C and the Region 3.4 anomaly was -0.7°C for the week centered around January 14. For the past six weeks, the ENSO Region 1+2 anomaly has averaged -0.48°C and the ENSO Region 3.4 anomaly has averaged -0.68°C. La Niña conditions will likely continue into at least late winter. The SOI was +19.18 today. The preliminary Arctic Oscillation (AO) was -2.880 today.
-
January 30th- Feb 1st ULL and coastal storm obs
donsutherland1 replied to JoshM's topic in Southeastern States
For today, my desktop is set to: -
January 30th- Feb 1st ULL and coastal storm obs
donsutherland1 replied to JoshM's topic in Southeastern States
So far, Clayton, GA has seen 6.0" of snow. Balsam, NC and 2 S Maggie Valley, NC have seen 9.0". -
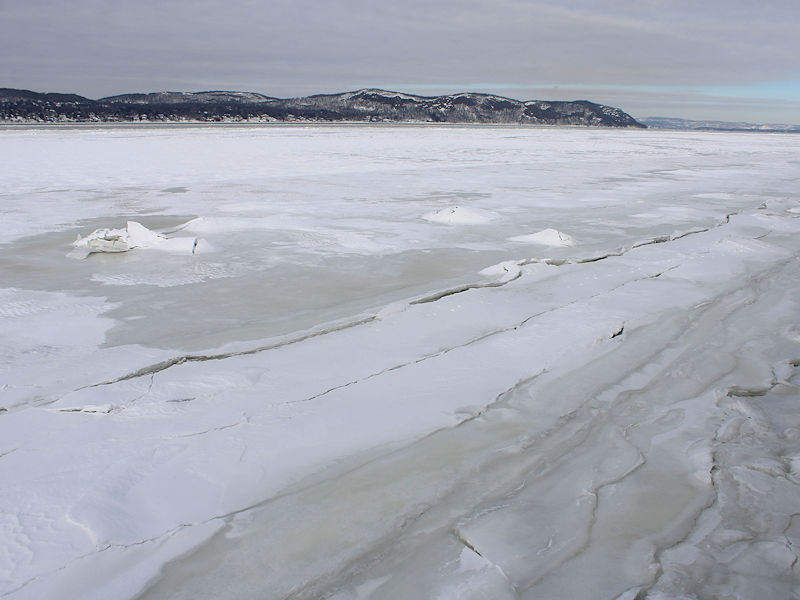
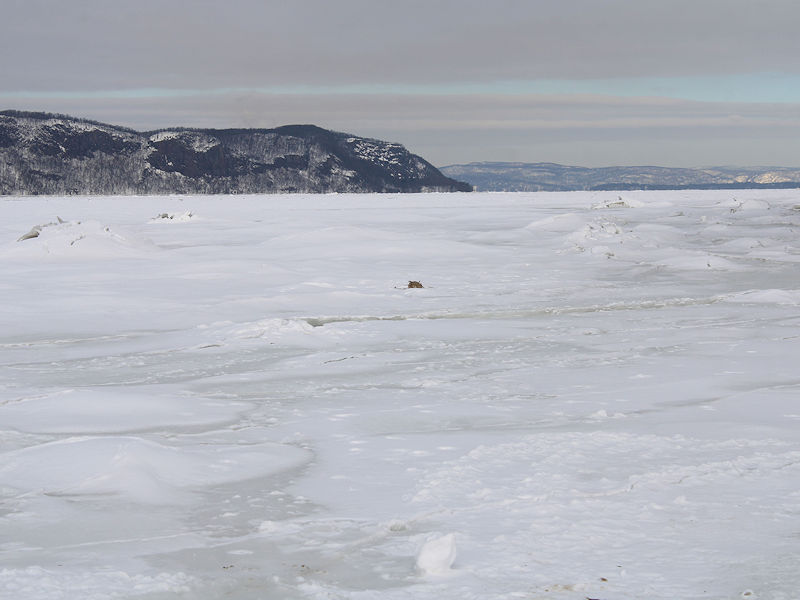
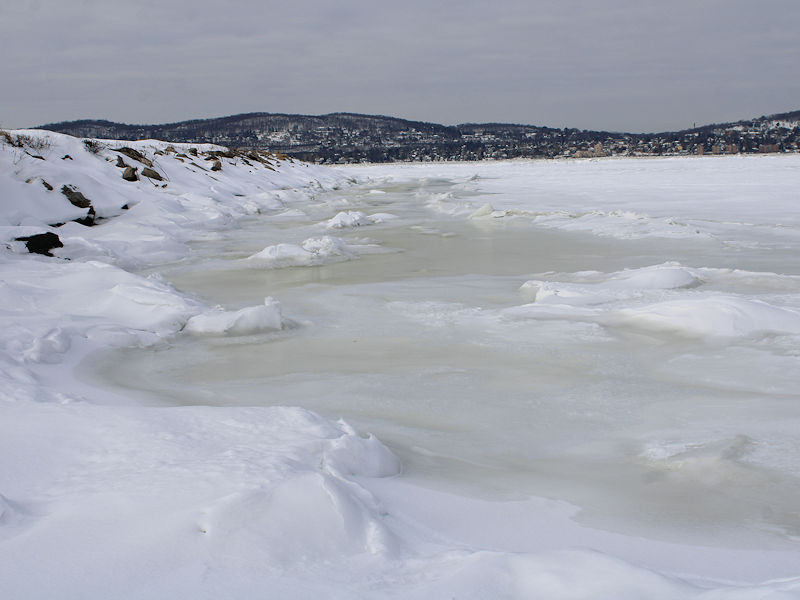
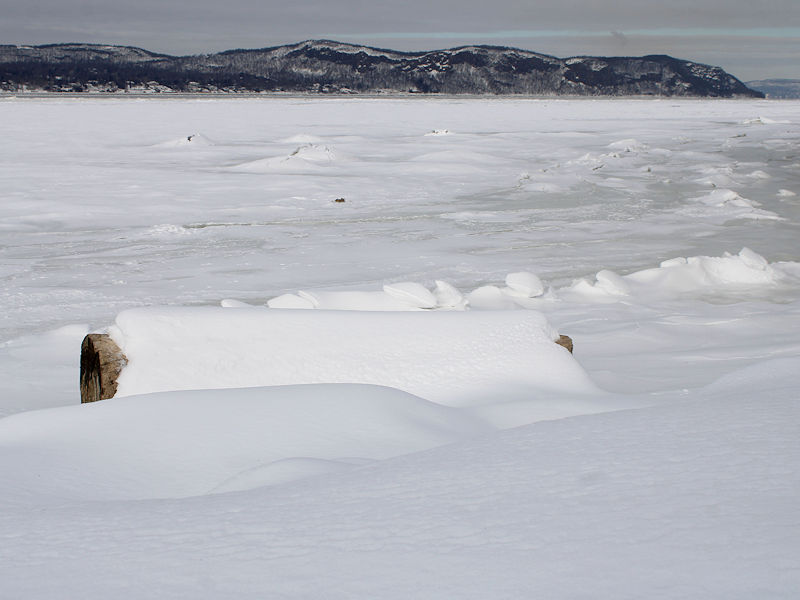
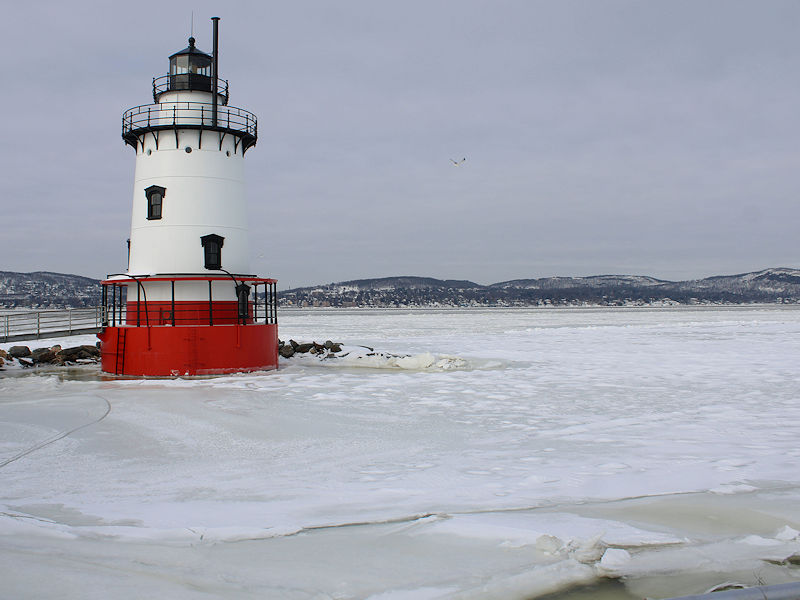
Some photos of the Hudson River from Kingsland Point Park, Sleepy Hollow, NY:
-
E PA/NJ/DE Winter 2025-26 Obs/Discussion
donsutherland1 replied to LVblizzard's topic in Philadelphia Region
Yes. I had used 1991-2020 values when I intended to use 1981-2010 values. January 2010 was 33.2, which was +0.2. The last winter with all three months being colder than normal using the 1981-2010 values was 2002-03. December: 36.8; January: 28.5; February: 29.9. Thank you. -
February: DCA _ NYC _ BOS _ ORD _ ATL _ IAH _ DEN _ PHX _ SEA -3.0 -3.3 -3.3 -0.3 -1.5 +1.8 +5.0 +3.4 +3.6
-
January 30th- Feb 1st ULL and coastal storm obs
donsutherland1 replied to JoshM's topic in Southeastern States
Some very early snowfall totals: Location State Snow Source 2 WNW Balsam NC 8.0 Public 4 NNE Maggie Valley NC 8.0 Public 5 NNE Faust NC 6.8 Public 4 NW Canton NC 6.0 Public 4 NE Alarka NC 6.0 Public 3 E Webster NC 5.0 Public 2 ENE Gay NC 5.0 Public 3 SSW Clyde NC 4.5 Public 4 SSE Gay NC 4.0 Public 2 SSW Marshall NC 4.0 Public 3 NE Skyland NC 4.0 Public Leicester NC 4.0 Public Lake Junaluska NC 4.0 Public Lenoir NC 3.5 Amateur Radio 1 SE Dillsboro NC 3.5 Public Burnsville NC 3.0 Public 1 ENE Black Mountain NC 3.0 Public 2 NNE Dana NC 3.0 Public 1 ENE Patterson NC 3.0 Public Vale NC 3.0 Public 1 S Connelly Springs NC 3.0 Public Weaverville NC 2.8 Public 3 N Salisbury NC 2.5 Public 4 SW Cherokee NC 2.5 Public 1 NE Candler NC 2.5 Other Federal 3 SSW Candler NC 2.5 Public 2 ESE Glen Alpine NC 2.5 Public Fletcher NC 2.4 Public 1 E Biltmore Forest NC 2.1 Public 1 NW Roxboro NC 2.0 Public 2 SE Woodfin NC 2.0 Trained Spotter 1 SSE Hendersonville NC 2.0 Public 1 NE Candler NC 2.0 Public 4 NNW Stecoah NC 2.0 Public Brevard NC 2.0 Public Salisbury NC 2.0 Public Travelers Rest SC 2.0 Public 2 WNW Fairview NC 2.0 Public 2 E Ledger NC 2.0 Public 2 NE Valdese NC 1.8 Public Taylorsville NC 1.5 Fire Dept/Rescue Roxboro NC 1.5 Broadcast Media 5 SSE Glen Alpine NC 1.5 Public 1 NW Kannapolis NC 1.5 Public Thomasville NC 1.5 Emergency Mngr 1 SSW Welcome NC 1.5 Fire Dept/Rescue Banner Elk NC 1.5 Public 1 NW Roxboro NC 1.3 Public Concord NC 1.3 Public Huntersville NC 1.3 Public 3 E Stanleyville NC 1.3 Public Unc Charlotte NC 1.3 Public 1 ENE Center City Charl NC 1.2 Public 3 SW Waco NC 1.2 Public Newton NC 1.2 Public 4 SSE Vale NC 1.0 Public 1 SW Lincolnton NC 1.0 Fire Dept/Rescue 2 E Stokesdale NC 1.0 Public Bethel Hill NC 0.5 Public 5 SW Rougemont NC 0.5 Public 3 N Efland NC 0.5 Trained Spotter 4 NE Forest City NC 0.5 Public 4 ENE Greensboro NC 0.5 Broadcast Media 5 ESE Colfax NC 0.3 ASOS Greenville-Spartanburg SC 0.1 NWS Employee -
Winter cancelled/uncancelled banter 25/26
donsutherland1 replied to Rjay's topic in New York City Metro
Actually, one needed a Top 10 list. Here it is: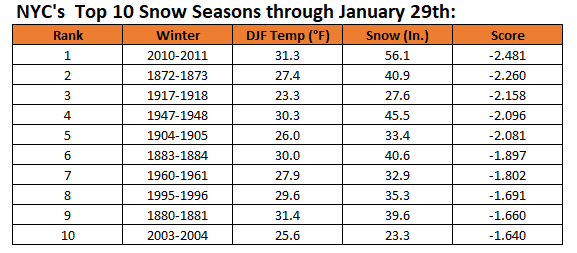
-
The “I bring the mojo” Jan 30-Feb 1 potential winter storm
donsutherland1 replied to lilj4425's topic in Southeastern States
Charlotte is looking really good on the overnight guidance. 6”-12” looks realistic. -
The “I bring the mojo” Jan 30-Feb 1 potential winter storm
donsutherland1 replied to lilj4425's topic in Southeastern States
Probably around 2"-5". -
The “I bring the mojo” Jan 30-Feb 1 potential winter storm
donsutherland1 replied to lilj4425's topic in Southeastern States
3"-6". Probably the biggest snowstorm there since February 11-13, 2014. -
The “I bring the mojo” Jan 30-Feb 1 potential winter storm
donsutherland1 replied to lilj4425's topic in Southeastern States
HRRR notwithstanding with its strong divergence between the advancing primary low and the developing secondary low that holds Raleigh to around an inch of snow, I suspect that things will be better (3"-6" in Raleigh and surrounding areas in the Triangle). Reasonable low-case: 2.5"; reasonable high-case: 6.0". Most of the guidance suggests a healthy snow-growth environment with a deep, well-saturated dendritic growth zone (dgz) with−12°C to −17°C temperatures. The HRRR is a dry exception. Ratios should be 10:1 to 15:1 during the snowfall. Thus, unless the HRRR scores a coup, I think its nightmare won't come to pass in the Raleigh area, even if it gives residents a good fright ahead of the event. -
The “I bring the mojo” Jan 30-Feb 1 potential winter storm
donsutherland1 replied to lilj4425's topic in Southeastern States
Good luck. I'm pulling for all of you. Hopefully, the HRRR will be more generous with the Triangle in its 0z run. Its 18z solution seemed unrealistic, but we'll see. -
The “I bring the mojo” Jan 30-Feb 1 potential winter storm
donsutherland1 replied to lilj4425's topic in Southeastern States
It seems reasonably close to where the 12z ECMWF showed it developing.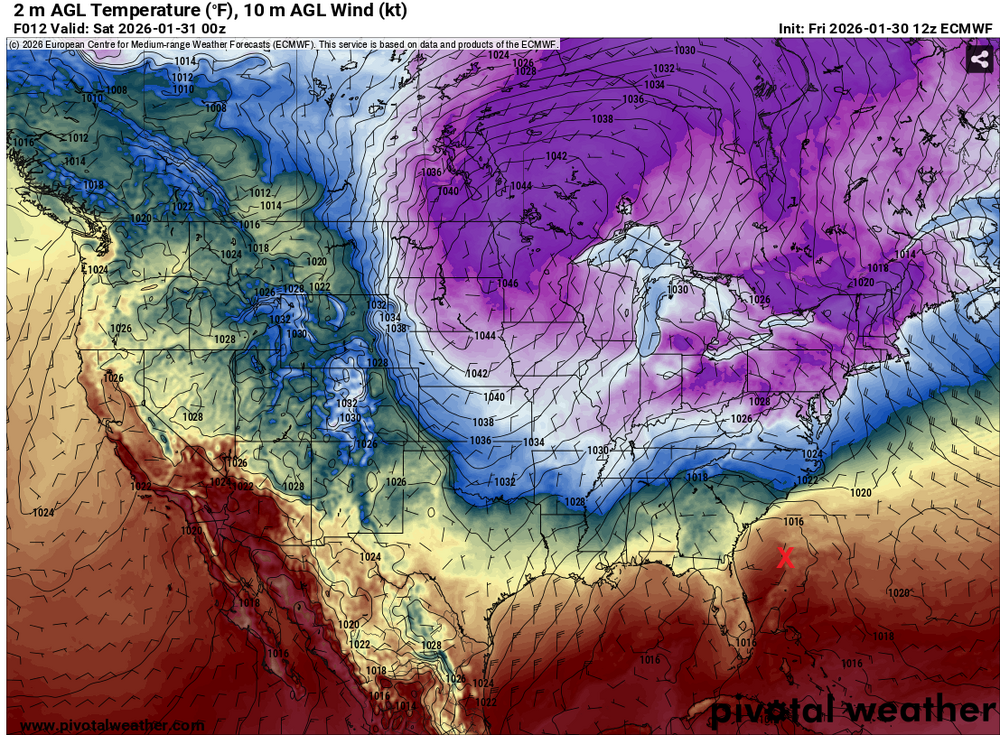
-
Winter cancelled/uncancelled banter 25/26
donsutherland1 replied to Rjay's topic in New York City Metro
No misery this season. If February can be cold and snowy, Winter 2025-2026 could become a really special winter.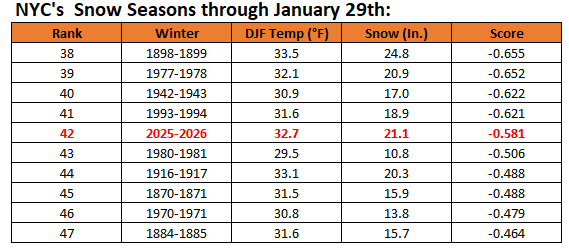
-
2025-2026 ENSO
donsutherland1 replied to 40/70 Benchmark's topic in Weather Forecasting and Discussion
January is winding up with the West again having been warmer to much warmer than normal and the East being colder to much colder than normal.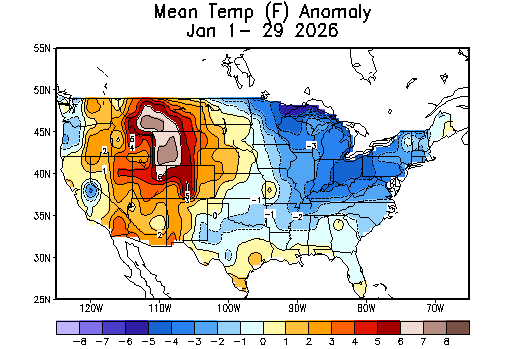
-
My guess is that it will increase the likelihood that the next 1-2 weeks see generally colder than normal temperatures.