donsutherland1
-
Posts
24,192 -
Joined
Content Type
Profiles
Blogs
Forums
American Weather
Media Demo
Store
Gallery
Everything posted by donsutherland1
-
The recent rain delivered 0.50"-1.50" of rain to the region, along with some locally higher figures. Rainfall amounts included: Bridgeport: 0.89" Islip: 1.31" New Haven: 0.74" New York City-Central Park: 1.39" New York City-JFK Airport: 1.49" New York City-LaGuardia Airport: 1.45" Newark: 1.64" Philadelphia: 0.51" White Plains: 1.07" Tomorrow through Wednesday will be somewhat warmer with highs reaching the lower and middle 60s. However, another shot of rain followed by cooler temperatures will arrive during the middle of the week. A general 0.50"-1.00" rainfall appears likely for Wednesday into Thursday. May could also open with cooler than normal conditions. The ENSO Region 1+2 anomaly was +1.8°C and the Region 3.4 anomaly was +0.5°C for the week centered around April 15. For the past six weeks, the ENSO Region 1+2 anomaly has averaged +1.43°C and the ENSO Region 3.4 anomaly has averaged +0.15°C. El Niño conditions will likely develop during late spring or early summer. The SOI was -28.05 today. The preliminary Arctic Oscillation (AO) was -0.960 today. Based on sensitivity analysis applied to the latest guidance, there is an implied near 98% probability that New York City will have a warmer than normal April (1991-2020 normal). April will likely finish with a mean temperature near 55.2° (1.5° above normal). Supplemental Information: The projected mean would be 2.2° above the 1981-2010 normal monthly value.
-
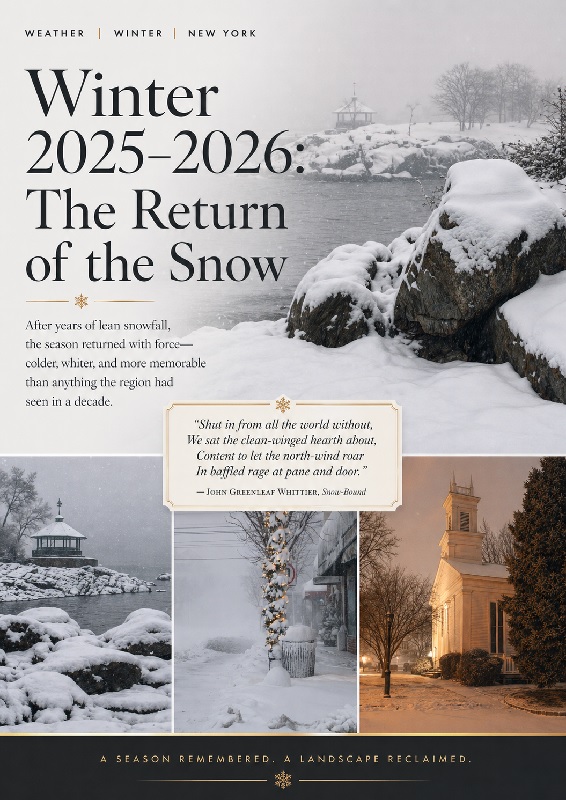
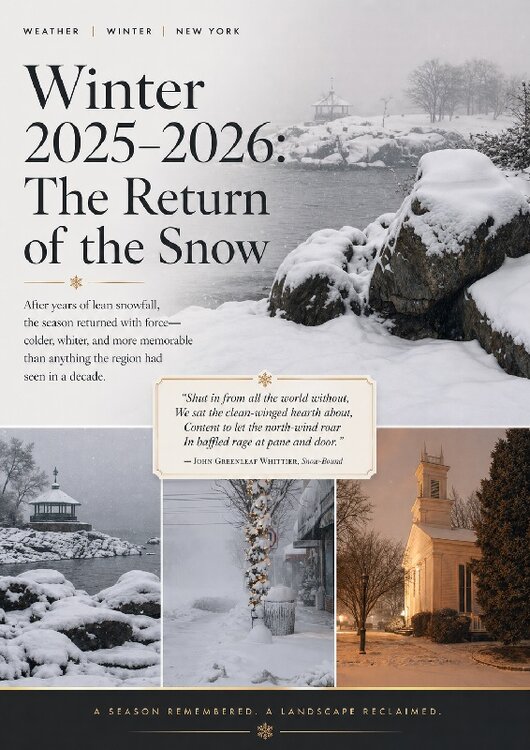
With OpenAI releasing Images 2.0, I decided to test it to make a poster depicting Winter 2025-2026. I used four of my photos and provided some content. I then prompted it to create a poster based on the images and textual content. Here's what it came up with: I also did the same with five photos I took at the New York Botanical Garden and The Cloisters. I asked for a highly creative arrangement where the tulip photos would comprise a tulip. All said, Image 2.0 is far more advanced than the preceding version.

-
Additional rain and showers are likely tonight and tomorrow. A storm total 0.50"-1.50" rainfall with some locally higher amounts remains on track. It will also remain unseasonably cool with temperatures topping out in the middle 50s to end the weekend. Monday and Tuesday will be somewhat warmer with highs reaching the lower and middle 60s. However, another shot of rain and cooler temperatures will arrive during the middle of the week. May could also open with cooler than normal conditions. The ENSO Region 1+2 anomaly was +1.8°C and the Region 3.4 anomaly was +0.5°C for the week centered around April 15. For the past six weeks, the ENSO Region 1+2 anomaly has averaged +1.43°C and the ENSO Region 3.4 anomaly has averaged +0.15°C. El Niño conditions will likely develop during late spring or early summer. The SOI was -28.48 today. The preliminary Arctic Oscillation (AO) was -0.884 today. Based on sensitivity analysis applied to the latest guidance, there is an implied near 96% probability that New York City will have a warmer than normal April (1991-2020 normal). April will likely finish with a mean temperature near 55.2° (1.5° above normal). Supplemental Information: The projected mean would be 2.2° above the 1981-2010 normal monthly value.
- 970 replies
-
- 2
-

-
- april showers bring may..
- rain
- (and 2 more)
-
Yes, things have trended cooler. The onset of late-season blocking has played an important role.
- 970 replies
-
- 2
-
-
- april showers bring may..
- rain
- (and 2 more)
-
A cool and wet weekend lies ahead. Highs will reach only the lower 50s tomorrow and the middle and upper 50s on Sunday. Periods of rain are likely on tomorrow into Sunday. Rainfall amounts of 0.50"-1.50" with a few locally higher amounts are likely across the region. Beyond the weekend, temperatures will likely remain generally below normal for the remainder of April. May could also open with cooler than normal conditions. The ENSO Region 1+2 anomaly was +1.8°C and the Region 3.4 anomaly was +0.5°C for the week centered around April 15. For the past six weeks, the ENSO Region 1+2 anomaly has averaged +1.43°C and the ENSO Region 3.4 anomaly has averaged +0.15°C. El Niño conditions will likely develop during late spring or early summer. The SOI was -10.82 today. The preliminary Arctic Oscillation (AO) was -1.231 today. Based on sensitivity analysis applied to the latest guidance, there is an implied near 93% probability that New York City will have a warmer than normal April (1991-2020 normal). April will likely finish with a mean temperature near 55.3° (1.6° above normal). Supplemental Information: The projected mean would be 2.3° above the 1981-2010 normal monthly value.
- 970 replies
-
- 1
-
-
- april showers bring may..
- rain
- (and 2 more)
-
Following today's balmy temperatures, it will turn cooler tomorrow with temperatures topping out in the lower to perhaps middle 60s. The weekend will be even cooler with highs in the lower 50s on Saturday and middle and upper 50s on Sunday. Periods of rain are likely on Saturday into Sunday. Rainfall amounts of 0.50"-1.50" with a few locally higher amounts are likely across the region. Beyond the weekend, temperatures will likely remain generally below normal for the remainder of April. May could also open with cooler than normal conditions. The ENSO Region 1+2 anomaly was +1.8°C and the Region 3.4 anomaly was +0.5°C for the week centered around April 15. For the past six weeks, the ENSO Region 1+2 anomaly has averaged +1.43°C and the ENSO Region 3.4 anomaly has averaged +0.15°C. El Niño conditions will likely develop during late spring or early summer. The SOI was -2.74 today. The preliminary Arctic Oscillation (AO) was -0.985 today. Based on sensitivity analysis applied to the latest guidance, there is an implied near 90% probability that New York City will have a warmer than normal April (1991-2020 normal). April will likely finish with a mean temperature near 55.4° (1.7° above normal). Supplemental Information: The projected mean would be 2.4° above the 1981-2010 normal monthly value.
- 970 replies
-
- 1
-
-
- april showers bring may..
- rain
- (and 2 more)
-
It will turn briefly springlike tomorrow. High temperatures will reach the upper 60s and lower 70s. However, it will turn cooler on Friday with temperatures topping out in the lower 60s. The weekend will be even cooler with highs in the upper 50s. Some showers are possible during the weekend. There remains some risk for a more meaningful rainfall. Beyond the weekend, temperatures will likely remain generally below normal for the remainder of April. The ENSO Region 1+2 anomaly was +1.8°C and the Region 3.4 anomaly was +0.5°C for the week centered around April 15. For the past six weeks, the ENSO Region 1+2 anomaly has averaged +1.43°C and the ENSO Region 3.4 anomaly has averaged +0.15°C. El Niño conditions will likely develop during late spring or early summer. The SOI was -5.99 today. The preliminary Arctic Oscillation (AO) was -1.013 today. Based on sensitivity analysis applied to the latest guidance, there is an implied near 86% probability that New York City will have a warmer than normal April (1991-2020 normal). April will likely finish with a mean temperature near 55.4° (1.7° above normal). Supplemental Information: The projected mean would be 2.4° above the 1981-2010 normal monthly value.
-
Near record and record cold covered the region this morning. Records included: Allentown: 24° (old record: 28°, 1925, 1956, and 2018) Hartford: 27° (tied record set in 1961) Poughkeepsie: 24° (old record: 26°, 2018) Scranton: 24° (old record: 26°, 1925) Westhampton: 22° (old record: 23°, 2014) White Plains: 27° (old record: 29°, 1981) The last time White Plains recorded a low in the 20s on or after April 21st was April 23, 1982. Tomorrow will be somewhat milder with highs returning to the upper 50s. The temperature could approach or reach 70° on Thursday before another cooling trend commences. No cold shots comparable to the current one are likely for the remainder of spring. No significant rainfall appears likely through the foreseeable future. Some showers are possible during the weekend. There remains some risk for a more meaningful rainfall given the lead time involved. The ENSO Region 1+2 anomaly was +1.8°C and the Region 3.4 anomaly was +0.5°C for the week centered around April 15. For the past six weeks, the ENSO Region 1+2 anomaly has averaged +1.43°C and the ENSO Region 3.4 anomaly has averaged +0.15°C. El Niño conditions will likely develop during late spring or early summer. The SOI was -5.34 today. The preliminary Arctic Oscillation (AO) was -0.507 today. Based on sensitivity analysis applied to the latest guidance, there is an implied near 84% probability that New York City will have a warmer than normal April (1991-2020 normal). April will likely finish with a mean temperature near 55.6° (1.9° above normal). Supplemental Information: The projected mean would be 2.6° above the 1981-2010 normal monthly value.
- 970 replies
-
- 1
-
-
- april showers bring may..
- rain
- (and 2 more)
-
White Plains saw the temperature fall below 30F (-1.1C) this morning. The last time it got at least as cold this late in the season was April 23, 1982 when the low was 26F (-3.3C). The low of 28F (-2.2C) broke the daily record of 29F (-1.7C) from 1981.
- 970 replies
-
- 3
-
-

-
- april showers bring may..
- rain
- (and 2 more)
-
Tomorrow will start off with unseasonably cold temperatures. Lows will fall into the middle or upper 30s in New York City. Areas outside of New York City could experience a late-season freeze. Highs will reach the middle 50s. Wednesday will be somewhat milder. The temperature could approach or reach 70° on Thursday before another cooling trend commences. No significant rainfall appears likely through the foreseeable future. Some showers are possible during the weekend. There remains some risk for a more meaningful rainfall given the lead time involved. The ENSO Region 1+2 anomaly was +1.8°C and the Region 3.4 anomaly was +0.5°C for the week centered around April 15. For the past six weeks, the ENSO Region 1+2 anomaly has averaged +1.43°C and the ENSO Region 3.4 anomaly has averaged +0.15°C. El Niño conditions will likely develop during late spring or early summer. The SOI was -0.07 today. The preliminary Arctic Oscillation (AO) was -0.178 today. Based on sensitivity analysis applied to the latest guidance, there is an implied near 87% probability that New York City will have a warmer than normal April (1991-2020 normal). April will likely finish with a mean temperature near 55.9° (2.2° above normal). Supplemental Information: The projected mean would be 2.9° above the 1981-2010 normal monthly value.
- 970 replies
-
- 3
-
-
- april showers bring may..
- rain
- (and 2 more)
-
I agree.
-
Yes. I suspect that we’ll see an acceleration in the ENSO warming over the next few weeks.
-
A strong late-season cold shot lies ahead. The cold front that will usher in the unseasonably cool air is now moving across the region, bringing with it some light rain. Rainfall amounts will generally be 0.33" or less. Following the frontal passage, highs will reach the middle 50s on on Monday and Tuesday in New York City. Tuesday morning will see the temperature fall into the middle or upper 30s in the City. Areas outside of New York City could experience a late-season freeze. No significant rainfall appears likely through the foreseeable future. The ENSO Region 1+2 anomaly was +1.5°C and the Region 3.4 anomaly was +0.2°C for the week centered around April 8. For the past six weeks, the ENSO Region 1+2 anomaly has averaged +1.30°C and the ENSO Region 3.4 anomaly has averaged +0.07°C. Neutral ENSO conditions will continue through at least mid-spring. The SOI was +6.20 today. The preliminary Arctic Oscillation (AO) was -0.193 today. Based on sensitivity analysis applied to the latest guidance, there is an implied near 88% probability that New York City will have a warmer than normal April (1991-2020 normal). April will likely finish with a mean temperature near 56.1° (2.4° above normal). Supplemental Information: The projected mean would be 3.1° above the 1981-2010 normal monthly value.
- 970 replies
-
- 1
-
-
- april showers bring may..
- rain
- (and 2 more)
-
A cooling trend is now ongoing. That trend will culminate in a sharp cold shot early next week. Tomorrow will be even cooler than today with highs in the upper 50s to perhaps lower 60s. A sharp cold shot is likely early Monday and Tuesday. Highs will reach the middle 50s on both days. Tuesday morning will feature low temperatures fall in the upper 30s. Areas outside of New York City could experience a late-season freeze. Some showers or thundershowers are possible Sunday afternoon into Sunday night. Most areas will see 0.33" or less rainfall. No significant rainfall appears likely through the foreseeable future. The ENSO Region 1+2 anomaly was +1.5°C and the Region 3.4 anomaly was +0.2°C for the week centered around April 8. For the past six weeks, the ENSO Region 1+2 anomaly has averaged +1.30°C and the ENSO Region 3.4 anomaly has averaged +0.07°C. Neutral ENSO conditions will continue through at least mid-spring. The SOI was +10.74 today. The preliminary Arctic Oscillation (AO) was -0.053 today. Based on sensitivity analysis applied to the latest guidance, there is an implied near 89% probability that New York City will have a warmer than normal April (1991-2020 normal). April will likely finish with a mean temperature near 56.3° (2.6° above normal). Supplemental Information: The projected mean would be 3.3° above the 1981-2010 normal monthly value.
- 970 replies
-
- 1
-
-
- april showers bring may..
- rain
- (and 2 more)
-
A cooling trend is getting underway and it will culminate in a sharp cold shot early next week. Tomorrow will see temperatures top out in the upper 60s. Sunday will be even cooler with highs in the upper 50s and lower 60s. A sharp cold shot is likely early next week. Highs will reach the middle 50s, while low temperatures fall into the upper 30s and lower 40s. Generally dry conditions will also persist through at least tomorrow. Some showers or thundershowers are possible Sunday afternoon into Sunday night. No significant rainfall appears likely through the foreseeable future. The ENSO Region 1+2 anomaly was +1.5°C and the Region 3.4 anomaly was +0.2°C for the week centered around April 8. For the past six weeks, the ENSO Region 1+2 anomaly has averaged +1.30°C and the ENSO Region 3.4 anomaly has averaged +0.07°C. Neutral ENSO conditions will continue through at least mid-spring. The SOI was +14.78 today. The preliminary Arctic Oscillation (AO) was +0.178 today. Based on sensitivity analysis applied to the latest guidance, there is an implied near 90% probability that New York City will have a warmer than normal April (1991-2020 normal). April will likely finish with a mean temperature near 56.3° (2.6° above normal). Supplemental Information: The projected mean would be 3.3° above the 1981-2010 normal monthly value.
-
Personally, I think the modeling may be somewhat too cool for the second half of April, but the ECMWF weeklies show cooler than normal conditions for the April 20-30 period. In addition, a strong cold shot lies ahead for early next week. One or two days will likely to see readings approach or reach 10° below normal. Outside NYC, some areas could experience a late-season freeze. In mathematical terms, one would not need near record cold to reach the figure from the guidance (overnight the guidance ticked up a few tenths of a degree). If one took all the readings to date and assumed that the remainder of the month would average normal, one would come up with a 56.6° mean. Normal for April 17-30 is 56.8°. Since 2020, five years have had a cooler April 17-30. As for 2023, April 1-16 had a mean temperature of 59.9°. That was much warmer than April 1-16, 2026. This year's mean temperature was 56.4°. Finally, the probability is based on a normal distribution. Part of the region under the curve is still below normal at this point in time based on the standard deviation. Although I would be quite shocked were April to wind up cooler than normal overall, that doesn't mean that a statistical probability of such an outcome doesn't exist, even if it's low. The stated probability means that a warmer than normal April is very likely.
-
Temperatures approached and reached record levels across parts of the region yet again today. Central Park registered a high of 89°. Newark reached 90°. Daily records were set at Atlantic City (91°), Baltimore (91°), Norfolk (92°), and Philadelphia (91°). Readings will return to the upper 70s to around 80° tomorrow, upper 60s on Saturday and upper 50s to lower 60s on Sunday. A sharp cold shot is possible early next week. Generally dry conditions will also persist through at least Saturday. Some showers or thundershowers are possible Sunday afternoon into Sunday night. The ENSO Region 1+2 anomaly was +1.5°C and the Region 3.4 anomaly was +0.2°C for the week centered around April 8. For the past six weeks, the ENSO Region 1+2 anomaly has averaged +1.30°C and the ENSO Region 3.4 anomaly has averaged +0.07°C. Neutral ENSO conditions will continue through at least mid-spring. The SOI was +1.51 yesterday. The preliminary Arctic Oscillation (AO) was -0.115 today. Based on sensitivity analysis applied to the latest guidance, there is an implied near 85% probability that New York City will have a warmer than normal April (1991-2020 normal). April will likely finish with a mean temperature near 56.1° (2.4° above normal). Supplemental Information: The projected mean would be 3.1° above the 1981-2010 normal monthly value.
-
1990 had a peak high of 95°. The mean temperature was 74.7° vs. 75.0° in 1977. Both summers were in the top third overall through 1990. A similar kind of summer would be warmer today.
- 970 replies
-
- 1
-
-
- april showers bring may..
- rain
- (and 2 more)
-
With today's 90° high in Central Park, 2026 became only the third year on record with a high of 80° or above in March and a high of 90° or above in April. The only prior years were 1977 and 1990.
- 970 replies
-
- 3
-
-
- april showers bring may..
- rain
- (and 2 more)
-
Temperatures approached and reached record levels across parts of the region. Records included: Baltimore: 91° (old record: 88°, 1941) Bridgeport: 82° (old record: 81°, 1960) Hartford: 87° (old record: 88°, 1941) Islip: 81° (old record: 78°, 2002, 2024) New York City-Central Park: 90° (old record: 87°, 1941) New York City-LaGuardia Airport: 88° (old record: 86°, 1941) Newark: 91°(old record: 88°, 1960) Philadelphia: 91° (old record: 88°, 1941) Washington, DC: 90° (old record: 89°, 1941) White Plains: 87° (old record: 83°, 1960) Tomorrow will be another summerlike day. Temperatures will likely peak in the upper 80s in most of the region. The hot spots could approach or reach 90°. Long Island will be cooler with highs peaking in the 70s due to onshore breezes. Following the bout of early season heat, readings will return to the 70s to end the week and start the weekend. It will turn cooler on Sunday. A sharp cold shot is possible early next week. Generally dry conditions will also persist through at least Friday. The ENSO Region 1+2 anomaly was +1.5°C and the Region 3.4 anomaly was +0.2°C for the week centered around April 8. For the past six weeks, the ENSO Region 1+2 anomaly has averaged +1.30°C and the ENSO Region 3.4 anomaly has averaged +0.07°C. Neutral ENSO conditions will continue through at least mid-spring. The SOI was -9.45 yesterday. The preliminary Arctic Oscillation (AO) was -0.814 today. Based on sensitivity analysis applied to the latest guidance, there is an implied near 83% probability that New York City will have a warmer than normal April (1991-2020 normal). April will likely finish with a mean temperature near 56.3° (2.6° above normal). Supplemental Information: The projected mean would be 3.3° above the 1981-2010 normal monthly value.
- 970 replies
-
- 3
-
-

-
- april showers bring may..
- rain
- (and 2 more)
-
Tomorrow and Thursday will feature exceptional early season warmth. Temperatures will likely peak in the middle and upper in most of the region. Records will likely be challenged tomorrow. Daily Records for April 15: Albany: 86°, 2003 Bridgeport: 81°, 1960 Hartford: 88°, 1941 Islip: 78°, 2002, 2024 New York City-Central Park: 87°, 1941 New York City-JFK Airport: 80°, 1960, 2002, 2006 New York City-LaGuardia Airport: 86°, 1941 Newark: 88°, 1960 Philadelphia: 88°, 1941 White Plains: 83°, 1960 Some of the guidance suggests that the hot spots could approach or reach 90° during the height of the warmth. Long Island will be cooler with highs peaking in the 70s due to onshore breezes. However, there is a chance that Islip could approach or reach 80° on Wednesday. Following the bout of early season heat, readings will return to the 70s to end the week and start the weekend. It will turn cooler on Sunday. A sharp cold shot is possible early next week. Generally dry conditions will also persist through at least Friday. The ENSO Region 1+2 anomaly was +1.5°C and the Region 3.4 anomaly was +0.2°C for the week centered around April 8. For the past six weeks, the ENSO Region 1+2 anomaly has averaged +1.30°C and the ENSO Region 3.4 anomaly has averaged +0.07°C. Neutral ENSO conditions will continue through at least mid-spring. The SOI was -9.45 today. The preliminary Arctic Oscillation (AO) was -1.087 today. Based on sensitivity analysis applied to the latest guidance, there is an implied near 84% probability that New York City will have a warmer than normal April (1991-2020 normal). April will likely finish with a mean temperature near 56.6° (2.9° above normal). Supplemental Information: The projected mean would be 3.6° above the 1981-2010 normal monthly value.
-
Atlantic City reached 88° so far. That breaks the daily record of 86° from 1945.
-
An early summer preview is getting underway... Tomorrow through Thursday will feature exceptional early season warmth. Temperatures will likely peak in the 80s on all three days in most of the region. Records could be challenged on Wednesday. Some of the guidance suggests that the hot spots could approach or reach 90° during the height of the warmth. Long Island will be cooler with highs peaking in the 70s due to onshore breezes. However, there is a chance that Islip could approach or reach 80° on Wednesday. Following the bout of early season heat, readings will return to the 70s to end the week and start the weekend. Dry conditions will also persist. No rain is likely through at least Friday. The ENSO Region 1+2 anomaly was +1.5°C and the Region 3.4 anomaly was +0.2°C for the week centered around April 8. For the past six weeks, the ENSO Region 1+2 anomaly has averaged +1.30°C and the ENSO Region 3.4 anomaly has averaged +0.07°C. Neutral ENSO conditions will continue through at least mid-spring. The SOI was -15.22 today. The preliminary Arctic Oscillation (AO) was -0.659 today. Based on sensitivity analysis applied to the latest guidance, there is an implied near 84% probability that New York City will have a warmer than normal April (1991-2020 normal). April will likely finish with a mean temperature near 56.8° (3.1° above normal). Supplemental Information: The projected mean would be 3.8° above the 1981-2010 normal monthly value.
- 970 replies
-
- 1
-
-
- april showers bring may..
- rain
- (and 2 more)
-
An early summer preview lies ahead. Tomorrow will turn much warmer with temperatures surging into the middle 70s across much of the region. The warmest spots could approach 80°. Tuesday through Thursday will feature exceptional early season warmth. Temperatures will likely peak in the 80s on all three days in most of the region. Records could be challenged on Wednesday. Some of the guidance suggests that the hot spots could approach or reach 90° during the height of the warmth. Long Island will be cooler with highs peaking in the 70s due to onshore breezes. However, there is a chance that Islip could approach or reach 80° on Wednesday. Following the bout of early season heat, readings will return to the 70s to end the week and start the weekend. Dry conditions will also persist. No rain is likely through at least next Friday. The ENSO Region 1+2 anomaly was +1.2°C and the Region 3.4 anomaly was +0.2°C for the week centered around April 1. For the past six weeks, the ENSO Region 1+2 anomaly has averaged +1.25°C and the ENSO Region 3.4 anomaly has averaged 0.00°C. Neutral ENSO conditions will continue through at least mid-spring. The SOI was -17.67 today. The preliminary Arctic Oscillation (AO) was +0.016 today. Based on sensitivity analysis applied to the latest guidance, there is an implied near 86% probability that New York City will have a warmer than normal April (1991-2020 normal). April will likely finish with a mean temperature near 57.0° (3.3° above normal). Supplemental Information: The projected mean would be 4.0° above the 1981-2010 normal monthly value.
- 970 replies
-
- 2
-
-
- april showers bring may..
- rain
- (and 2 more)
-
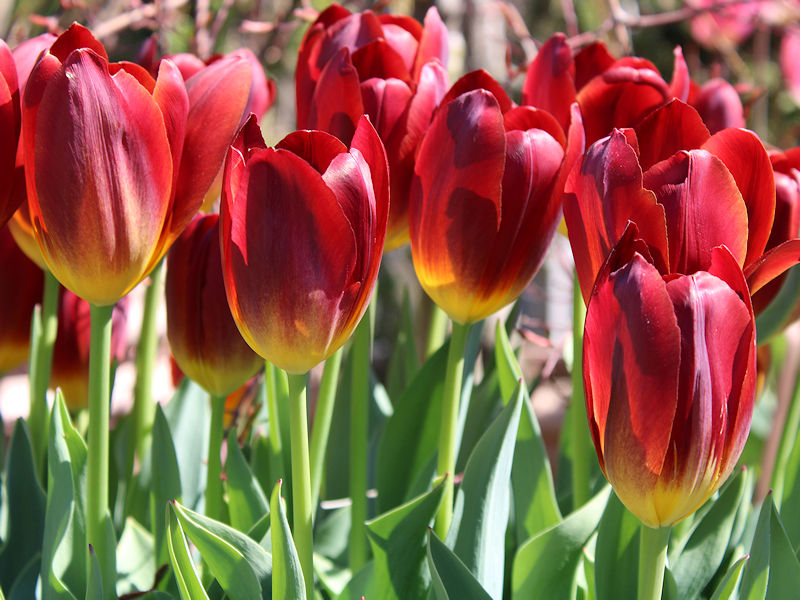
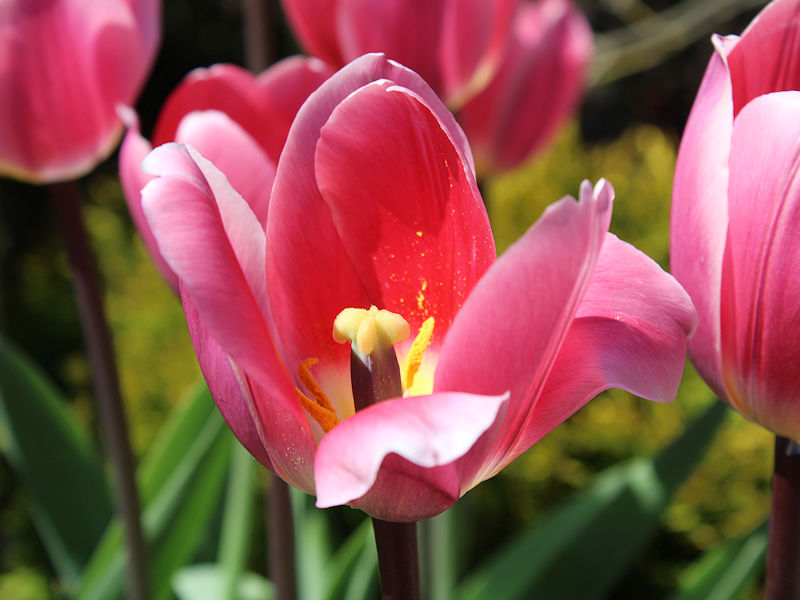
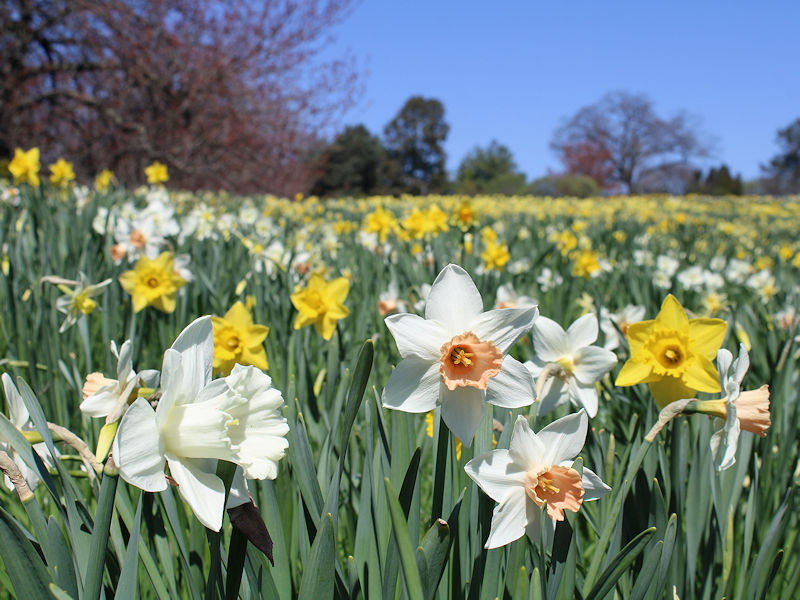
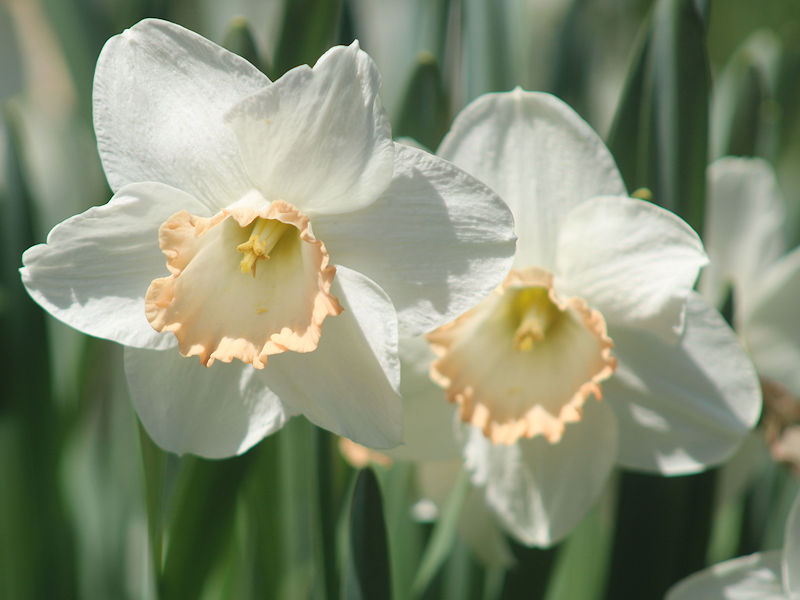
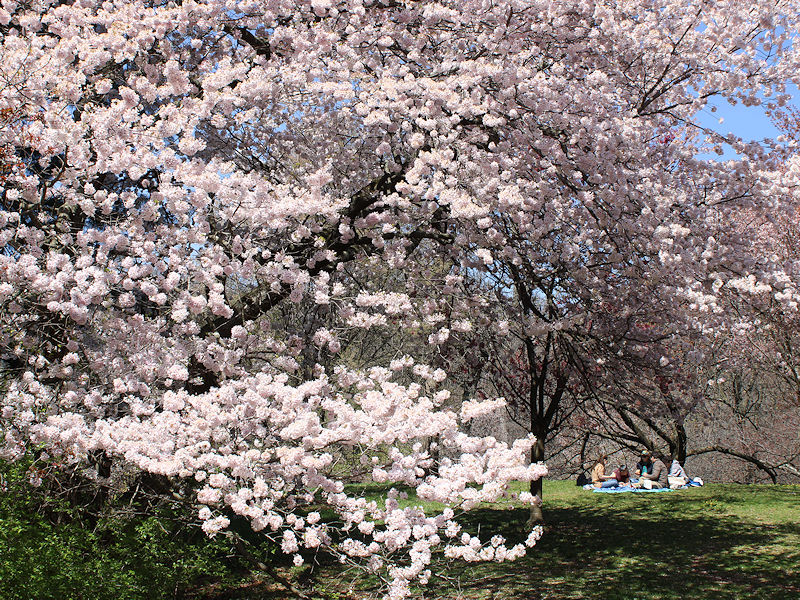
Although readings were confined to the lower and middle 50s, the signs of spring are everywhere. From the New York Botanical Garden:
- 970 replies
-
- 7
-
-
- april showers bring may..
- rain
- (and 2 more)