donsutherland1
-
Posts
23,765 -
Joined
Content Type
Profiles
Blogs
Forums
American Weather
Media Demo
Store
Gallery
Everything posted by donsutherland1
-
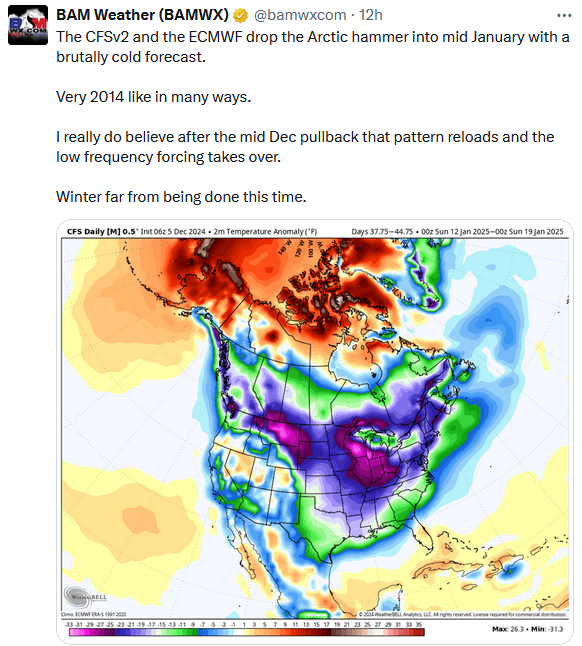
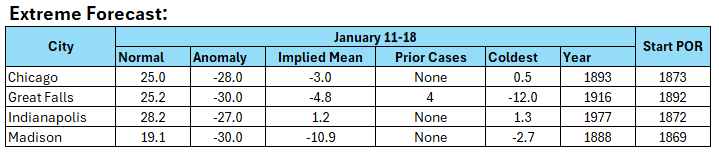
This is an example of the hype that I was criticizing earlier: Now, let's take a look at the BAMWX extreme forecast and historic data for four cities shown in the more extreme parts of the map: Chicago, Great Falls, Indianapolis, and Madison. In three cases, the cold would be unprecedented for the period in question. While it could be colder than normal, the probability of the kind of cold shown on the map is extremely low. Moreover, one is dealing with a timeframe more than five weeks into the future where model skill is far less than climatology. Considering the timeframe, the historic data, and the smaller pool of Northern Hemisphere deep cold in the contemporary area, the kind of widespread extreme weekly anomalies shown on the map are exceptionally unlikely. Posting such a map is reckless. Moreover, even as BAMWX focuses on Indiana, the map is disconnected from Indianapolis' historic climate data. I suspect that the BAMWX forecast will be off by an average of 10° or more for these four cities and can't rule out a miss by more than 20°. I also expect that BAMWX will never verify its extreme idea. This outlook will be verified here and on X.
-
In the wake of today's clipper system that brought New York City and Newark their first snowfall of the season (just a trace), it will turn much colder. The temperature will struggle just to reach and exceed freezing in New York City tomorrow. The post-clipper cold shot will be fairly shortlived. Milder air will return to the region to close the weekend. Temperatures could reach or exceed 50° in the northern Mid-Atlantic and southern New England areas by early next week. The latest ECMWF weeklies have moved into agreement with the CFSv2 in showing generally above normal temperatures through much of the remainder of December. The CFSv2 remains more aggressive with the magnitude of wrmth. Beyond two weeks, skill scores are low, so the persistent warmth isn't cast in stone just yet. Moreover, short-duration cold shots remain possible. The NAO fell to a preliminary -2.751 on September 24th (all-time September record: -2.371, September 12, 1971). That was the 9th lowest value on record. La Niña winters following September cases where the NAO fell to -1.900 or below featured a predominantly positive NAO. The most recent such winters were 2016-2017 and 2022-2023. The mean temperatures for those winters in New York City were 39.3° and 41.0° respectively. The 1991-2020 normal value is 36.2°. A warmer to much warmer than normal outcome is favored by the November run of the ECMWF for Winter 2024-2025. The ENSO Region 1+2 anomaly was +0.3°C and the Region 3.4 anomaly was -0.3°C for the week centered around November 27. For the past six weeks, the ENSO Region 1+2 anomaly has averaged +0.07°C and the ENSO Region 3.4 anomaly has averaged -0.23°C. Neutral ENSO conditions may still evolve into a La Niña event during the winter. Uncertainty as to whether a La Niña will actually develop continues to increase. Currently, 47% of dynamical models and 22% of the statistical models forecast the development of a La Niña. The SOI was +28.70 today. The preliminary Arctic Oscillation (AO) was +0.143 today.
-
I don't agree. Even language similar to this would be helpful: "The outcome represents our best judgment of how the pattern will evolve, but at such time frames significant changes are still possible..."
-
No. If one wants to forecast, one should. IMO, making the effort is worth it, as it can lead to insights and breakthroughs over time. However, forecasters who provide information to the general public should explicitly state the degree of uncertainty that is inherent in long-range forecasts. We, here, are aware of model limitations, the general public isn't. They should also verify their forecasts. The gap between the public's perceptions of forecasting skill and actual forecasting skill results from factors including the public's unfamiliarity with risk. Thus, if someone posts on, let's say X, that a very snowy pattern or blowtorch pattern will occur in late December and the outcome falls somewhere in between, the public only recalls the forecast that failed. It's even worse if the opposite outcome occurs. And because the forecasting language was definitive, the public makes no allowances for forecasting risk. They simply assume that meteorologists can't accurately forecast. In particular, the social media accounts that hype events--hype leads to greater social media engagement--are particularly damaging to the profession. By definition, every event can't be notable, much less extreme. Such events are low probability or very low probability events. Portraying events as extreme or referencing extreme events without providing sufficient context does a lot of damage. I believe the CPC has chosen to stick with probabilistic forecasts, because such forecasts convey the degree of uncertainty involved with various outcomes. Deterministic forecasts provide concrete numbers for outcomes but sacrifice the degree of risk. One can bridge the gap by conveying information about uncertainty when making a deterministic forecast. My point applies to those who are actually forecasting professionally for the public on a professional basis.
-
Absolutely. Much can still change.
-
I agree. With such low skill scores at that timeframe, they are being exceptionally bold. Even beyond two weeks, the ECMWF weeklies can have very large errors. The operational model has been jumping wildly between solutions on a run-to-run basis for the extended timeframe. The week 4 forecast has also seen significant changes in the forecast pattern over North America in recent runs. There's a lot of uncertainty. Forecasters risk big error by pouncing on the appearance of patterns they like and then assuming that nothing will change between now and the distant forecast period.
-
Toronto picked up 6.6 cm (2.6") of snow yesterday (the daily record of 15.2 cm/6.0" was set in 1898). It's encouraging to see parts of the Great Lakes region starting to build snow totals. It's also encouraging to see the guidance beginning to be less warm for January for that region, as it reinforces the idea of possible near to somewhat above normal snowfall there (Chicago to Toronto).
-
Yes. I hope so, too.
-
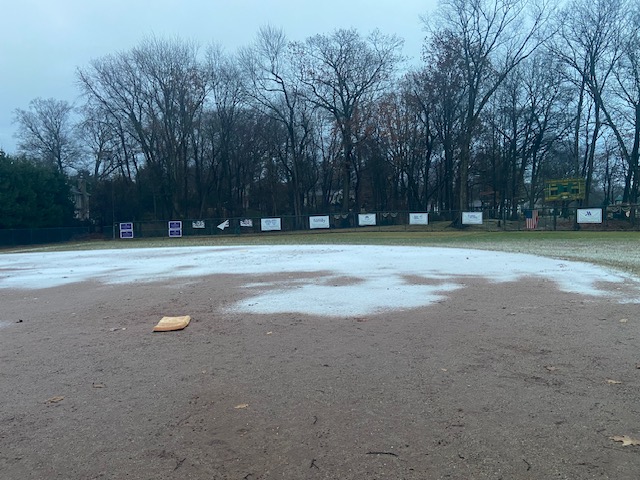
New Rochelle, NY this morning. #nywx
-
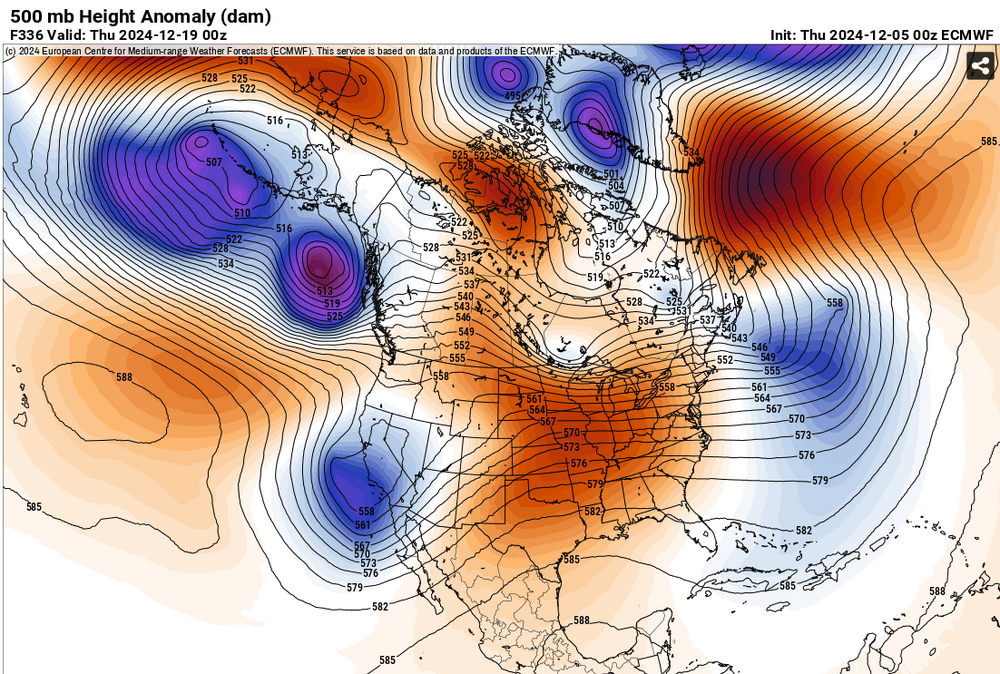
The ECMWF flip-flops continue:
-
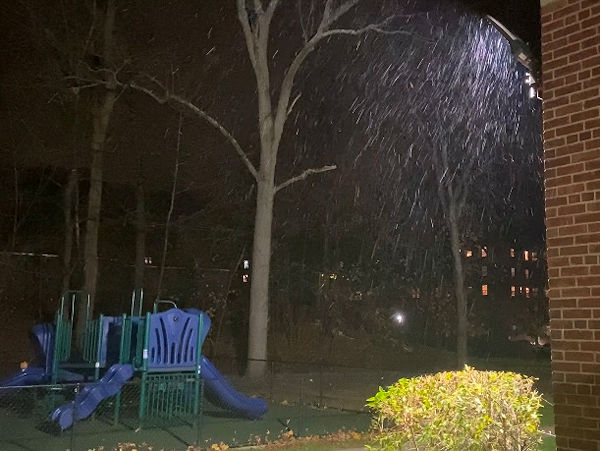
Rain transitioned to large wet snowflakes in Larchmont. Some slush is building up on car windshields, but the ground is still too warm for any accumulation.
-
A passing snow shower.
-
The magnitude of the change was astonishing.
-
A clipper system could bring parts of the region a period of light snow or flurries tonight into tomorrow. Parts of the region could pick up a coating of snow. As colder air rushes into the region behind the clipper, parts of the region could experience some heavier snow showers and even a snow squall tomorrow. Temperatures will tumble into the lower 30s by evening. The post-clipper cold shot will be fairly shortlived. Milder air will return to the region to close the weekend. Temperatures could reach or exceed 50° in the northern Mid-Atlantic and southern New England areas by early next week. The latest ECMWF weeklies have moved into agreement with the CFSv2 in showing generally above normal temperatures through much of the remainder of December. The CFSv2 remains more aggressive with the magnitude of wrmth. Beyond two weeks, skill scores are low, so the persistent warmth isn't cast in stone just yet. The NAO fell to a preliminary -2.751 on September 24th (all-time September record: -2.371, September 12, 1971). That was the 9th lowest value on record. La Niña winters following September cases where the NAO fell to -1.900 or below featured a predominantly positive NAO. The most recent such winters were 2016-2017 and 2022-2023. The mean temperatures for those winters in New York City were 39.3° and 41.0° respectively. The 1991-2020 normal value is 36.2°. A warmer to much warmer than normal outcome is favored by the November run of the ECMWF for Winter 2024-2025. The ENSO Region 1+2 anomaly was +0.3°C and the Region 3.4 anomaly was -0.3°C for the week centered around November 27. For the past six weeks, the ENSO Region 1+2 anomaly has averaged +0.07°C and the ENSO Region 3.4 anomaly has averaged -0.23°C. Neutral ENSO conditions may still evolve into a La Niña event during the winter. Uncertainty as to whether a La Niña will actually develop continues to increase. Currently, 47% of dynamical models and 22% of the statistical models forecast the development of a La Niña. The SOI was +23.56 today. The preliminary Arctic Oscillation (AO) was -0.100 today.
-
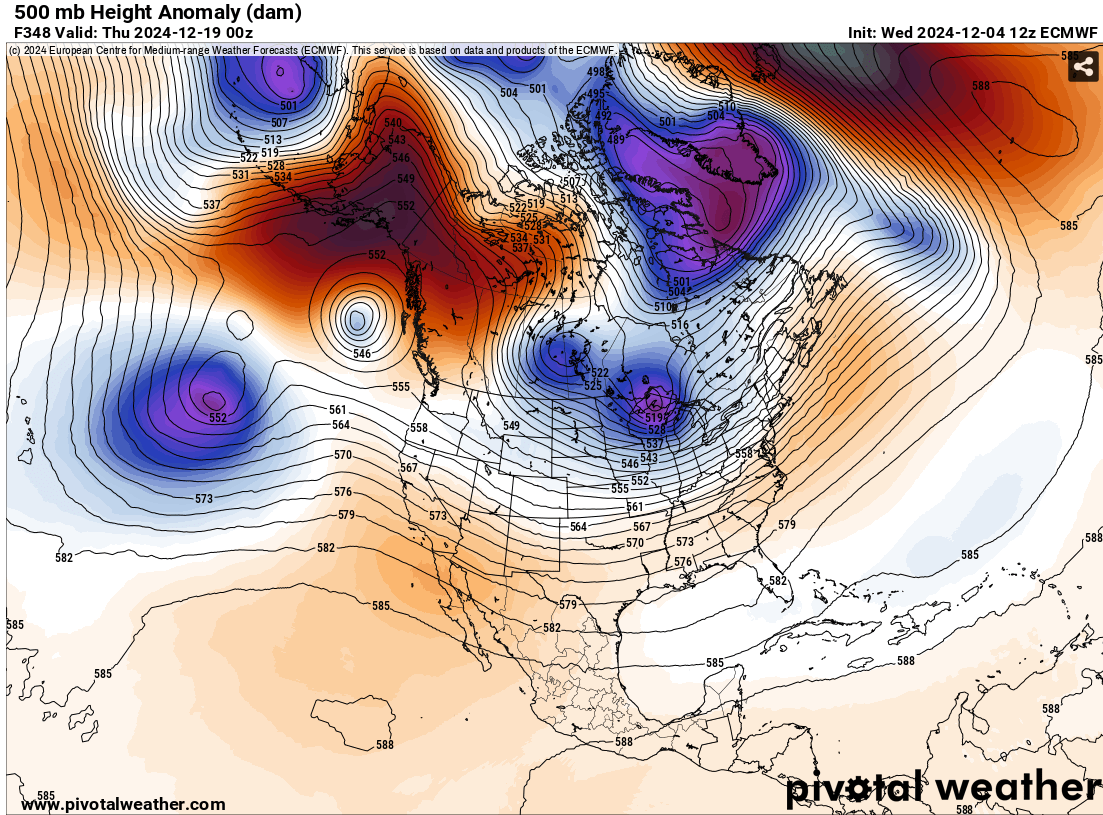
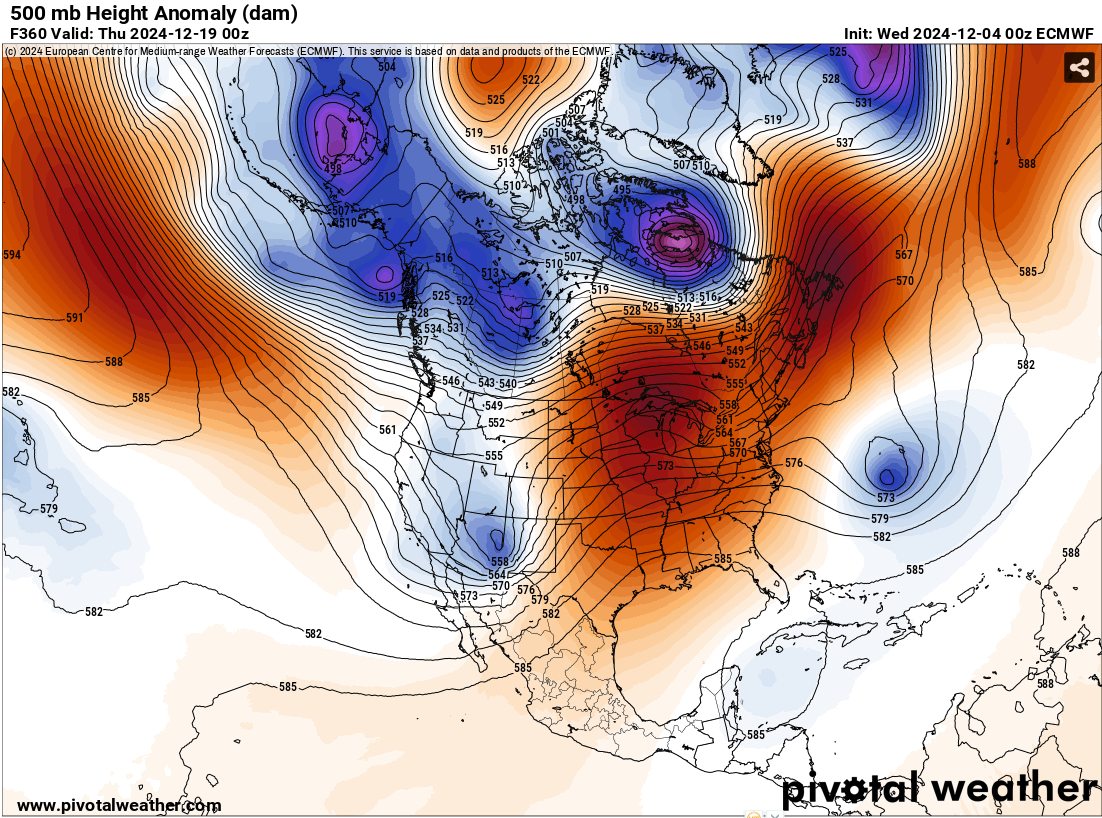
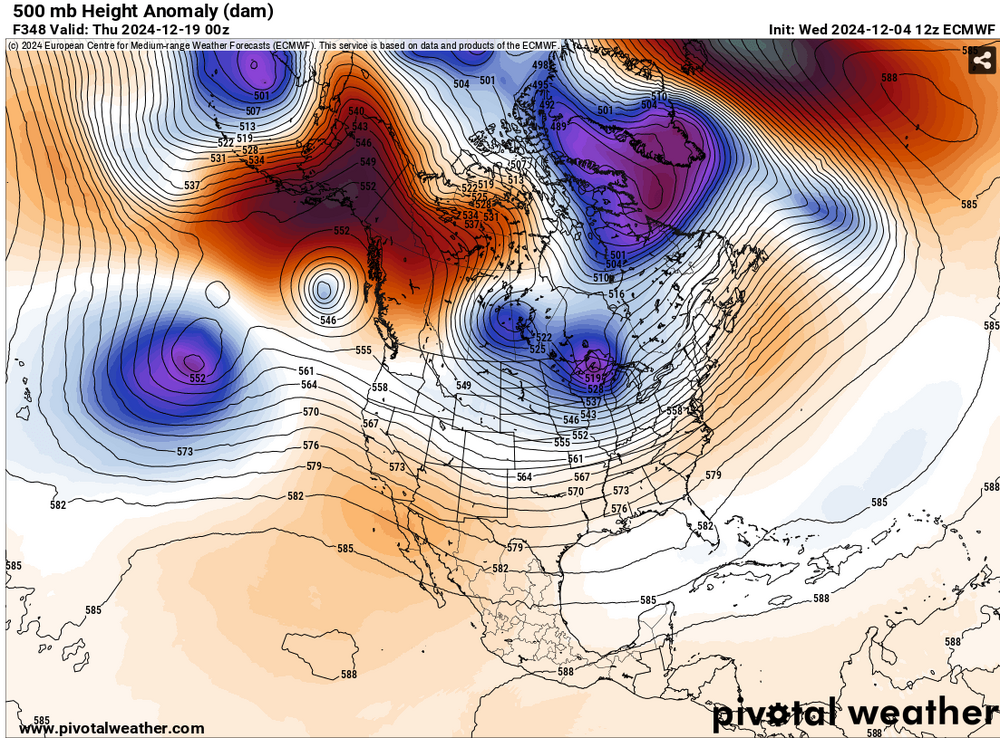
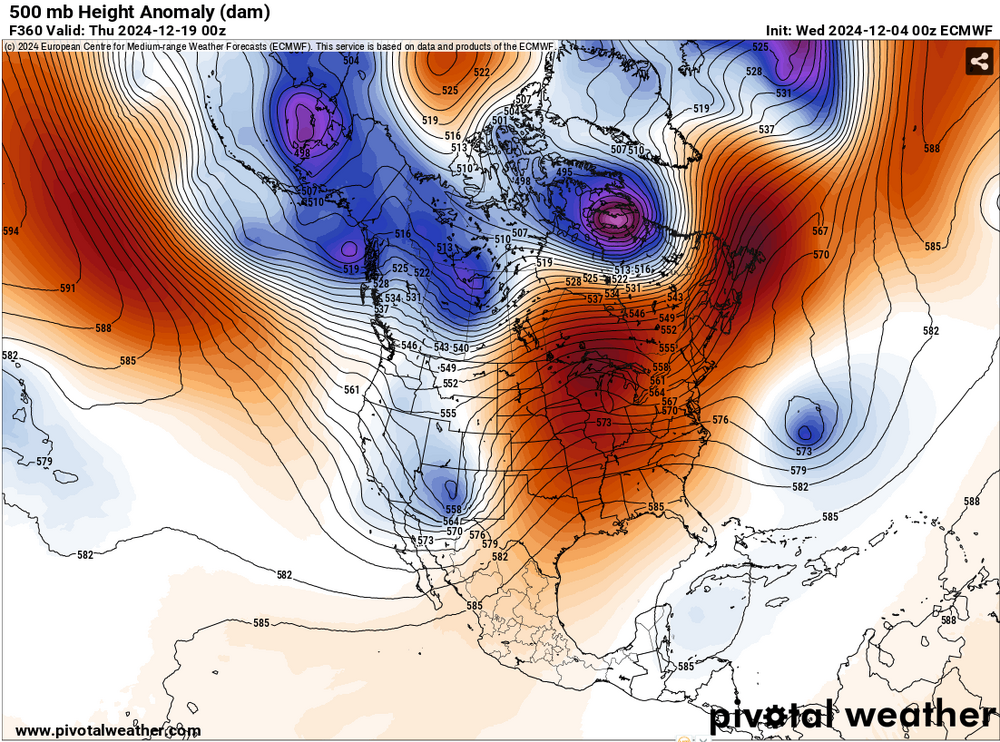
It should be noted that the operational ECMWF is having wildly differing solutions (poor run-to-run continuity in the long-range). The 12/4 0z run: 360 Hours The 12/4 12z run: 348 Hours
-
That's probably a reasonable expectation. The preponderance of the guidance had been showing the following teleconnections states for the winter: AO/NAO: Predominantly positive with some variability PDO: Strongly negative to negative EPO: Generally neutral to positive An early-season EPO-/AO-/NAO-/PNA+ does not necessarily mean that the seasonal guidance is off. If anything, it strengthens the idea of a more variable winter than the last two. Until there is stronger evidence, one should not assume that the early-season pattern will likely predominate. There will be more variability, so there could be some additional episodes of such states. However, to get to the kind of averages depicted on the three-month seasonal guidance, one would need to see sustained periods of AO+/NAO+, PNA-, and EPO+.
-
Model bias data can also be found here: https://frontierweather.dtn.com/verification.html
-
Your call looks good. The latest ECMWF weeklies and CFSv2, which show persistent warmth for an extended period of time, raise questions about assumptions in some circles e.g., BAMWX, about this winter's seeing a predominantly cold pattern. The seasonal guidance suggested otherwise, even as month-to-month variability is likely.
-
The most recent guidance is suggesting that even as the first 10 days of December will be unseasonably cold, the cold won't be as significant as on the earlier guidance. Nevertheless, on account of successive waves of cold, the first two weeks of December will likely feature mainly below normal temperatures. Significant lake effect snow remains likely. The pattern will likely be a fairly quiet one. As a result, the Washington, DC to New York City area likely won't see any appreciable snowfall during the first two weeks of December. However, a clipper system could bring a period of light snow or flurries to parts of the region late tomorrow into Thursday. A snow squall is possible in parts of the area as the cold air rushes back into the region behind the clipper. It is possible that New York City could see a coating of snow. The post-clipper cold shot will be fairly shortlived. Milder air will return to the region to close the weekend. Temperatures could reach or exceed 50° in the northern Mid-Atlantic and southern New England areas by early next week. The latest ECMWF weeklies have moved into agreement with the CFSv2 in showing generally above normal temperatures through much of the remainder of December. Beyond two weeks, skill scores are low, so the persistent warmth isn't cast in stone just yet. The NAO fell to a preliminary -2.751 on September 24th (all-time September record: -2.371, September 12, 1971). That was the 9th lowest value on record. La Niña winters following September cases where the NAO fell to -1.900 or below featured a predominantly positive NAO. The most recent such winters were 2016-2017 and 2022-2023. The mean temperatures for those winters in New York City were 39.3° and 41.0° respectively. The 1991-2020 normal value is 36.2°. A warmer to much warmer than normal outcome is favored by the November run of the ECMWF for Winter 2024-2025. The ENSO Region 1+2 anomaly was +0.3°C and the Region 3.4 anomaly was -0.3°C for the week centered around November 27. For the past six weeks, the ENSO Region 1+2 anomaly has averaged +0.07°C and the ENSO Region 3.4 anomaly has averaged -0.23°C. Neutral ENSO conditions may still evolve into a La Niña event during the winter. Uncertainty as to whether a La Niña will actually develop continues to increase. Currently, 47% of dynamical models and 22% of the statistical models forecast the development of a La Niña. The SOI was +19.77 today. The preliminary Arctic Oscillation (AO) was +0.033 today.
-
I agree. It was even more surprising, as the CFSv2 has been struggling with the ENSO.
-
The guidance has turned milder. The CFSv2 was hinting at this for several days and the other guidance fell in line. Often the guidance rushes such transitions, but not this time. I suspect much of the rest of December could be mild in the eastern half of the CONUS (still sufficiently cold at times for snow in the Great Lakes Region) but reduced snowfall chances for NYC and southward. Even the current colder period is on track to be milder than what had previously been shown on the guidance.
-
Based on recent trends in the guidance, it seems that the faster pattern break forecast by the CFSv2 will be more likely to verify. If so, the moderation that will start as early as late next weekend/early next week could be the start of a milder regime. Its duration, once it sets in remains to be seen. I believe the ongoing PNA+ regime will be more an aberration than the norm for this winter. Even as the PDO- has been dented based on recent SSTA changes, it would take an unprecedented rise for it to average positive for January or February. Thus, a PNA-/PNA-neutral regime seems more likely to predominate this winter, as had been depicted on the seasonal guidance. In the larger context, I continue to expect that Winter 2024-25 would be more variable than the last two winters. It won't rival either of them in terms of warm anomalies, but it should still wind up warmer than normal. Snowfall opportunities should also be more frequent, with the Great Lakes still in line for near normal or even somewhat above normal snowfall.
-
A cold air mass continues to cover the region. A few locations saw some flurries this afternoon into this evening. The most recent guidance is suggesting that even as the first 10 days of December will be unseasonably cold, the cold won't be as significant as on the earlier guidance. Nevertheless, on account of successive waves of cold, the first two weeks of December will likely feature mainly below normal temperatures. The long-range guidance remains in good agreement for a cold first half of December. Significant lake effect snow remains likely. The pattern will likely be a fairly quiet one. As a result, the Washington, DC to New York City area likely won't see any appreciable snowfall during the first two weeks of December. However, a clipper system could bring a period of light snow or flurries to parts of the region late Wednesday into Thursday. A snow squall is possible in parts of the area as the cold air rushes back into the region behind the clipper. The NAO fell to a preliminary -2.751 on September 24th (all-time September record: -2.371, September 12, 1971). That was the 9th lowest value on record. La Niña winters following September cases where the NAO fell to -1.900 or below featured a predominantly positive NAO. The most recent such winters were 2016-2017 and 2022-2023. The mean temperatures for those winters in New York City were 39.3° and 41.0° respectively. The 1991-2020 normal value is 36.2°. A warmer to much warmer than normal outcome is favored by the November run of the ECMWF for Winter 2024-2025. The ENSO Region 1+2 anomaly was +0.3°C and the Region 3.4 anomaly was -0.3°C for the week centered around November 27. For the past six weeks, the ENSO Region 1+2 anomaly has averaged +0.07°C and the ENSO Region 3.4 anomaly has averaged -0.23°C. Neutral ENSO conditions may still evolve into a La Niña event during the winter. Uncertainty as to whether a La Niña will actually develop continues to increase. Currently, 47% of dynamical models and 22% of the statistical models forecast the development of a La Niña. The SOI was +14.01 today. The preliminary Arctic Oscillation (AO) was -0.667 today.
-
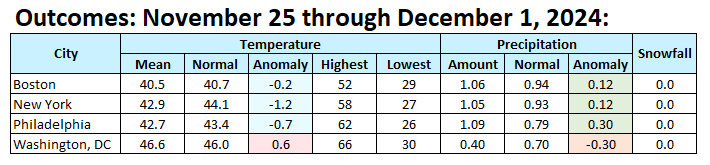
Final Outcomes:
-
Winter 2024-25 has gotten off to a cold start. This morning the temperature fell to 27° in New York City's Central Park. That was the first sub-30° low since March 22nd and the coldest low temperature since February 17th when the mercury also dipped to 27°. The first 10 days of December will likely see a mean temperature below 34° in New York City. The last time that happened was in 2002, when the first 10 days of December had a mean temperature of 31.2°. December will likely wind up somewhat colder than normal overall. In fact, since 1980, all four cases with a December 1-10 mean temperature below 36.5° preceded a colder than normal December while 85% of the remaining cases saw a warmer than normal December. The sensitivity analysis applied to the latest guidance showed an implied 68% probability of a colder than normal December. On account of successive waves of cold, the first two weeks of December will likely feature mainly below normal temperatures. The long-range guidance remains in good agreement for a cold first half of December. Significant lake effect snow remains likely even as the current event will wind down. So far, the current event has seen 46.0" at Barnes Corners (4 SW), NY and Copenhagen (4 NW). In addition, daily snowfall at Erie came to 22.6" on November 29th, which broke the all-time daily mark of 21.8" that was set on December 16, 2017. At least through the first week of December, precipitation will likely be below to much below normal in the region. Nevertheless, a clipper system could bring a period of light snow or flurries to parts of the region late Tuesday night into Wednesday. The NAO fell to a preliminary -2.751 on September 24th (all-time September record: -2.371, September 12, 1971). That was the 9th lowest value on record. La Niña winters following September cases where the NAO fell to -1.900 or below featured a predominantly positive NAO. The most recent such winters were 2016-2017 and 2022-2023. The mean temperatures for those winters in New York City were 39.3° and 41.0° respectively. The 1991-2020 normal value is 36.2°. A warmer to much warmer than normal outcome is favored by the November run of the ECMWF for Winter 2024-2025. The ENSO Region 1+2 anomaly was +0.8°C and the Region 3.4 anomaly was -0.1°C for the week centered around November 20. For the past six weeks, the ENSO Region 1+2 anomaly has averaged 0.00°C and the ENSO Region 3.4 anomaly has averaged -0.23°C. Neutral ENSO conditions may still evolve into a La Niña event during the winter. Uncertainty as to whether a La Niña will actually develop continues to increase. The SOI was +6.80 today. The preliminary Arctic Oscillation (AO) was -1.478 today.