

Roger Smith
-
Posts
5,927 -
Joined
-
Last visited
Content Type
Profiles
Blogs
Forums
American Weather
Media Demo
Store
Gallery
Everything posted by Roger Smith
-
Table of forecasts for September 2022 FORECASTER ________________ DCA _NYC _BOS __ ORD _ATL _IAH ___ DEN _PHX _SEA Stormchaser Chuck __________+4.0 _+4.0 _+3.5 __ +3.5 _+3.5 _+3.5 __ +3.0 _+2.5 _ -1.0 wxallannj _____________________+2.8 _+3.0 _+3.2 __ +1.8 _+2.6 _ -1.0 ___ +1.2 _+2.6 _+2.4 RJay _________________________ +2.7 _+3.0 _+2.2 __ +1.5 _ -1.0 _ -1.5 ___ +1.5 _+0.5 _+4.0 Tom __________________________+2.1 _+2.2 _ +2.1 __ +1.1 __ +0.4 _+0.6 __ +1.4 _+0.5 _+0.1 Roger Smith _________________ +2.0 _+2.5 _ +3.0 __ +2.5 _+1.5 _+0.8 __ +3.5 _+1.5 _+3.0 BKViking _____________________ +2.0 _+2.2 _+2.2 __ +1.2 _ -0.7 _ -0.9 __ +1.9 _+0.7 _+3.0 ___ Consensus _______________ +1.9 _ +2.2 _+2.2 __ +1.2 _+0.6 _+0.4 __ +1.6 _+1.2 _+1.6 hudsonvalley21 ______________ +1.7 _+2.1 _ +2.5 __ +0.7 _ +0.3 _+0.9 __ +1.9 _+1.3 _+0.2 so_whats_happening _________+1.4 _+1.5 _ +2.1 ___ +1.7 _+0.7 _+0.6 __ +1.2 _+0.7 _+2.5 wxdude64 ____________________+1.3 _+1.5 _ +1.7 __ +0.8 _ +0.2 _ -0.2 __ +1.7 _+1.1 _+1.4 DonSutherland1 ______________ +1.1 _+1.5 _ +2.0 __ +1.2 _ +1.2 _ +0.2 __ +1.3 _+2.0 _+1.8 RodneyS ______________________+1.0 _+1.3 _ +1.3 __ +0.5 _ -0.6 _ -0.6 __ +3.1 _+0.8 _+1.0 Scotty Lightning ______________+1.0 _+1.0 _ +1.0 __ +1.0 _ +1.5 _ +1.5 __ +1.0 _+1.5 _+0.5 ___ Normal ____________________ 0.0 __ 0.0 __ 0.0 ____0.0 __ 0.0 __ 0.0 ___ 0.0 __0.0 __ 0.0 __________________________________________________ Warmest and coldest forecasts are color coded. Normal is colder than all forecasts for DCA,NYC,BOS,ORD,DEN,PHX
-
August 2022 temperature forecast contest
Roger Smith replied to Roger Smith's topic in Weather Forecasting and Discussion
===<<< __________ Annual Scoring Report (Jan - Aug 2022) _____________>>>=== Total scores for each location, region ... best scores for locations in red, for regions in bold type. With many scores similar in August, there was only one set of changes in ranks; RodneyS is now fourth and Tom fifth. Consensus has fallen to third place behind DonSutherland1, and Normal remained between 10th and 11th, and also there is a prorated score for Stormchaser Chuck (4154), based on 8/5 times actual score, and with that he would now fall just below the total of our 8th ranked forecaster. FORECASTER ___________ DCA_NYC_BOS__east_ ORD_ATL_IAH __ cent _ c/e __ DEN_PHX_SEA __west __ TOTAL wxdude64 ______________553 _581 _589 __1723 __555 _589_ 456__1600_3323 __556 _632 _493 __1681 ____5004 DonSutherland1 ________ 634 _588 _572__1794__580 _540 _372__1492 _3286 __480 _648 _558 __1686 ____4972 ___ Consensus ___________574 _584 _550 __1708__524 _570 _408__1512 _3210__584 _636 _539 __1759 ____4969 so_whats_happening ____532 _554 _584__1670__533 _574_ 412__1519 _ 3189 __ 548 _636 _576 __1760 ____4949 RodneyS ________________ 568 _512 _492 __1572__446 _626 _482__1554 _3126 __612 _654 _546 __1812 ____4938 Tom _____________________ 571 _587 _523 __1681__522 _545 _523__1590 _3271 __599 _547 _472 __ 1618 ____4889 wxallannj ________________508 _532 _524 __1564 __490 _518 _430__1438 _3002 __646 _604 _566 __1816____4818 hudsonvalley21 __________534 _586 _570 __1690__502 _524 _408__1434 _3124__522 _620 _502 __ 1644 ____4768 BKViking ________________ 566 _578 _530 __1674__456 _496 _384__1336 _3010 __596 _582 _514 __1692 ____4702 RJay _____________________536 _606 _588 __1730__477 _516 _396__1389 _3119 __574 _492 _489 __1555 ____ 4674 Scotty Lightning _________546 _534 _510 __1590 __470 _532 _450__1452 _ 3042 __512 _594 _420__1526____4568 _____ Normal _____________568 _502 _440 __1510 __484 _534 _420 __1438 _ 2948 __486 _548 _456__1490____4438 Roger Smith _____________ 474 _432 _334 __1240 __404 _436 _378 __1218 _2458 __582 _600 _573__1755____4213 Stormchaser Chuck (5/8)_334 _374 _367 __1075 __298 _ 414 _248 __960 __2035 __304 _373 _255 __932____2967 __ __ prorated Stormchaser Chuck would compare at 4747 total points. ========================================= Best Forecasts _ * tied for high score with one other forecaster __ ^ tied for high score with three others (Mar). FORECASTER __________ DCA_NYC_BOS _east_ ORD_ATL_IAH_ cent _c/e__ DEN_PHX_SEA _west _ total wxdude64 _______________ 0 ___ 0 ___ 2 ____ 0 ___ 1*___ 1 ___ 0 ___ 0 ___ 0 ___ 0 ___ 1 ___ 0 ___ 0 ____1 __ Jan DonSutherland1 __________4*^__ 2 ___ 0 ____ 1 ___ 1 ___ 0 ___ 0 ___ 0 ___ 1 ___ 0 ___ 1 ____3 ____1 ____2 __ Feb,May ___ Consensus ___________ 0 ___ 0 ___ 0 ____ 0 ___ 0 ___0 ___ 0 ___ 0 ___ 0 ___0 ___ 0 ___ 0 ____ 0 ___ 0 so_whats_happening _____ 1*___ 0 ___ 1 ____ 1 ___ 1 ___ 0 ___ 0 ___ 0 ___ 1 ___ 0 ___ 1 ___ 1 ___ 1*____ 1 __ Jul RodneyS _________________ 1* ___ 0 ___ 1*____ 0 ___ 0 ___ 3 ___ 2 ___ 3 ___ 1___ 2*___ 0 ___ 1 ___0 ____ 0 Tom ______________________ 1^___ 2 ___ 1 ____ 2 ____0 ___ 2 ___ 2 ___ 2 ___ 1 ___ 1*___ 1 ___ 0 ___ 0 ____ 1 __ Mar wxallannj ________________ 0 ___ 0 ___ 0 ____ 0 ___ 0 ___ 0 ____ 1 ___ 0 ___ 0 ___ 2*___ 1 ___ 1*___ 2 ____ 0 hudsonvalley21 __________ 0 ___ 1 ___ 0 ____ 0 ___ 1*___ 0 ___ 1*___ 0 ___ 0 ___ 0 ___ 1 ___ 1*___ 1*____ 0 BKViking _________________ 2^___ 0 ___ 0 ____ 0 ___ 1 ___ 0 ___ 0 ___ 0 ___ 0 ___ 0 ___ 0 ___ 0 ___ 0 ____ 0 RJay ______________________ 1^___ 0 ___ 2*____ 1 ___ 0 ___ 0 ___ 1*___ 1 ___ 1 ___ 1 ___ 0 ___ 1 ___ 0 ____ 1 __ Apr Scotty Lightning __________ 1*___ 0 ___ 0 ____ 0 ___ 1*___ 0 ___ 0 ___1 ___ 0 ___ 0 ___ 0 ___ 0 ___ 0 ____ 0 ___ Normal ________________ 2 ___ 1 ___ 0 ____ 0 ___ 1 ___ 1 ___ 1 ___ 1 ____0 ___ 0 ___ 1 ___ 1 ____ 0 ____ 0 Roger Smith _______________ 1 ___ 2 ___ 1*____2 ___ 2*___ 0 ___ 2 ___ 0 ___ 1 ___ 4*___ 1 ___ 2*___ 3 ____ 2 __Jun, Aug Stormchaser Chuck _______ 1 ___ 1 ___ 2*____ 1 ___ 2 ___ 2 ___ 0 ___ 1 ___ 2 ___ 0 ___ 0 ___ 1*___ 1 ____ 0 ========================= EXTREME FORECAST SCORING (second total in brackets adjusts for tied wins which are indicated by * in monthly logs only -- so far this has occurred eleven times, once for SEA in Feb, once for IAH in Apr, once for DEN in May and again Aug, once for BOS in June, once for SEA in June, once for DCA in July and also Aug, once for BOS in July and once for ORD in July and again Aug.) (in March, four shared a win for DCA shown by ^ -- this counts as 0.25 in the second bracketed total). (wins for Normal are in addition to forecaster wins and do not replace them _ Normal is not charged with a loss _ would have done so in April for DEN) So far, 55 of 72 forecasts qualify, 24 warmest and 31 coldest; Jan 0-5, Feb 4-4, Mar 2-2, Apr 3-6, May 4-2, June 3-4, July 4-3, Aug 4-5. FORECASTER ____________ Jan _Feb _Mar _Apr _May _Jun_ Jul _Aug __TOTAL (adj for ties) Roger Smith _____________ --- _ 1- 1 _ 2-0 _5-1_ ---_ 4**0 _ 0-3 _3**0 _ 15-5 (13-5) DonSutherland1 _________ --- _ 4*-0_ 1^-0_1-0_ 1-0 _ 1-0 _ 1*-0 _ --- ___ 9-0 (7.25 - 0) RodneyS _________________ --- _ 1-0 _ --- _ --- _ 2*-0_ 1*-0 _2*-0_3-2 ___9-2 (7.5 -2) Stormchaser Chuck ______ 2-1 _ --- _ --- _ --- _ 3-0 _2-0 _1*-0 _ --- ___ 8-1 (7.5 - 1) Tom ______________________ 1-0 _ 1-0 _ 2^-0_1-0_ 1*-0_ ---- _ --- _ --- ___ 6-0 (4.75 - 0) RJay _____________________ --- _ --- _ 1^-0_ 1*-0_--- _ ---- _ 3*-0 _ 1-1___ 6-1 (4.25 - 1) ____ Normal ______________ --- _ 1-0 _ --- _ 1-0 _ --- _ 2-0 _ _ 1-1 _ 1-0 ___ 6-1 wxdude64 ________________1-0 _ 3*-0_ --- _ --- _ --- _ ---- _1*-0 _--- ___ 5-0 (4.0 - 0) so_whats_happening ____ 1-0 _ --- _ --- _ 1-0 _ --- _ ---- _ ---- _ 1*-0 __ 3-0 (2.5 - 0) hudsonvalley21 ___________--- _ --- _ --- _ 1*-1 _ --- _ ---- _1*-0 _ 1-0 ___ 3-1 (2.0 - 1) wxallannj _________________--- _ --- _ 0-1 _ ---- _ --- _ 1*-0 _ 1-0 _ 1*-1 ___3-2 (2.0 -1) BKViking _________________ --- _ --- _ 1^-0_ --- _ --- _ ---- _ ---- _ --- ___ 1-0 (0.25 - 0) Scotty Lightning _________ --- _ --- _ --- _ ---- _ --- _ ---- _ ---- _ 2**0__ 2-0 (1 - 0) =============================== (Normal is not considered for ties and can score a loss when 0.0 is between a win and a loss, but not when 0.0 is lower than a winning low forecast) -
RJay if you call in here, I was trying to send you a PM re Sept contest but your inbox may be full, anyway, whatever, have a great weekend also.
-
+2.0 _ +2.5 _ +3.0 __ +2.5 _ +1.5 _ +0.8 __ +3.5 _ +1.5 _ +3.0
-
IIRC the GFS was showing 100+ (at NYC) in August back in late July and the highest NYC got was 97, so perhaps the GFS does not have the foliage in its toolbox, or maybe it just overdoes heat. That being said, any record from 1881 has got to be in some jeopardy in the modern climate with the current urban heat island compared to 1881. September 1881 is actually one of the warmest months relative to normal especially when you factor in that urban heat island (which then could not have been much more than 20% of today's version). It stayed warm into the first few days of October and set records both on the 7th (that all-time 101F referenced in the thread) and later in the month on several dates. There are a remarkable number of warm Septembers ending in the digit 1, 1891, 1921, 1931, 1961 for the longer term past, all very warm. 1941 had record heat in early October instead (and holds the monthly maximum of 94F at NYC). Both September and October 1971 were quite warm, especially October.
-
Predict the temperature anomalies (F deg relative to 1991-2020) for DCA _ NYC _ BOS __ ORD _ ATL _ IAH ___ DEN _ PHX _ SEA Deadline for on-time entries will be 06z Thursday September 1st. Thanks for entering.
-
I chose a great place to retire (maybe not), we have had the hottest June, July and August on record here in the past two years (June and July last year, August this year). So far running 4 C (7 F) above normal this month, almost every day has hit some value between 95F and 102F. That was the heat that was supposed to drift further east but ended up parking over top of western Canada and the Pac NW all summer (early June was cool/wet so the fire situation has not ramped up the way it did last year). And of course in 2021 we had the heat dome (June 26 to July 3 here) and an all-time daily maximum record of 113 F (44.8 C) on June 30th. July last year stayed very hot all month and ended up 5.3 C deg above normal (25.7 C). We have relatively cool nights so the hotter months average well into the mid-30s C or around 95-96 F. That's a big anomaly for a summer month in a warm climate zone. Except for a few pockets further west, this is about the hottest and driest place in Canada in the summer (near the Columbia valley where the river crosses into WA state).
-
August 2022 temperature forecast contest
Roger Smith replied to Roger Smith's topic in Weather Forecasting and Discussion
Final Scoring for August 2022 FORECASTER _____________DCA_NYC_BOS_east_ORD_ATL_IAH__cent __ c/e __DEN_PHX_SEA_west___TOTAL Roger Smith _______________86 _ 72 _ 68 __ 226 __ 92 _ 62 _ 50 __ 204 __430__ 96_ 58 _ 98 __ 252 __ 682 RodneyS __________________ 84 _ 54 _ 42 __ 180 __ 80 _ 98 _ 88 __ 266__446__ 66 _ 90 _ 62 __ 218 __ 664 so_whats_happening _____100 _ 60 _ 48 __ 208 __ 84 _ 68 _ 56 __ 208 __416__ 80 _ 56 _ 80 __ 216 __ 632 wxallannj __________________78 _ 84 _ 76 __ 238 __ 72 _ 46 _ 50 __ 168 __406__ 96_ 28 _ 96 __ 220 __ 626 DonSutherland1 ___________90 _ 76 _ 60 __ 226 __ 76 _ 62 _ 84 __ 222 __448__ 40 _ 68 _ 68 __ 176 __ 624 ___ Consensus ____________ 86 _ 72 _ 62 __ 220 __ 82 _ 58 _ 56 __ 196 __416 __ 70 _ 54 _ 70 __ 194 __ 610 wxdude64 _________________86 _ 72 _ 62 __ 220 __ 80 _ 58 _ 60 __ 198 __418__ 70 _ 54 _ 54 __ 178 __ 596 hudsonvalley21 ___________ 72 _ 88 _ 66 __ 226 __ 66 _ 48 _ 56 __ 170 __396__ 70 _ 60 _ 64 __ 194 __ 590 Tom _______________________ 86 _ 68 _ 52 __ 206 __ 82 _ 58 _ 62 __ 202 __408__ 64 _ 40 _ 70 __ 174 __ 582 RJay ______________________ 70 _ 86 _ 90 __ 246 __ 52 _ 46 _ 38 __ 136 __382__ 94 _ 18 _ 82 __ 194 __ 576 Scotty Lightning __________100 _ 56 _ 40 __ 196 __ 92 _ 56 _ 68 __ 216 __412__ 56 _ 48 _ 58 __ 162 __ 574 ___ Normal _________________ 80 _ 36 _ 20 __ 136 __ 88 _ 86 _ 98 __272 __408 __ 36 _ 78 _ 48 __ 162 __ 570 BKViking __________________ 76 _ 80 _ 70 __ 226 __ 58 _ 34 _ 50 __ 142 __ 368__ 76 _ 38 _ 74 __ 188 __ 556 ______________________________________________ EXTREME FORECAST REPORT RodneyS has a mixed bag of results from coldest forecasts, wins for ATL, IAH and PHX, and losses for DCA and ORD where Scotty Lightning takes shared wins for both, along with so_whats_happening at DCA only and Roger Smith at ORD only. Normal also has a win for IAH. For SEA, rather close finish between wxallannj (+2.8) and Roger Smith (+2.5), their math said 2.6 (mine said 2.7) so it's a loss-win outcome on this one. DEN was the same story with the outcome (+3.2) giving RJay (+3.5) a loss and Roger Smith and wxallannj (+3.0) a shared win. NYC, BOS are wins for highest forecasts of hudsonvalley21 (NYC +2.6) and RJay (BOS +3.5) . __________________________________________________ Annual update to follow later today I hope. The scores are close so there won't be major changes. -
Summer max contest -- final results posted
Roger Smith replied to Roger Smith's topic in Mid Atlantic
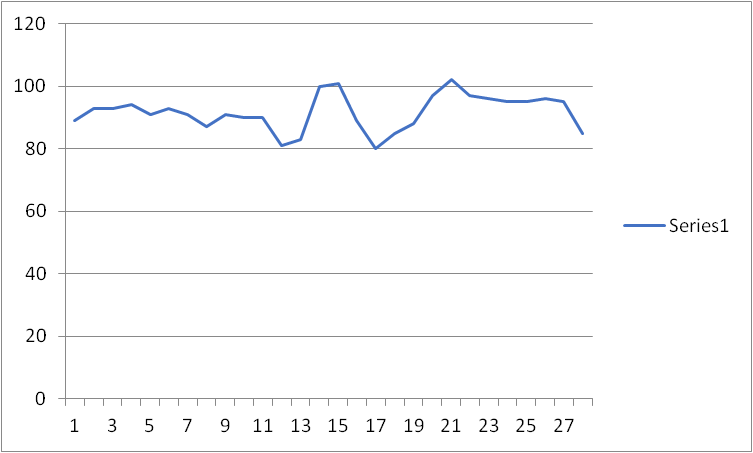
I have re-ordered the table of forecasts to show the current standings. FORECASTER _____________ DCA _ IAD _ BWI _ RIC ____ Errors to date ____ TOTALS LittleVillageWx _ (21) ______ 98 __ 97 __ 99 __ 99 _______ 1 _ 0 _ 0 _ 1 _______ 2 WinterWxLuvr (9) ________ 100 __ 98 __ 99 __ 99 _______ 1 _ 1 _ 0 _ 1 _______ 3 tplbge _ (19) _______________98 _ 100 __ 99 __ 99 _______ 1 _ 3 _ 0 _ 1 _______ 5 87storms _ (7) ___________ 100 __ 99 _ 100 _ 100 _______ 1 _ 2 _ 1 _ 2 _______ 6 Weather53 _ (17) __________99 __ 99 _ 100 _ 101 _______ 0 _ 2 _ 1 _ 3 _______ 6 __ tiebreaker is 1st higher dep GramaxRefugee _ (5) _____ 99 _ 100 _ 101 _ 100 _______ 0 _ 3 _ 2 _ 2 _______ 7 Eskimo Joe _ (10) _________ 99 _ 100 _ 101 _ 100 _______ 0 _ 3 _ 2 _ 2 _______ 7 __ tiebreaker is order of entry NorthArlington101 _(1) ____101 __ 98 __ 99 _ 102 _______ 2 _ 1 _ 0 _ 4 _______ 7 __ tiebreakers (1st higher dep, then order of entry) biodhokie _ (6) ____________99 _ 101 _ 100 _ 100 _______ 0 _ 4 _ 1 _ 2 _______ 7 __ tiebreaker is order of entry WxWatcher007 _ (25) _____99 __ 99 _ 100 _ 102 _______ 0 _ 2 _ 1 _ 4 _______ 7 __ tiebreaker is order of entry toolsheds _ (13) ___________99 _ 100 _ 100 _ 102 _______ 0 _ 3 _ 1 _ 4 _______ 8 nw baltimore wx (15) _____100 _ 100 _ 101 _ 101 _______ 1 _ 3 _ 2 _ 3 ________ 9 peribonca _ (2) ____________99 _ 100 _ 102 _ 101 _______ 0 _ 3 _ 3 _ 3 _______ 9 __ tiebreaker is 2nd higher dep (3 vs 2) CAPE __ (24) ______________101 __ 99 _ 100 _ 102 ______ 2 _ 2 _ 1 _ 4 ________ 9 __ tiebreaker is 1st higher dep HighStakes _ (26) _________101 __ 99 _ 101 _ 102 ______ 2 _ 2 _ 2 _ 4 _______ 10 Rhino16 _ (12) _____________101 _ 100 _ 100 _ 102 ______ 2 _ 3 _ 1 _ 4 _______ 10 __ tiebreaker is 2nd higher dep (3 vs 2) WxUSAF __ (27) __________ 100 __ 99 _ 102 _ 102 ______ 1 _ 2 _ 3 _ 4 _______ 10 __ tiebreaker is order of entry RickinBaltimore (14) ______100 _ 101 _ 101 _ 102 _______ 1 _ 4 _ 2 _ 4 _______ 11 nj2va ___ (8) _______________99 _ 101 _ 101 _ 103 _______ 0 _ 4 _ 2 _ 5 _______ 11 __ tiebreaker is 1st higher dep Contest means __________100.4_ 100.5_ 101.3_ 101.9 _____ 1.4 _ 3.5 _2.3 _3.9 ______ 11.1 yoda __ (23) _______________102 _ 100 _ 101 _ 102 ______ 3 _ 3 _ 2 _ 4 ______ 12 Wxdavis5784 _ (11) ________98 _ 101 _ 103 _ 102 _______ 1 _ 4 _ 4 _ 4 ______ 13 StormchaserChuck! (4) ___ 103 _ 102 _ 101 _ 101 ______ 4 _ 5 _ 2 _ 3 ______ 14 wxdude64 _ (18) __________101 _ 100 _ 102 _ 104 ______ 2 _ 3 _ 3 _ 6 ______ 14 __ tiebreaker is 1st higher dep mattie g _ (16) ____________100 _ 103 _ 102 _ 102 ______ 1 _ 6 _ 3 _ 4 ______ 14 __ tiebreaker is 2nd higher dep (4 vs 3) PrinceFrederickWx _(3) ___102 _ 100 _ 104 _ 103 ______ 3 _ 3 _ 5 _ 5 ______ 16 Roger Smith _ (20) ________ 104 _ 106 _ 105 _ 107 _____ 5 _ 9 _ 6 _ 9 ______ 29 George BM _ (22) _________ 108 _ 109 _ 110 _ 110 ______ 9 _12 _11 _12 ______ 44 ____________________________________ Tiebreaker info relates to the entry above, explaining why the entry with the note is ranked below that one. In one case a rank is a combination of two different tie breakers relating to entries above then below _________________ ____________________ (current as of July 22) _____ 99 __ 97 __ 99 __ 98 (when recorded) _________ 6/17 _ 8/04 _ 8/04 _7/21* * tied 7/24 This table will be adjusted if any new seasonal max values are reported. -
August 2022 temperature forecast contest
Roger Smith replied to Roger Smith's topic in Weather Forecasting and Discussion
Anomalies and projections ... _________________________ DCA _NYC _BOS __ ORD _ATL _IAH ___ DEN _PHX _SEA 12th ___ (anom 11d) ____ +2.9 _+5.2 _+6.3 ___+1.6 _-0.3 _+0.8 __ +5.1 _-1.7 _+0.7 22nd __ (anom 21d) ____ -0.1 _ +2.6 _ +3.9 ___ 0.0 _-1.2 _ -0.1 ___+3.1 _-2.2e_+2.1 30th __ (anom 29d) ____+0.8 _ +3.1 _ +3.6 ___+0.5 _-0.9 _-0.1 ___+2.9 _-1.5 _+2.3 12th __ (p anom 21d) ___ +1.7 _+3.5 _+4.0 ___+1.0 _-0.5 _+0.5 __ +4.0 _-1.5 _+1.5 12th __ (p anom 28d) ___+1.2 _+2.5 _+3.0 ___+0.5 _-0.5 _+0.5 __ +3.5 _-1.5 _+2.0 22nd __(p anom 31st) __ 0.0 _ +2.0 _ +3.0 ___ 0.0 _ -1.0 _ 0.0 ___ +3.0 _-2.0 _+2.0 30th __ (p anom 31st) __+1.0 _+3.0 _+3.5 ___ +0.5_-1.0 _-0.2 ___ +3.0 _-1.5 _+2.5 end of month anoms ___+1.0 _+3.2 _+4.0 ___ +0.6 _-0.7 _-0.1 ___+3.2 _-1.1 _+2.6 12th _ The seasonal max updates are still in the July thread for now. Will move that over here towards the end of August, no recent changes other than NYC to 97F. Projections are based on gradually cooling regime in east, fairly static (continued rather warm except in PHX) further west. 22nd _ The anomaly for PHX is estimated from -2.1 after 20 days and a probable -5 or so for 21st. The projections are mostly just extensions of current trends with the larger positive anomalies in the northeast likely to come under some stress from mostly near average temperatures ahead, western locations look likely to maintain trends. The seasonal max contest is still back in the July thread and has seen no further updates since NYC hit 97F earlier this month. Will probably just bring it over to September and start scoring it around first week. 30th _ Anomalies updated, warmer in east. 1st _ Final values have been posted, scoring will be adjusted where necessary by later today. -
In the above list, is there any way for you to check the entry that is supposed to end on June 24, 1894 at 3260d because in my data base I do not see any temps above 96 in 1894 and the termination of <99 seems to be July 3, 1898 (100F) which would be 4730 days from the apparently accurate starting date of July 21, 1885 (99F) which generated the 3260d listed. I'm wondering if the program generated an interval from a missing code, otherwise I have faulty data in my data base for 1894.
-
Summer max contest -- final results posted
Roger Smith replied to Roger Smith's topic in Mid Atlantic
Two of the four locations edged up today with BWI at 99, IAD at 97. DCA stays at previous 99 and RIC at 98. -
August 2022 temperature forecast contest
Roger Smith replied to Roger Smith's topic in Weather Forecasting and Discussion
Table of forecasts for August 2022 FORECASTER _____________ DCA _ NYC _ BOS ___ ORD _ ATL _ IAH ___ DEN _ PHX _ SEA RJay ______________________ +2.5 _ +2.5 _ +3.5 __ +3.0 _ +2.0 _ +3.0 ___ +3.5 _ +3.0 _ +1.7 hudsonvalley21 ___________ +2.4 _ +2.6 _ +2.3 __ +2.3 _ +1.9 _ +2.1 ___ +1.7 _ +0.9 _ +0.8 BKViking __________________ +2.2 _ +2.2 _ +2.5 __ +2.7 _ +2.6 _ +2.4 ___ +2.0 _ +2.0 _ +1.3 wxallannj __________________ +2.1 _ +2.4 _ +2.8 __ +2.0 _ +2.0 _ +2.4___ +3.0 _ +2.5 _ +2.8 Roger Smith _______________ +1.7 _ +1.8 _ +2.4 __ +1.0 _ +1.2 _ +2.4 ___ +3.0 _ +1.0 _ +2.5 wxdude64 _________________+1.7 _ +1.8 _ +2.1 ___ +1.6 _ +1.4 _ +1.9 ___ +1.7 _ +1.2 __ +0.3 ___ Consensus ____________ +1.7 _ +1.8 _ +2.1 ___ +1.5 _ +1.4 _ +2.1 ___ +1.7 _ +1.2 __ +1.1 Tom _______________________ +1.7 _ +1.6 _ +1.6 ___ +1.5 _ +1.4 _ +1.8 ___ +1.4 _ +1.9 __ +1.1 DonSutherland1 ___________ +1.5 _ +2.0 _ +2.0 __ +1.8 _ +1.2 _ +0.7 ___ +0.2 _ +0.5 _ +1.0 so_whats_happening ______ +1.0 _ +1.2 _ +1.4 __ +1.4 _ +0.9 _ +2.1 ___ +2.2 _ +1.1 __ +1.6 Scotty Lightning __________ +1.0 _ +1.0 _ +1.0 ___ +1.0 _ +1.5 _ +1.5 ____ +1.0 _ +1.5 _ +0.5 RodneyS __________________ +0.2 _ +0.9 _ +1.1 ___ -0.4 _ -0.6 _ +0.5 ___ +1.5 _ -0.6 _ +0.7 ___ Normal __________________0.0 __ 0.0 __ 0.0 ____ 0.0 __ 0.0 __ 0.0 _____ 0.0 __ 0.0 __ 0.0 ______________________________________________ Color codes show warmest and coldest forecasts, Normal is colder than all forecasts for DCA, NYC, BOS, IAH, DEN and SEA -
===<<< ____________ Annual Scoring Report (Jan-July 2022) _______________>>>=== Total scores for each location, region ... best scores for locations in red, for regions in bold type. With many scores similar in July, there were two sets of changes in ranks; so_whats_happening is now third and Tom fourth, while wxallannj is now 6th and hudsonvalley21 is now 7th. Consensus moved up to second place and Normal remained between 10th and 11th, and also there is a prorated score for Stormchaser Chuck (4154), based on 7/5 times actual score, and with that he would again be just ahead of the total of our 8th ranked forecaster. FORECASTER ___________ DCA_NYC_BOS__east_ ORD_ATL_IAH __ cent _ c/e __ DEN_PHX_SEA __west __ TOTAL wxdude64 ______________467 _509 _527 __1503 __475 _531_ 396__1402_2905 __486 _578 _439 __1503 ____4408 ___ Consensus ___________488 _512 _488 __1488__442 _512 _352__1310 _2798__514 _582 _469 __1565 ____4363 DonSutherland1 ________ 544 _512 _512__1568__504 _478 _288__1270 _2838 __440 _580 _490 __1510 ____4348 so_whats_happening ____432 _494 _536__1462__449 _506_ 356__1311 _2773 __468 _580 _496 __1544 ____4317 Tom _____________________ 485 _519 _471 __1475__440 _487 _461__1388 _2863 __535 _507 _402 __1444 ____4307 RodneyS ________________ 484 _458 _450 __1392__366 _528 _394__1288 _2680 __546 _564 _484__1594____4274 wxallannj ________________430 _448 _448 __1326 __418 _472 _380__1270 _2596 __550 _576 _470 __1596____4192 hudsonvalley21 __________462 _498 _504 __1464__436 _476 _352__1264 _2728__452 _560 _438 __1450____ 4178 BKViking ________________ 490 _498 _460 __1448__398 _462 _334__1194 _2642 __520 _544 _440 __1504____4146 RJay _____________________466 _520 _498 __1484__425 _470 _358__1253 _2737 __480 _474 _407 __1361 ____4098 Scotty Lightning _________446 _478 _470 __1394 __378 _476 _382__1236 _ 2630 __456 _546 _362__1364____3994 _____ Normal _____________488 _466 _420 __1374 __396 _448 _322 __1166 _ 2540 __450 _470 _408__1328____3868 Roger Smith _____________ 388 _360 _266 __1014 __312 _ 374 _328 __1014 _2028 __486 _542 _475__1503____3531 Stormchaser Chuck (5/7)_334 _374 _367 __1075 __298 _ 414 _248 __960 __2035 __304 _373 _255 __932____2967 __ __ prorated Stormchaser Chuck would compare at 4154 total points. ========================================= Best Forecasts _ * tied for high score with one other forecaster __ ^ tied for high score with three others (Mar). FORECASTER __________ DCA_NYC_BOS _east_ ORD_ATL_IAH_ cent _c/e__ DEN_PHX_SEA _west _ total wxdude64 _______________ 0 ___ 0 ___ 2 ____ 0 ___ 1*___ 1 ___ 0 ___ 0 ___ 0 ___ 0 ___ 1 ___ 0 ___ 0 ____1 __ Jan DonSutherland1 __________4*^__ 2 ___ 0 ____ 1 ___ 1 ___ 0 ___ 0 ___ 0 ___ 1 ___ 0 ___ 1 ____3 ____1 ____2 __ Feb,May ___ Consensus ___________ 0 ___ 0 ___ 0 ____ 0 ___ 0 ___0 ___ 0 ___ 0 ___ 0 ___0 ___ 0 ___ 0 ____ 0 ___ 0 so_whats_happening _____ 0 ___ 0 ___ 1 ____ 1 ___ 1 ___ 0 ___ 0 ___ 0 ___ 1 ___ 0 ___ 1 ___ 1 ___ 1*____ 1 __ Jul Tom ______________________ 1^___ 2 ___ 1 ____ 2 ____0 ___ 2 ___ 2 ___ 2 ___ 1 ___ 1*___ 1 ___ 0 ___ 0 ____ 1 __ Mar RodneyS _________________ 1* ___ 0 ___ 1*____ 0 ___ 0 ___ 2 ___ 1 ___ 2 ___ 0___ 2*___ 0 ___ 0 ___0 ____ 0 wxallannj ________________ 0 ___ 0 ___ 0 ____ 0 ___ 0 ___ 0 ____ 1 ___ 0 ___ 0 ___ 1 ___ 1 ___ 1*___ 2 ____ 0 hudsonvalley21 __________ 0 ___ 0 ___ 0 ____ 0 ___ 1*___ 0 ___ 1*___ 0 ___ 0 ___ 0 ___ 1 ___ 1*___ 1*____ 0 BKViking _________________ 2^___ 0 ___ 0 ____ 0 ___ 1 ___ 0 ___ 0 ___ 0 ___ 0 ___ 0 ___ 0 ___ 0 ___ 0 ____ 0 RJay ______________________ 1^___ 0 ___ 1*____ 0 ___ 0 ___ 0 ___ 1*___ 1 ___ 1 ___ 1 ___ 0 ___ 1 ___ 0 ____ 1 __ Jun Scotty Lightning __________ 0 ___ 0 ___ 0 ____ 0 ___ 0 ___ 0 ___ 0 ___1 ___ 0 ___ 0 ___ 0 ___ 0 ___ 0 ____ 0 ___ Normal ________________ 2 ___ 1 ___ 0 ____ 0 ___ 1 ___ 1 ___ 0 ___ 0 ___ 0 ___ 0 ___ 1 ___ 1 ___ 0 ____ 0 Roger Smith _______________ 1 ___ 2 ___ 1*____2 ___ 1 ___ 0 ___ 2 ___ 0 ___ 1 ___ 3 ___ 1 ___ 1*___ 2 ____ 1 __ Apr Stormchaser Chuck _______ 1 ___ 1 ___ 2*____ 1 ___ 2 ___ 2 ___ 0 ___ 1 ___ 2 ___ 0 ___ 0 ___ 1*___ 1 ____ 0 ========================= EXTREME FORECAST SCORING (second total in brackets adjusts for tied wins which are indicated by * in monthly logs only -- so far this has occurred eight times, once for SEA in Feb, once for IAH in Apr, once for DEN in May, once for BOS in June, once for SEA in June, once for DCA in July, once for BOS in July and once for ORD in July.) (in March, four shared a win for DCA shown by ^ -- this counts as 0.25 in the second bracketed total). (wins for Normal are in addition to forecaster wins and do not replace them _ Normal is not charged with a loss _ would have done so in April for DEN) So far, 46 of 63 forecasts qualify, 20 warmest and 26 coldest; Jan 0-5, Feb 4-4, Mar 2-2, Apr 3-6, May 4-2, June 3-4, July 4-3. FORECASTER ____________ Jan _Feb _Mar _Apr _May _Jun_ Jul __TOTAL (adj for ties) Roger Smith _____________ --- _ 1- 1 _ 2-0 _5-1_ ---_ 4**0 _ 0-3 __ 12-5 (11-5) DonSutherland1 _________ --- _ 4*-0_ 1^-0_1-0_ 1-0 _ 1-0 _ 1*-0 ___ 9-0 (7.25 - 0) Stormchaser Chuck ______ 2-1 _ --- _ --- _ --- _ 3-0 _2-0 _1*-0 ___ 8-1 (7.5 - 1) Tom ______________________ 1-0 _ 1-0 _ 2^-0_1-0_ 1*-0_ ---- _ --- ___ 6-0 (4.75 - 0) wxdude64 ________________1-0 _ 3-0*_ --- _ --- _ --- _ ---- _ 1*-0 __ 5-0 (4.0 - 0) RodneyS _________________ --- _ 1-0 _ --- _ --- _ 2*-0_ 1*-0 _2*-0 _ 6-0 (4.5 -0) ____ Normal ______________ --- _ 1-0 _ --- _ 1-0 _ --- _ 2-0 _ _ 1-1 __ 5-1 RJay _____________________ --- _ --- _ 1^-0_ 1*-0_--- _ ---- _ 3*-0 __ 5-0 (3.25 - 0) so_whats_happening ____ 1-0 _ --- _ --- _ 1-0 _ --- _ ---- _ ---- ___ 2-0 hudsonvalley21 ___________--- _ --- _ --- _ 1*-1 _ --- _ ---- _1*-0 ___ 2-1 (1.0 - 1) wxallannj _________________--- _ --- _ 0-1 _ ---- _ --- _ 1*-0 _ 1-0 ___ 2-1 (1.5 -1) BKViking _________________ --- _ --- _ 1^-0_ --- _ --- _ ---- _ ---- ___ 1-0 (0.25 - 0) Scotty Lightning _________ --- _ --- _ --- _ ---- _ --- _ ---- _ ---- ___ 0-0 =============================== (Normal is not considered for ties and can score a loss when 0.0 is between a win and a loss, but not when 0.0 is lower than a winning low forecast)
-
August 2022 temperature forecast contest
Roger Smith replied to Roger Smith's topic in Weather Forecasting and Discussion
+1.7 _ +1.8 __ +2.4 __ +1.0 __ +1.2 __ +2.4 ___ +3.0 __ +1.0 __ +2.5 -
Greetings from the source of all heat (sunny 102 F but it's a dry heat) ... anyway, just a reminder to participating NYC forum members that the August temperature forecast contest thread is open. The July scoring has been estimated and almost everybody scored very close to consensus despite a range of forecasts, just all variations cancelling out. This leaves the contest in perhaps the most competitive mode it has seen for many years. Annual update not yet posted but it was close after June so will stay that way, I believe.
-
I am noticing that 1944 had a similar temperature outcome to what the GFS is advertising, four weeks from July 22 to Aug 18 inclusive looked like this, including a number of daily records in mid-August ... DAILY MAX TEMPS JULY 22 to AUG 18 1944 _ AVERAGE 91.7 F daily max ___ 89 93 93 94 91 93 91 87 91 90 90 81 83 100 101 89 80 85 88 97 102 97 96 95 95 96 95 85 After this temperatures were closer to average, peaked again around Sept 2nd and there was a major hurricane up the east coast in mid-September. 9.40" rain fell Sep 12-14 after a very dry interval mid-July to that event. Other years with significant heat in early to mid August before more recent examples would include 1896, 1916, 1918, 1930, 1949, 1955, the latter had hurricane strikes on the east coast almost concurrent with the heat. I would bet that if this GFS predicted pattern verifies, tropical activity will respond within a few weeks. The timing of this 1944 heat wave was such that it did not dominate either July or August so it is less recalled than some, but in terms of a non-calendar month of heat, it rivals anything else.
-
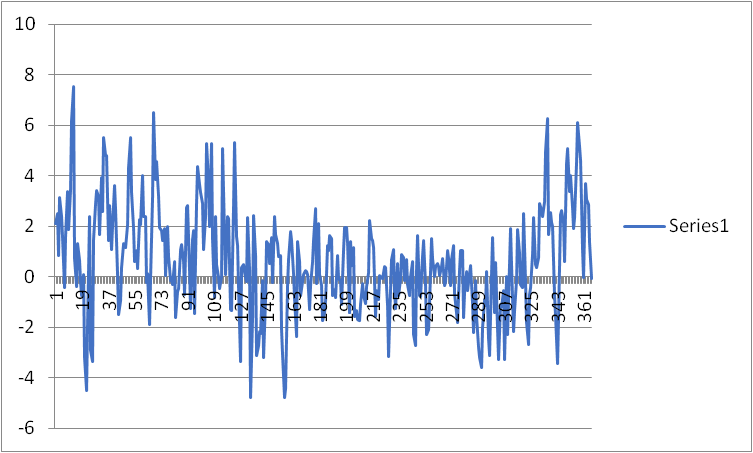
And here's part two, the same analysis for daily minimum temps at NYC ... it picks up the tendency for mid-May and early November to run colder than long-term averages, with several records set in those periods, but I don't think that has anything to do with tree canopies in Central Park. Otherwise would say this looks more like you would expect the warmer modern climate to look, certainly December and February have seen disproportionate warmings. The daily mean graph would be a compromise of the two shown. GRAPH: NYC min temp differentials (1991-2020) minus (1931-1990) averages _ shows reduced to near absent relative temperature suppression May to October _ _ (more representative of generally warming climate trend with seasonal variation) _
-
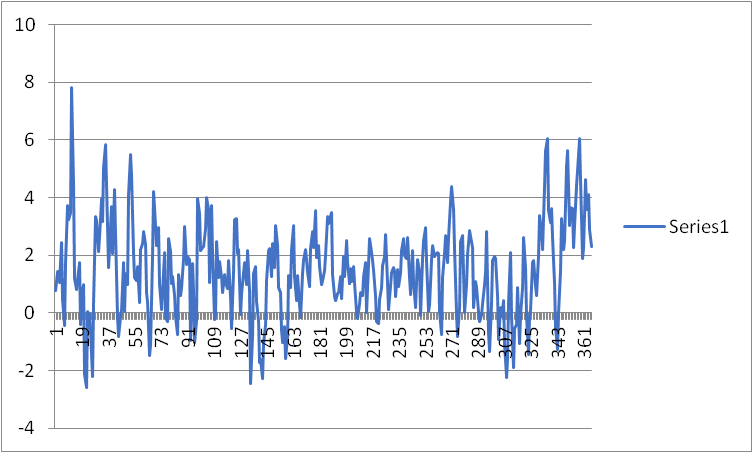
On that subject of NYC tree canopy temperature reduction, this graph shows the effect quite clearly. The graph is the differential of average daily maximum at NYC (1991-2020) minus (1931-1990). I checked graphs for same differential starting 1996 and 2001, very little difference apparent. Clearly the warming of the climate that is evident November to early April is negated by some factor and I have to suppose it is the tree canopy shading. Will post the same analysis for minimum daily temperatures which shows a somewhat similar trend but without suppressing the summer half year entirely, which is what one might expect, cooler days eventually cancelling out to some extent by the different dynamics of nocturnal temperature patterns. I would regard the minimum annual graph as within the range of seasonal variability in the warming climate although perhaps with a residual effect from the cooler daytime readings. GRAPH: NYC max temp differentials (1991-2020) minus (1931-1990) averages _ shows possible relative temperature suppression May to October _
-
Thanks for the detailed responses to my questions about NYC, would it perhaps be correct to assume that the temperatures are more affected on the warmest days and those with light winds? I would think stronger winds might mix the air more and reduce the effect of the tree cover?
-
Since I am doing research involving the NYC data base, I would be interested in thoughts about how long the tree canopy issue has possibly been affecting temperatures and by what amount, also could we say it was an issue only during foliation season? How strong a wind negates it? My belief is that the July 1936 heat wave would have registered something well over 100 F even in today's setting, but that aside, I am looking at comparing data with urban effects considered, and this tree canopy issue is an urban effect in the opposite direction to the urban heat island. My comparisons assumed a gradual rise in the u.h.i. throughout the data set to 1980 and a level signal since 1980 (at some point the urban area gets so large that increases stop happening near its center and are observed further out). The adjustments are more relevant to minimum than maximum temperatures for urban heat islands (typically, if an urban heat island is on the order of 2 F deg, then the average increases will be 0.5 daytime and 3.5 overnight). So I am considering adjusting the urban filter that I applied to include this tree canopy issue, any suggestions? Or is there an argument to be made that larger tree canopies have spread through significant portions of the metropolitan area therefore this is just part of the historical trend and something not to be filtered out, since we don't filter out changes to the agriculture of the great plains etc.
-
Predict the anomalies (F deg) relative to 1991-2020 for DCA _ NYC _ BOS __ ORD _ ATL _ IAH ___ DEN _ PHX _ SEA deadline for on-time entries 06z Monday August 1st.
-
Summer max contest -- final results posted
Roger Smith replied to Roger Smith's topic in Mid Atlantic
As noted in the table of entries, two locations (IAD, RIC) tied their existing seasonal max on Sunday 24th (from early climate reports, will check again later). -
Summer max contest -- final results posted
Roger Smith replied to Roger Smith's topic in Mid Atlantic
Today BWI has moved up to 98F (early climate report, will check again later). The other three locations did not advance today. -
Final scoring for July 2022 SEA reported anomaly of +1.9 has to be checked later as two days missing data could alter the value in a later posting of the CF6. Most scores would change by the same amount also, high score(s) for SEA could be reduced slightly depending on what happens. My estimate is that the missing data will, if inserted into the table, change the anomaly to +1.6. FORECASTER __________DCA_NYC_BOS__east__ORD_ATL_IAH__cent _ c/e _ DEN_PHX_SEA__west___TOTAL so_whats_happening ___ 64 _ 96 _ 74 __ 234 __ 68 _ 86 _ 78 __232 __466 __ 90 _ 92 _ 80 __ 262 ___ 728 RodneyS _______________ 92 _ 76 _ 38 __ 206 __ 88 _ 98 _ 70 __ 256 __462 __ 78 _ 88 _ 84 __ 250 ___ 712 Tom _____________________66 _ 98 _ 68 __ 232 __ 56 _ 74 _ 86 __ 216 __448 __ 86 _ 82 _ 90 __ 258 ___ 706 wxallannj ________________72 _ 88 _ 56 __ 216 __ 68 _ 86 _ 92 __ 246 __462 __ 88 _ 98 _ 54 __ 240 ___ 702 ___ Consensus __________72 _ 84 _ 52 __ 208 __ 72 _ 84 _ 78 __ 234 __442 __ 86 _ 96 _ 72 __ 254 ___ 696 wxdude64 ______________74 _ 78 _ 46 __ 198 __ 90 _ 82 _ 78 __ 250 __448 __ 84 _ 94 _ 54 __ 232 ___ 680 RJay ____________________52 _ 90 _ 82 __ 224 __ 38 _ 64 _ 82 __ 184 __408 __ 98 _ 64 _ 98 __ 260 ___ 668 hudsonvalley21 _________80 _ 86 _ 50 __ 216 __ 90 _ 84 _ 58 __ 232 __448 __ 68 _ 90 _ 58 __ 216 ___ 664 Scotty Lightning ________72 _ 80 _ 52 __ 204 __ 78 _ 84 _ 82 __ 244 __448 __ 52 _ 96 _ 62 __ 210 ___ 658 BKViking________________76 _ 80 _ 50 __ 206 __ 46 _ 62 _ 90 __ 198 __404 __ 92 _ 84 _ 78 __ 254 ___ 658 StormchaserChuck! ____ 48 _ 84 _ 82 __ 214 __ 38 _ 78 _ 58 __ 174 __388 __ 92 _ 84 _ 92 __ 268 ___ 656 DonSutherland1 ________ 92 _ 68 _ 42 __ 202 __ 82 _ 94 _ 62 __ 238 __440 __ 58 _ 96 _ 62 __216 ___ 656 Roger Smith ____________88 _ 52 _ 28 __ 168 __ 88 _ 76 _ 62 __ 226 __394 __ 62 _ 86 _ 66 __ 214 ___608 ___ Normal ______________98 _ 60 _ 32 __ 190 __ 98 _ 86 _ 42 __ 226 __416 __ 42 _ 76 _ 62 __180 ___ 596 ====================================== EXTREME FORECAST REPORT DCA (+0.1) _ Win for DonS and RodneyS (both +0.5) and Normal, loss for Roger Smith (-0.5) NYC (+2.0) _ did not qualify (third warmest forecast high score) BOS (+3.4) _ Win for RJay and StormchaserChuck (+2.5). ORD (-0.1) _ Win for wxdude64 and hudsonvalley21 (both +0.4) and Normal, loss for Roger Smith (-0.7) ATL (+0.7) _ Win for RodneyS (+0.8), loss for Roger Smith (-0.5) and Normal (0.0) IAH (+2.9) _ Win for wxallannj (+2.5) DEN (+2.9) _ Win for RJay (+3.0) PHX (+1.2) _ did not qualify, outcome close to consensus forecasts. SEA (+1.9) _ Win for RJay (+2.0)* _______ *Data incomplete, result may change if SEA finishes below +1.7.

