Terpeast
-
Posts
6,687 -
Joined
-
Last visited
Content Type
Profiles
Blogs
Forums
American Weather
Media Demo
Store
Gallery
Everything posted by Terpeast
-
Flurries in ashburn
-
Cloudy again. All is well haha
-
Sunshine coming through the clouds here too lol 36/16
-
Probably a tad bullish. I'd go with a compromise between 3k nam and hrrr. Still 3-6" for dc metro.
-
Hrrr not as good as 12z, but still better than 11z and earlier runs. 0.4" qpf at DCA and still snowing lightly. still gives 3-5" dc metro area, 2-4" NW suburbs. I think hrrr is just too dry.
-
Definitely happy with a later start time, for two reasons. One is like you said above, and second I have errands to do today and it has to be today.
-
Yep. Plan your jebwalks accordingly and take pictures!
-
He shoulda gone to EZF
-
Yeah plenty reason to be nervous about hrrr. But if it makes you feel better, it ticked north at 11z and the new 12z filled out the moisture fetch on the backside.
-
That is a great fetch. I’m thinking the Nam 3k is going to be more right than the hrrr because the nam strengthens or maintains fetch strength while the hrrr weakens it.
-
30/19. Models look a tick south but still good for 3-5 mby
-
Gfs adamant on double digit totals south of dc close to RIC but the wakefield wfo isn’t having any of it.
-
Toss
-
Dropped to 29
-
Its close but ya its snow, i dont think sleet makes it that far up. Maybe quantico or dumfries
-
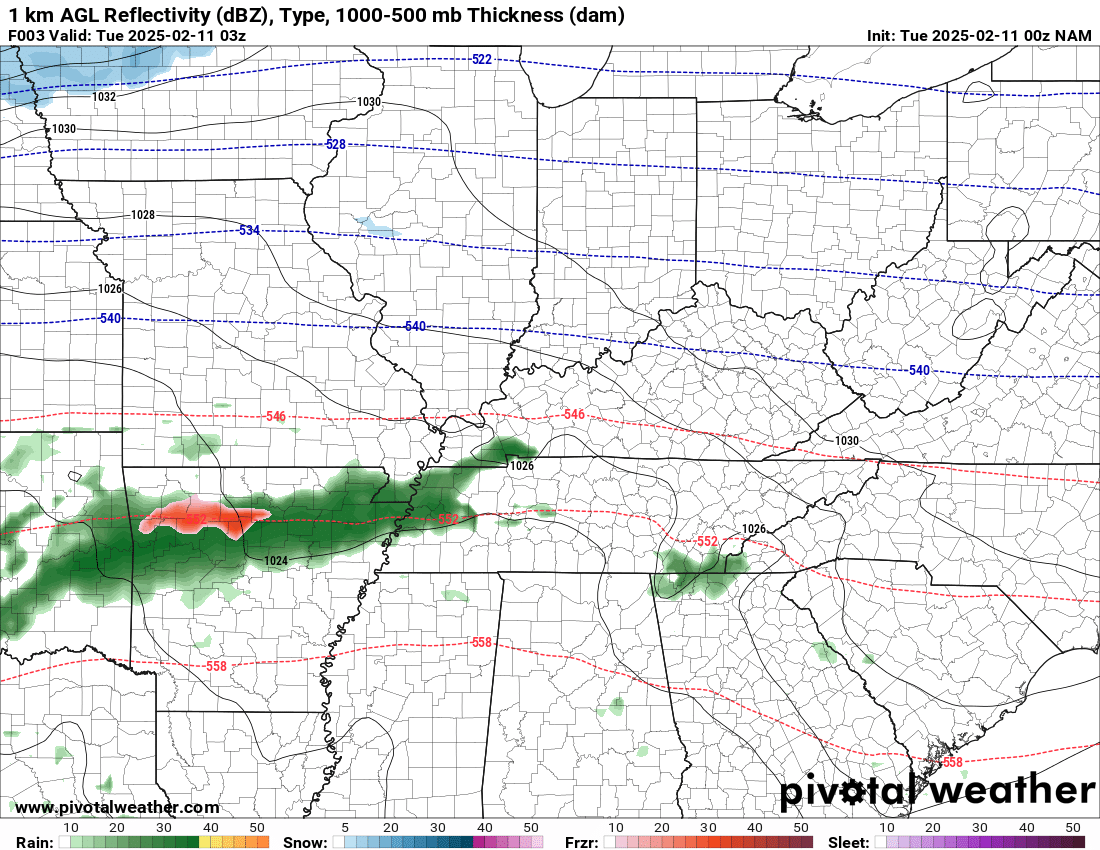
I think 3k is realistic with snow amounts, moreso than 12k nam
-
3k has intensifying rates at around 2-3 pm with temps dropping to freezing
-
3k nam has sleet making it up to DCA
-
NAM 12k a solid 6-9” for dc metro
-
Yep, roughly. But stickage and road caving by 4 pm imo
-
At minimum 9 hours of heavy snow, 0.5-1+”/hr rates.
-
Nam 12k at hour 21 is a pummeling. Let’s see what the higher res counterpart says
-
Check the sounding. It’ll be snow. May not stick well at first though
-
33/17