

psuhoffman
-
Posts
27,419 -
Joined
-
Last visited
Content Type
Profiles
Blogs
Forums
American Weather
Media Demo
Store
Gallery
Everything posted by psuhoffman
-
It starts as a brief period of snow before a flip to rain...in extreme northern Vermont.
-
Who is hugging anything. I see a lot of analysis of the different looks with discussion of possible variations we might see and all the options. But yes the NWP has a part in that. How do you suggest we analyze the long range? Fuzzy caterpillars and wives tales about fog?
-
I am EVERYONE!!!!
-
Very unusual but the euro op was kinda doing it too. When under attacks by waves the tpv has been easy to beat around this year. probkem has been at times the mid latitude patterns set up perfectly to let the tpv sit over the pole and spin. Maybe that’s a sign the qbo is helping a little. Last year was a reverse when wave after wave would blast the tpv and the guidance at range would develop monster blocking but the tpv wouldn’t budge and kinda just chuckle at us like “that all you got”.
-
It was mostly my fault. I’ve seen that pac look destroy winters a few times and I got spooked. I was wrong (hopefully). The numbers do support the danger of that look but by presenting it the way I did it obviously conveyed more doom than warranted. I did post the good and bad outcomes and said that the bad was only likely if the look persisted past mid month but it was obvious I was nervous and that spooked the resident weenies. I’ll take the blame for that one. ETA: any suggestions what I should do with my reaper check?
-
A central pac ridge that locks in longer than a couple weeks yes. If it’s long enough to cause a strong anomaly centered north of Hawaii but not into the epo region for the whole month of January over 80% of those years went on to a horrible February also. When I threw that nugget out there the look was still too far out to see past it. It was unknown if it was transient or not. Now it looks transient and so not a big deal. But if that pac look had locked in for weeks by late January it would be very unlikely we go on to much improvement according to past instances. Thankfully that fate has been averted for the time being.
-
If we get a epo ridge straight through prime climo we are unlikely to do awful. It would take supreme bad luck not to at least score enough snow to get us out of the disaster category. How good would depend. An epo alone really depends on how other factors line up. Your point about blocking is true. But it doesn’t always go down that way. It depends on other factors too. If there isn’t much stj or a string pna/epo ridge it can be a dry pattern. But if there is a -pna or strong stj it can be a string of storms. Remember from Jan 30 to Feb 11 2010 we for 4 significant snows. Even for moderate snows our odds go up with blocking. But it depends on the setup. If we get a full ridge bridge arc with pna epo NAO and the block is too south we end up with 1977. Frigid and dry. But I’ll take my chances. Honestly we haven’t wasted many blocks due to dry lately. It seems we score a very high percentage of times with blocks lately just they are few and far between. So your not wrong but all things equal I would take my chances with the blocking. One last thought...a best of both worlds imo would be periods of transient blocking that isn’t too extreme and waxes and wanes during a consistent epo ridge. That would be less likely to suppress but enough to keep the track under us.
-
Yea I wasn’t considering that a real issue. Just on that run... I’ll take too much blocking on a long range op run anytime.
-
Too much blocking. Lol. Squashes everything.
-
I dunno the force is strong with Friday happy hour.
-
@WxUSAF would make sense. I was thinking how almost all the years that featured a Jan pac ridge and improved were accompanied by some HL blocking. Just thinking out loud and putting things together but there have been some suggestions that high amplified waves near the MC can preceed a strat event. Those waves would also cause the pattern were in. Also the same processes that would shift the ridge into the epo domain will also apply pressure to the PV. And now suddenly we’re seeing signs of blocking showing up.
-
Before the craziness...if the guidance continues to trend towards more ridging near Hudson Bay there is a chance the system next weekend continues to trend south.
-
@Bob Chill ummmmmmmm
-
It was...of the handful of times that pattern flipped it was mostly from retrogression not progression. However, those composites were mostly years the pac locked in longer than a week so it could be more common when the pac ridge is transient.
-
Great call. I was pessimistic when I saw that huge pac ridge of doom on the guidance. That can be a season destroyer when it locks in but now it seems it was just a transient feature as the mjo traverses the MC.
-
@Bob Chill suddenly both the gfs and euro are showing a lot of red up top in the not so distant future. Could a NAM flip sneak up on us...
-
The best news is those really awful January composites I posted are pretty much out the window. I said about a week ago that if we got to January 15th or so and couldnt see the "other side" we would be in trouble because it would be highly likely that would mean enough of January was consumed by that pattern to make the month fall within that analog set. But its obvious now the anomalous central Pac ridge will only last a week or so and then begin to shift into an EPO ridge. It's only the 10th and the other side is clear and moving closer in time. That makes it very likely the January pattern will not match the set that went on to be really awful winters. We seem to have dodged that bullet.
-
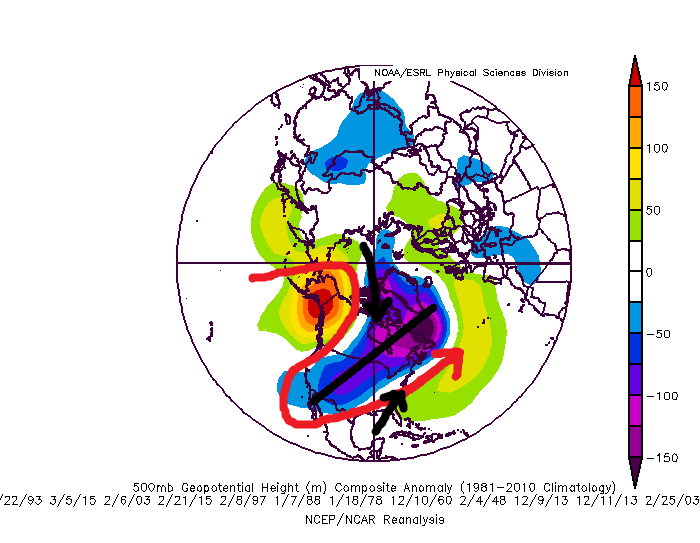
Sorry this is kinda old news but I was busy trying to explain habeas corpus to teenagers... last nights EPS towards the end was moving towards the look we want to get snow in a -EPO+NAO regime. The look before that for a few days with a huge PNA/EPO ridge is a dry look. A huge full lat western ridge overwhelms the pattern and pushes the trough axis too far east for anything to turn the corner usually. What we want is this look...This is the composite of 13 warning level snowfalls for at least a portion of our region. We want the epo ridge building over the top compressing the flow over the CONUS and and an elongated positively tilted trough SW to NE. This allows enough return flow in the SE to get waves up the east coast. Get enough STJ and it can be a really good pattern. Too much SE ridge and it can be frustrating but assuming the EPO ridge flattens the flow enough it works. The EPS was moving towards that look at the end.
-
Don’t have time to go into my full thought now but I liked a lot of what I saw from last nights runs. But while the pattern is supportive of a frozen event in the long range, it’s not the kind of pattern that’s good for picking up the details of a discreet event at long leads. Too progressive for that. Waves that look good at day 10 may turn to crap and things not even on the radar will pop up at day 5.
-
That perfectly summarized what I thought I had said clearly enough. Thanks
-
In the mountains. Or in March where the boundary layer can be warm due to solar before a storm. But thats not really a consistent option here in mid winter. Because there tends to be ridging ahead of storms it would require storms constantly bombing to our southeast and pulling in cold. Not realistic. One fluke storm maybe. Not a pattern. The closest thing is a -NAO pattern like 2010 where it’s not really “cold” when it’s not snowing. Not warm though either. Just not that cold.
-
I agree...but I do chuckle when going into an advertised cold/dry look people say “well we need the cold to have a chance” or “I’ll take me chances with the cold”. Then a few days into it when it becomes apparent we will waste the cold with 10 days of no precip they are like “this sucks we finally get cold and there is no precip for 2 weeks” when the pattern said that was coming from a mile away. Not saying that’s how we go this time just saying I’ve seen that show before.
-
That's why I made that post earlier today saying I would prefer a -EPO -PNA look. That eliminates the cold/dry issue...we would need to get the SE ridge suppressed enough but that setup leads to a snowy outcome more often than the full latitude EPO/PNA ridge. It's very hard to get something to "turn the corner" in that look. Its usually cold/dry. This is assuming a +NAO for both scenarios...
-
One notable improvement on the EPS through day 12, better depth of the trough in the east. That is important because its often what differentiated the "wins" from the "fails" with past similar patterns.
-
eps looks very "Feb 2015" at day 12.


