

Stormchaserchuck1
-
Posts
5,378 -
Joined
-
Last visited
Content Type
Profiles
Blogs
Forums
American Weather
Media Demo
Store
Gallery
Everything posted by Stormchaserchuck1
-

2026-2027 Super El Nino
Stormchaserchuck1 replied to Stormchaserchuck1's topic in Weather Forecasting and Discussion
We get a little low south of the Aleutians Days 5-9. Around Day 10 a ridge is building into the Gulf of Alaska. I guess you can say that's close, but a slight difference west makes it more -PNA. I'm just really looking at the PNA, June will likely be the 5th consecutive month of -pna, and the average is no joke, it's less than -1/month 1965, 1982, and 2023 all had a 4-month streak of -PNA that were broken in June. -
2026-2027 Super El Nino
Stormchaserchuck1 replied to Stormchaserchuck1's topic in Weather Forecasting and Discussion
June is typically not a big month for ENSO to effect the N. Hemisphere pattern, but we continue to see differences in the North Pacific -
2026-2027 Super El Nino
Stormchaserchuck1 replied to Stormchaserchuck1's topic in Weather Forecasting and Discussion
^It updates at 2am? -
I had a nice rainstorm, but no lightning and thunder so technically speaking I still haven't had 1st thunderstorm of the year, despite 4 high risk days (SPC). This one was severe thunderstorm warned, don't know why. The sky was dark but that's about it.
-
2026-2027 Super El Nino
Stormchaserchuck1 replied to Stormchaserchuck1's topic in Weather Forecasting and Discussion
Since the Aurora borealis in May 2024 associated with Solar Max, this big +AO pattern has been happening at the beginning of the warm season for the last 3 years. -
2026-2027 Super El Nino
Stormchaserchuck1 replied to Stormchaserchuck1's topic in Weather Forecasting and Discussion
Massive round of -SOI.. 30-day below -18, which 23-24 never did. 15-16 peaked at -22. 97-98 is the next higher up (although there was 1-month strong dip in Feb 2005). 6 Jun 2026 1013.94 1016.55 -27.42 -18.06 -9.05 5 Jun 2026 1012.20 1015.15 -29.81 -17.33 -8.44 4 Jun 2026 1010.52 1014.25 -35.29 -16.43 -7.77 3 Jun 2026 1010.14 1013.80 -34.80 -15.47 -7.10 2 Jun 2026 1012.48 1015.05 -27.13 -14.79 -6.56 What we have been calling -PDO may have actually been more of a -ENSO decadal state. 82-83 is the real one to beat, that had a streak of 3/4 months <-30 SOI. -
Late May/June 2026 Medium/Long Range
Stormchaserchuck1 replied to JenkinsJinkies's topic in Mid Atlantic
Maybe some strong thunderstorms if we get a good trough over the Upper Midwest/Great Lakes- 259 replies
-
- 1
-

-
- we got burned
- rugpull central
- (and 1 more)
-
2026-2027 Super El Nino
Stormchaserchuck1 replied to Stormchaserchuck1's topic in Weather Forecasting and Discussion
CPC continues to go El Nino in long range STJ predictions -
2026-2027 Super El Nino
Stormchaserchuck1 replied to Stormchaserchuck1's topic in Weather Forecasting and Discussion
Euro and CANSIPS completely different over the EPO domain for the Winter. -
2026-2027 Super El Nino
Stormchaserchuck1 replied to Stormchaserchuck1's topic in Weather Forecasting and Discussion
^You were right about the lagged warming after the SOI. -
Maybe biased a little extreme, but the Euro is legit seasonal model.
-
I would say the more positive the better, main effect of PDO is PNA/EPO which the stronger they go, they stronger our troughs are here on the East Coast. The PDO has steep incline to Winter effect the further in the year you go. Here's the lagged correlation: So Fall PDO is 2x more important than Spring PDO.
-
Big differences between Winter 15-16 and 23-24, probably contributed to something along the lines of the PDO (15-16 was >+1, 23-24 was <-1).
-
There has been much less of them for the last few years, like a fraction! In 2013 when I was in Sedona, AZ there must have been 300+, the sky looked like hell.
-
I have found something interesting, since the 2012, N. Hemisphere Arctic ice melt low, the Summer sea-level pressure state has been reversing the following Winter. In the 2025-2026 ENSO thread, I used this to predict a -AO for Winter 25-26. Here was May-Sept 2025 SLP anomaly: Analogs [10] Following Winter of 10 analogs (+7 months) Winter 25-26: Something to watch this coming warm season... do we get -SLP or +SLP anomaly over the Arctic (60-90N). Since 2012, -SLP has been followed by following cold season -AO, and +SLP has been followed by following cold season +AO. We are currently going more -SLP over the Arctic: Sorry for the multi-posting, each post is an individuated point that can be responded to by itself.
-
-PDO numbers this decade.. 77 straight months of negative: Will warm ENSO break this? May 2026 -1.60 April 2026 -1.28 March 2026 -1.18 February 2026 -0.79 January 2026 -0.87 December 2025 -0.39 November 2025 -1.02 October 2025 -1.82 September 2025 -1.71 August 2025 -2.54 July 2025 -3.83 June 2025 -2.62 May 2025 -1.84 April 2025 -1.07 March 2025 -0.81 February 2025 -1.20 January 2025 -0.97 December 2024 -1.57 November 2024 -2.58 October 2024 -3.24 September 2024 -3.10 August 2024 -2.37 July 2024 -2.62 June 2024 -2.93 May 2024 -3.01 April 2024 -1.99 March 2024 -1.27 February 2024 -1.33 January 2024 -1.48 December 2023 -1.20 November 2023 -1.16 October 2023 -1.88 September 2023 -2.52 August 2023 -2.02 July 2023 -2.44 June 2023 -2.67 May 2023 -2.46 April 2023 -3.13 March 2023 -2.50 February 2023 -1.79 January 2023 -1.24 December 2022 -1.85 November 2022 -1.83 October 2022 -1.48 September 2022 -1.78 August 2022 -1.78 July 2022 -2.44 June 2022 -1.42 May 2022 -2.44 April 2022 -2.19 March 2022 -1.63 February 2022 -1.72 January 2022 -2.22 December 2021 -2.47 November 2021 -2.37 October 2021 -2.69 September 2021 -1.70 August 2021 -0.84 July 2021 -1.93 June 2021 -1.89 May 2021 -2.33 April 2021 -1.77 March 2021 -1.70 February 2021 -1.29 January 2021 -0.73 December 2020 -0.92 November 2020 -1.23 October 2020 -0.29 September 2020 -0.75 August 2020 -0.85 July 2020 -0.77 June 2020 -0.86 May 2020 -0.68 April 2020 -1.32 March 2020 -1.68 February 2020 -1.12 January 2020 -0.79 Pacific Decadal Oscillation (PDO) | National Centers for Environmental Information (NCEI) Stronger El Nino/-PDO Winters are: 65-66, 72-73, 23-24 ^And 65-66 was cold because of -NAO, something that isn't as connected to the PDO (more random). La Nina/+PDO Winters are: 83-84, 84-85, 95-96
-
With 2 colder than average Winters (DJF) in the Northeast (24-25 and 25-26), I was wondering, do we have a higher chance of seeing a cold El Nino Winter next year (26-27)?? (3rd consecutive cold Winter?) Since 1950, I found 10 analogs where there were 2 cold Northeast, US Winter's before an El Nino. That is extremely high. It means 38% of El Nino's were preceded by 2 cold Northeast, US Winters. The odds of one is about 40%, using my guidelines (40-20-40), odds of two 20%, so about +2std, but limited examples [28]. So check it out.. This is the DJF before an El Nino the following year: Winter 25-26: DJF Air Temps 11 months before an El Nino: Winter 25-26: The pre-El Nino composite was a great predictor this past Winter, even outscoring forecasts such as the CPC. Now what did the following, 3rd Winter, El Nino Winter, look like? ^About your average El Nino composite. I'm a little surprised the map isn't skewed colder. The precip is also surprisingly below average in the Mid Atlantic, but this is just based on 10 examples: So history says that 2 cold Northeast, US Winters followed by an El Nino does not lean cold for the 3rd, El Nino, Winter, Disqualifying my thought. It's closer to 50/50, just based on history.
-
I find this to be an good coincidence -- I say coincidence because the QBO is a Stratosphere index. But since the QBO 30mb data started in 1979, every single December (6) in QBO >+5 and ENSO +El Nino -- has had the same anomaly temperature pattern. There is a >90% chance this will be this upcoming December (+QBO/+ENSO). Not only is every map the same, but they are strong anomalies in the Northeast and Great Lakes in every example. Will be interesting to see what happens in December 2026: Following January in +QBO/El Nino: The map skews warmer for El Nino because the +QBO state favors a stronger Stratosphere Polar Vortex. This has correlation with +AO in the +0-day. Not a definite constant, but a higher average in the mean (deep 10mb SPV) -- El nino by itself correlates with more High pressure in the Stratosphere. +QBO Winter upcoming.
-
If I made the thread, Super Nino would be in the first post lol
-
We are still contending with a strongly negative PDO. We have seen this in action, as developing Nino's usually have a -NPH (North Pacific High) correlation May-June, and the opposite has happened so far this year. (I would do 500mb maps, but the CDC has discontinued that site).
-
CANSIPS has a cold bias N. Atlantic SSTAs May-September are a great predictor of coming Winter NAO state. It has started to go more negative over the past few days
-
Late May/June 2026 Medium/Long Range
Stormchaserchuck1 replied to JenkinsJinkies's topic in Mid Atlantic
July has been a wet month since 2017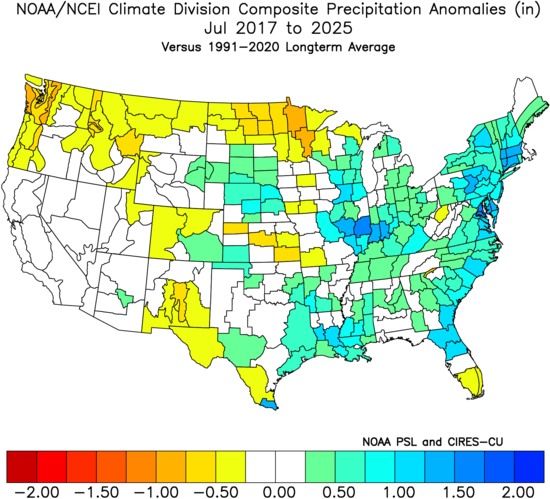
-
2026-2027 Super El Nino
Stormchaserchuck1 replied to Stormchaserchuck1's topic in Weather Forecasting and Discussion
It seems to be warming near the oceans, on the East coast and West coast, but not as much in the Midwest, where it's flat. I remember global predictions in the 90s had a +PDO/El Nino pattern projected for decades forward, but it has not happened that way. Maybe some of the EC warmth is associated with +AMO decadal. -
2026-2027 Super El Nino
Stormchaserchuck1 replied to Stormchaserchuck1's topic in Weather Forecasting and Discussion
May be one of the stronger -PNA's on record in the long range, near the 19-20th -
2026-2027 Super El Nino
Stormchaserchuck1 replied to Stormchaserchuck1's topic in Weather Forecasting and Discussion
Can someone say +AO? (For the 3rd warm season in a row, since the Solar Max)


