

TheClimateChanger
-
Posts
4,395 -
Joined
-
Last visited
Content Type
Profiles
Blogs
Forums
American Weather
Media Demo
Store
Gallery
Everything posted by TheClimateChanger
-
Pittsburgh, Pa Summer 2024 Thread.
TheClimateChanger replied to meatwad's topic in Upstate New York/Pennsylvania
Most likely, the actual highest temperature for those hours occurred in 2012, or perhaps this morning. -
Pittsburgh, Pa Summer 2024 Thread.
TheClimateChanger replied to meatwad's topic in Upstate New York/Pennsylvania
The 83F reading from 7 am on September 9, 1989 also appears to be erroneous. It was 69F at 5 & 8 on that date. And likewise the 83F from 6 am on June 23, 1989 also appears to be erroneous. Readings from 5 & 8 am were 67 and 66, respectively. -
Pittsburgh, Pa Summer 2024 Thread.
TheClimateChanger replied to meatwad's topic in Upstate New York/Pennsylvania
Yeah, it’s an error. I pulled up the climate data from July 1989 for KPIT and it has daily observations for each three hours starting at 1 am Local Standard Time (i.e. 2 am EDT) and it was 74F at 8 am, 89F at 11 am, and 93F at 1 pm. While the 9 am observation wasn’t listed, obviously wasn’t 93F. Looks like there was some weird time offset in the way the data got uploaded to the IEM database. -
Pittsburgh, Pa Summer 2024 Thread.
TheClimateChanger replied to meatwad's topic in Upstate New York/Pennsylvania
-
Central Pa. Summer 2024
TheClimateChanger replied to mahantango#1's topic in Upstate New York/Pennsylvania
-
Central Pa. Summer 2024
TheClimateChanger replied to mahantango#1's topic in Upstate New York/Pennsylvania
Looks like that urban heat island effect is creeping into East Nantmeal Township with the low temperature readings being significantly elevated in comparison to the high temperatures - which is especially surprising given the lack of precipitation [which would ordinarily lead to heightened diurnal ranges]. Have they been converting a lot of nearby woods and farmland to subdivisions? Maybe you need to add a UHI correction to your analysis. -
Occasional Thoughts on Climate Change
TheClimateChanger replied to donsutherland1's topic in Climate Change
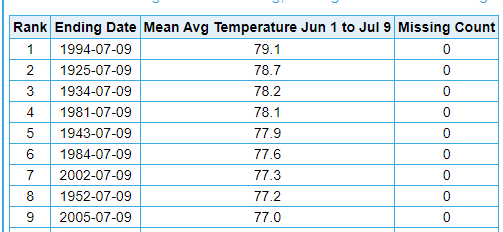
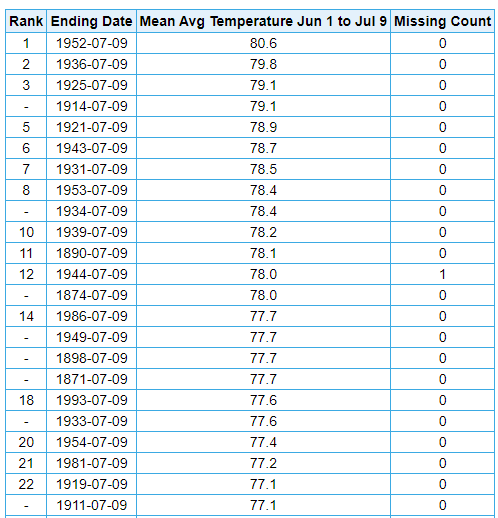
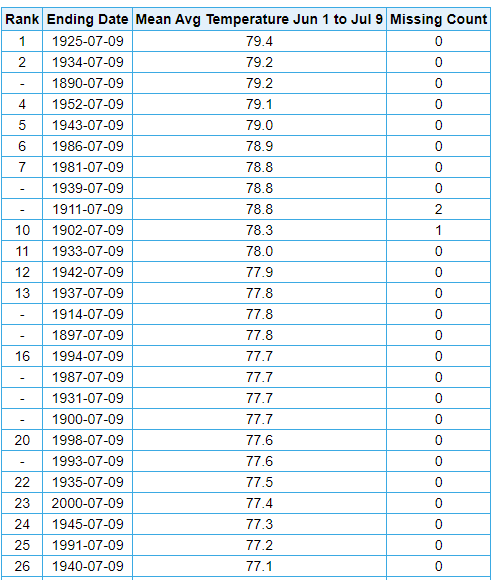
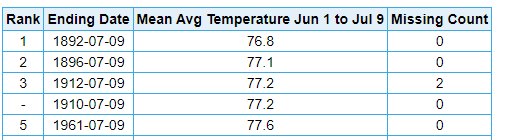
I'm not satisfied with the current ranking system. Is this really as hot as it can get in Reading, Pennsylvania in the current climate? I don't think so. We should be comparing summers to 19th & 20th century summers observed in locations hundreds of miles south. So, yes, indeed, the current mean temperature of 77.1F for the summer to date is the highest on record for Reading, Pennsylvania. However, it's only ninth warmest on record for Richmond, Virginia, for the period ending in 2007 [111 years]. I excluded recent years since RIC has been putting up video game numbers. There were only 4 warmer starts to summer in Richmond prior through 1980. It's only 22nd warmest on record for Knoxville, Tennessee, for the period ending in 2001 [131 years]. Again, I excluded recent years due to temperatures being played on easy mode in Madden type numbers. It's only 26th warmest on record for Raleigh, for the period ending in 2001 [115 years]. It's only equal to or warmer than two years on record in Tallahassee, with 3 more within 1/2 of a degree. And it's second coldest on record for Orlando, nearly a degree warmer than the bone-chilling Orlandonian summer of 1930.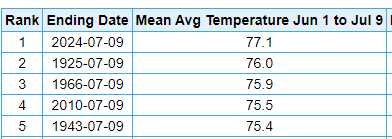

-
Pittsburgh, Pa Summer 2024 Thread.
TheClimateChanger replied to meatwad's topic in Upstate New York/Pennsylvania
Like a miniature Ike. -
2024 Short/Medium Range Severe Weather Discussion
TheClimateChanger replied to Chicago Storm's topic in Lakes/Ohio Valley
-
2024 Short/Medium Range Severe Weather Discussion
TheClimateChanger replied to Chicago Storm's topic in Lakes/Ohio Valley
-
Pittsburgh, Pa Summer 2024 Thread.
TheClimateChanger replied to meatwad's topic in Upstate New York/Pennsylvania
Looks like 92 was the official high again. Pretty impressive actually considering the cloud cover. Morgantown made it up to 95F, but there was more sun there this afternoon. -
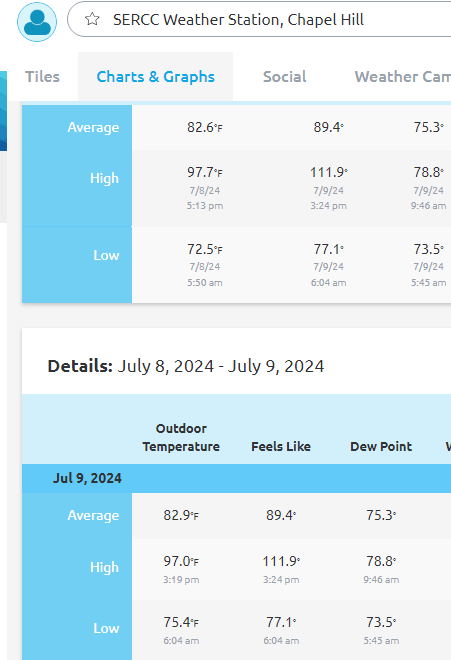
Another scorcher in the Research Triangle. Up to 97 at the Southeast Regional Climate Center today, with a peak heat index of 112F.
-
Pittsburgh, Pa Summer 2024 Thread.
TheClimateChanger replied to meatwad's topic in Upstate New York/Pennsylvania
8 straight 5-minute observations of 90. Got to think even with the rounding at some point, it ticked up sufficiently to reach a true 90F reading. But yeah, cloud cover was much too heavy for to see 94+. Not sure where the NWS was expecting to see heat advisory criteria met today, let alone heat index values up to 104F. -
It was 98 yesterday at the Southeast Regional Climate Center in a shady, tree-filled, low-density part of Chapel Hill, but carry on kvetching about the RDU temperatures. Pretty sure the SERCC knows how to reliably measure temperature.
-
Occasional Thoughts on Climate Change
TheClimateChanger replied to donsutherland1's topic in Climate Change
-
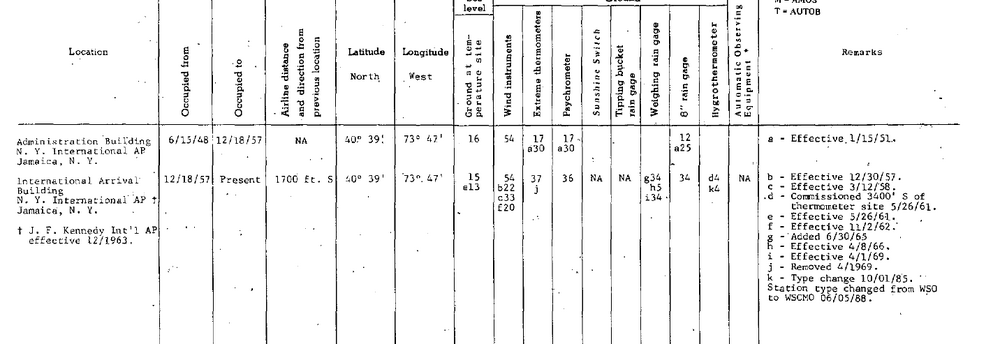
Edit: Confirmed. We can see the extreme thermometers were installed on a roof of the Administration Building through December 18, 1957, then on a rooftop of the International Arrival Building through at least May 26, 1961. A hygrothermometer was first installed 3400' south of the International Arrival Building at an appropriate 4' AGL on May 26, 1961. Prior to that installation, all of the readings were noncompliant, rooftop readings.
-
It's not possible for JFK to have had so many 100+ readings in the early decades. I suspect if you looked at the station metadata, it was installed on a rooftop. Without some sort of correction or adjustment, hard to draw any sort of conclusion about the trend in 100+ heat at JFK.
-
Up to 95F at Central Park so far, which is the hottest day since August 9, 2022.
-
2024-2025 La Nina
TheClimateChanger replied to George001's topic in Weather Forecasting and Discussion
Technically 2017-2018 was 0.1F above the 1981-2010 normal then in effect, by my calculation. The so-called "normal" keeps being raised. -
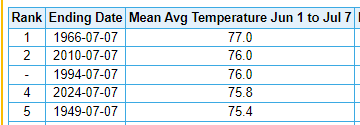
Can't wait for someone to "ackshually" me. The 1966 reading is bogus - the park was 1.2F warmer than the EWR tarmac? GTFO. Yes, it's cooler than 2010, but not by a margin that anyone can discern. And, of course, the 1994 readings are absolute garbage measured by garbage equipment that are not comparable to readings taken before or after that era.
-
Like I said, people "feel" it's cooler because they are so acclimated to the heat. I told the Harrisburg crew they should be comparing their summertime temperatures to Richmond, Virginia. It's one of the hottest summers on record at Harrisburg, but compared to historical, 20th century summers in Richmond, it's still a very hot summer just not among the record hottest. I think the New York City crew should do the same. 2024 is among the hottest on record at NYC and EWR, but if you compare NYC to 20th century Richmond and EWR to 20th century RDU then it's still well above the typical summer in those locations during that era, but not among the hottest on record. The DC crew can use Tallahassee or Savannah, Georgia.
-
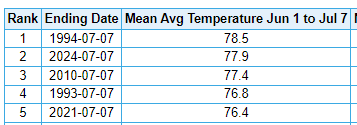
It's literally the hottest summer on record at Newark and New York City. *The 1993 and 1994 readings are erroneous. The HO-83 hygrothermometer in use at the time had a significant warm bias, particularly on sunny days with light winds. The location near the tarmac at Newark probably worsened the problem, as the fan was drawing in superheated air. On average, the ASOS installation was 1.2F cooler for daytime maximum temperatures, and 1.0F cooler for minimum temperatures. But at Newark, the bias may have been more substantial. *The 1966 readings from Central Park are probably not directly comparable to readings today. Sources: climo_rpt_96_2.pdf (colostate.edu) - Study of 79 first-order climate sites between 1994 & 1995 found an average annual max temperature bias of +1.16F, and an average annual low temperature bias of +0.95F from the HO-83 relative to the ASOS installation. Comparison of ASOS and HO-83 temperatures at Lincoln, Nebraska from November 1991 through October 1992 (noaa.gov) - 12-month study from Lincoln, Nebraska study 1991-92. ASOS was from 1.4 to 2.6F cooler for maximum temperatures every month, and from 0.7 to 2.5F cooler for minimum temperatures. An Investigation of Temperature Discontinuities Introduced by the Installation of the HO-83 Thermometer in: Journal of Climate Volume 8 Issue 5 (1995) (ametsoc.org) - Another study, somewhat smaller estimate of 0.6C bias - actually suggests less bias in summer, but not sure that is correct. The HO-83 Hygro- thermometer « Climate Audit - cites some more sources, particularly about Tuscon and how the NWS could not confirm a global warming signal in the deadly Chicago heat wave of 1995 because the readings were likely inflated by instrument bias
-
Pittsburgh, Pa Summer 2024 Thread.
TheClimateChanger replied to meatwad's topic in Upstate New York/Pennsylvania
Not really going out too far on a limb. PIT is at +3.4F. Given the forecast for the next week, I would expect the mid-month departure to be similar (or even higher). The week 2 outlook from CPC has above normal temperatures coast to coast. The week 3-4 outlook [through 8/2] has above normal temperatures coast to coast. We'd probably need the second half of June to be 4F below normal just to get to normal. I don't think there's been a half month stretch that cold in ages, let alone in the summer when natural variability is at a minimum. And we'd also need to have a monumental forecasting failure of epic proportions to do that. So I'd put the chances of a below normal July at this point at <1%. -
Pittsburgh, Pa Summer 2024 Thread.
TheClimateChanger replied to meatwad's topic in Upstate New York/Pennsylvania
Those HRRR temperatures though... -
Pittsburgh, Pa Summer 2024 Thread.
TheClimateChanger replied to meatwad's topic in Upstate New York/Pennsylvania
Very comfortable dewpoints tomorrow. Most guidance in mid to upper 50s, but HRRR brings it down to upper 40s to around 50 area wide.

