

TheClimateChanger
-
Posts
4,399 -
Joined
-
Last visited
Content Type
Profiles
Blogs
Forums
American Weather
Media Demo
Store
Gallery
Everything posted by TheClimateChanger
-
Figured I'd get a fall thread going, now that it's September.
-
Pittsburgh, Pa Summer 2024 Thread.
TheClimateChanger replied to meatwad's topic in Upstate New York/Pennsylvania
Maybe someone needs to get an autumn/fall thread going, now that we are into the month of September? -
Pittsburgh, Pa Summer 2024 Thread.
TheClimateChanger replied to meatwad's topic in Upstate New York/Pennsylvania
-
Pittsburgh, Pa Summer 2024 Thread.
TheClimateChanger replied to meatwad's topic in Upstate New York/Pennsylvania
Some high-altitude wildfire smoke pinwheeling through today. -
One other thing that often gets missed in these discussions is how our very perception of reality is being distorted by the changing norms. One poster described summer as "mostly pleasant" in Detroit - which is obviously a subjective assessment, and I don't mean to impugn that assessment. But if true, pretty much every summer in Detroit is pleasant. If we look at the top 33 hottest summer mean temperatures, we get this: I use 33 years as this is pretty much a "who's who" if you will of hot summers in the Great Lakes region. 2024 ranks as 23rd hottest summer [out of 151 years]. This means historically about 6 out of every 7 summers would be expected to be cooler than 2024 in Detroit. What's very interesting is 8 of the 22 warmer years occurred in the 14 years between 2010 and 2023, inclusive. If we key in on the time frame from 1874 to 2009, we get a markedly different distribution. The same set of years has shrunk from 33 to 23 - the 8 years noted above, plus 2024 & 2019, are out. In this distribution, we find only 14 years [out of 136 total years] were warmer than 2024. In other words, prior to 2009, only about 1 in 10 years were warmer than 2024 [with only 6 of those years warmer by more than 0.6F]. So, 2024 was somewhat cooler than the typical post 2010 summer in Detroit, but very warm historically. There may be some claims that this is the result of some urban heat island expansion, but I would be very, very interested in what changes happened specifically between 2009 and 2010 in the vicinity of Detroit Metropolitan Wayne Airport to explain this phenomenon.
- 231 replies
-
- 1
-

-
- absolute trainwreck?
- abandon all hope?
- (and 1 more)
-
September 2024 General Discussion
TheClimateChanger replied to Geoboy645's topic in Lakes/Ohio Valley
Interesting. Most of it appears to be aloft today, but the HRRR suggests a more significant concentration of near surface smoke moving through northern and western Minnesota by Thursday morning. May see some air quality advisories later in the work week if this holds together. -
Yes, but relative to the rest of the country, this was the coldest area. On a national scale, I suspect it will come in a bit below the record value from 2021 and 1936.
-
Central Pa. Summer 2024
TheClimateChanger replied to mahantango#1's topic in Upstate New York/Pennsylvania
By contrast, there have been an incredible 22 days in which the recorded high temperature was among the 3 warmest daily readings since May 18, 2023, and 27 days in which the recorded minimum temperature was among the 3 warmest of record in that stretch. -
Central Pa. Summer 2024
TheClimateChanger replied to mahantango#1's topic in Upstate New York/Pennsylvania
At Harrisburg, this is the first daily low temperature reading among the top three coldest of any day since May 18, 2023, when the low of 40F was third lowest for that date. Source: Threaded Extremes (rcc-acis.org)

-
Central Pa. Summer 2024
TheClimateChanger replied to mahantango#1's topic in Upstate New York/Pennsylvania
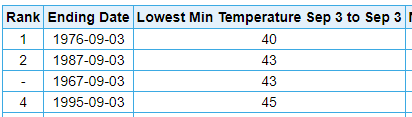
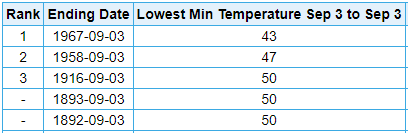
Very impressive cold snap this morning in central Pennsylvania. Been awhile since we've seen something like this - maybe May 2020? The low of 36F at Bradford matches the second lowest on record for this date. The low of 44F at DuBois is the 4th lowest reading on record for this date. At Altoona, the low of 43F matches the record low for this date set in 1958 & 1967. And at some longer POR sites... The low of 47F at Williamsport ties 1949, 1960, 1976, 1989 & 2001 for ninth coldest. At Harrisburg, the low of 50F ties 1892, 1893, and 1916 for 3rd coldest on record for this date:
-
Occasional Thoughts on Climate Change
TheClimateChanger replied to donsutherland1's topic in Climate Change
Not quite a record for Caribou, Maine or Mount Washington, New Hampshire, but pretty close. Caribou Mount Washington, NH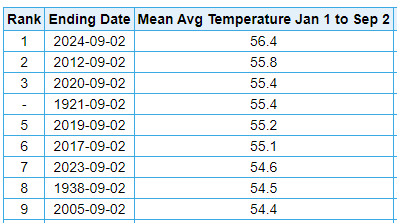
-
Occasional Thoughts on Climate Change
TheClimateChanger replied to donsutherland1's topic in Climate Change
Not so sure about that. 2024 has been the hottest year to date at many locations in the eastern U.S. Including very low population density sites, such as Elkins, West Virginia: And Bradford, Pennsylvania:
-
Pittsburgh, Pa Summer 2024 Thread.
TheClimateChanger replied to meatwad's topic in Upstate New York/Pennsylvania
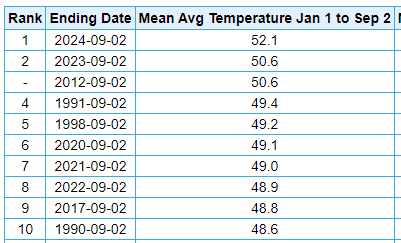
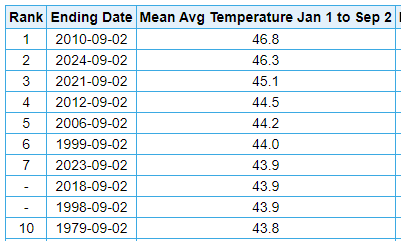
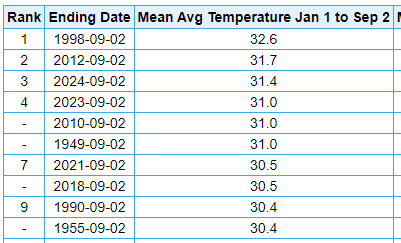
Nevermind. I guess it got so cold in 1880 that it fell way behind. 1921 is the year to beat at 55.4F. We currently have +0.5F on it. The rest of the year in 1921 was +5.9F, +0.7F, +2.1F, +0.3F, relative to 1991-2020 normals. Or about 2.2/2.3F above normal. Since the year is 2/3rd of the way through, 2024 could finish about 0.75F +/- cooler the rest of the way and still tie for the record. So we'd need to run roughly +1.5F, more or less, above the normal for the last 4 months, which is not too much to ask.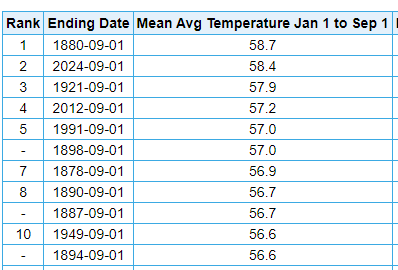
-
Pittsburgh, Pa Summer 2024 Thread.
TheClimateChanger replied to meatwad's topic in Upstate New York/Pennsylvania
We might do it. We may break the annual temperature record if the CPC's fall outlook is accurate. Even with the warm bias in the 19th century data, it still used to get cold at times. Because it's not actually normal to go through a whole year without at least one cold month. Fall 1880 looks like this compared to 1991-2020 normals: September +1.1F; October +0.1F; November -6.9F, and December was -7F. Just a couple of decades ago, this would have been unthinkable.
-
Pittsburgh, Pa Summer 2024 Thread.
TheClimateChanger replied to meatwad's topic in Upstate New York/Pennsylvania
Overall, CPC forecasts a warmer than normal fall, with no strong signal for precipitation in our region. Temperatures Precipitation -
Pittsburgh, Pa Summer 2024 Thread.
TheClimateChanger replied to meatwad's topic in Upstate New York/Pennsylvania
September looks to start on a comfortable note, as indicated by @ChalkHillSnowNut. The final CPC outlook for September issued yesterday shows equal chances for above, below and near normal temperatures and precipitation. Although parts of the region (north of I-80) are slightly favored for drier than normal conditions. Also odds are somewhat elevated for below normal temperatures just to the east of the mountains. Perhaps our best opportunity for a below normal month since last summer, although with this look [heat and dryness to our west], you have to wonder if there won't be at least one abnormal warm spell later in the month that might keep things on the warm side in the end. Temperatures Precipitation -
Pittsburgh, Pa Summer 2024 Thread.
TheClimateChanger replied to meatwad's topic in Upstate New York/Pennsylvania
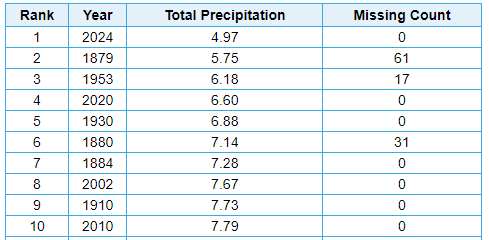
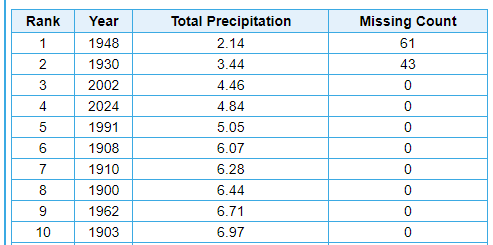
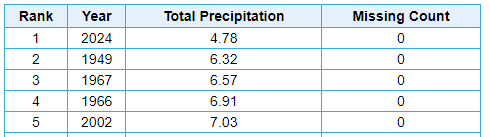
Precipitation wasn't particularly noteworthy at PIT, MGW, and DUJ. Somewhat below the median at the first two, but actually somewhat wetter than usual at DUJ. However, this summer was one of the driest on record in parts of southeast Ohio and northern West Virginia. At Zanesville, only 0.17" of rain fell in August, which was easily the driest August of record and the 5th driest of any month [1546 months of record] and the driest of any month in about 100 years: Driest summer on record at Wheeling, and by a significant margin. Was sitting at 3.66" just a couple days ago. 1879 is missing the entire months of June and July, and 1953 is missing data for the final 17 days of August. 2020 is the closest with full data. 2nd driest at Zanesville, among years with full data [2002 was drier]. 1948 is missing June and July, and thus should be tossed from the ranking. 1930 is missing scattered data. Sometimes blank data [for no precipitation] is interpreted as missing data, so it may be a legitimate number. There was a significant drought that summer in the region. Third driest if you include 1930. Easily the driest on record in the shorter POR at New Philadelphia: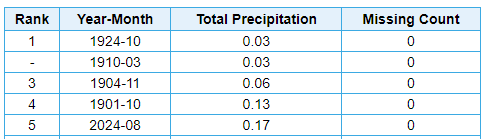
-
Pittsburgh, Pa Summer 2024 Thread.
TheClimateChanger replied to meatwad's topic in Upstate New York/Pennsylvania
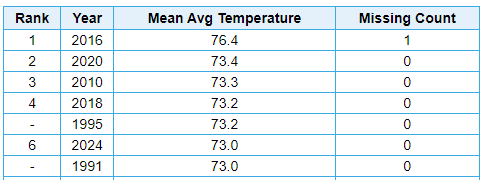
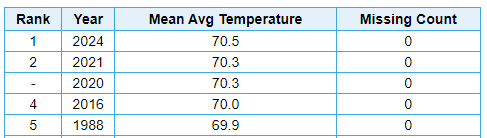
Some numbers from elsewhere in the PBZ County Warning Area: It was 5th warmest in the threaded record at Morgantown, among years with sufficient data (1892 is missing the entire month of June): It was 2nd warmest in the threaded record at Wheeling [no data for 1954-1997]: 15th warmest at Zanesville. Most of the warmer summers were prior to the airport site opening. Shorter period of record sites: 6th warmest (of 65 years) at New Philadelphia: Warmest summer on record at DuBois (out of 59 years):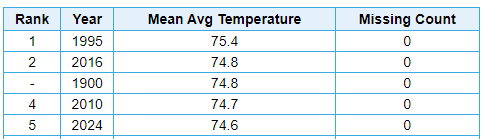
-
Pittsburgh, Pa Summer 2024 Thread.
TheClimateChanger replied to meatwad's topic in Upstate New York/Pennsylvania
It did indeed tick up to eighth place in the final rankings, albeit just barely. I was thinking it would get a bit warmer yesterday.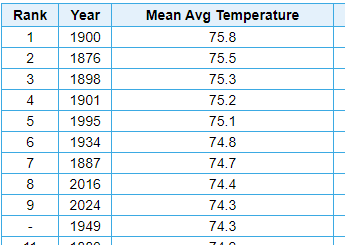
-
Las Vegas Sees Its Hottest Summer on Record
TheClimateChanger replied to donsutherland1's topic in Climate Change
Thanks for the update, Don. It will be interesting to see whether 2024 was able to unseat 2021 and 1936 for hottest summer on a national scale. The fist two months of summer were in 2nd place, slightly behind 2021 and slightly ahead of 1936. While August was certainly warmer than normal, I feel like it was a bit cooler nationwide... so I think we may wind up just behind those years, but we'll see. Stay tuned. -
Pittsburgh, Pa Summer 2024 Thread.
TheClimateChanger replied to meatwad's topic in Upstate New York/Pennsylvania
For those keeping score, this comes on the heel of the warmest spring and fourth warmest winter on record.
-
Pittsburgh, Pa Summer 2024 Thread.
TheClimateChanger replied to meatwad's topic in Upstate New York/Pennsylvania
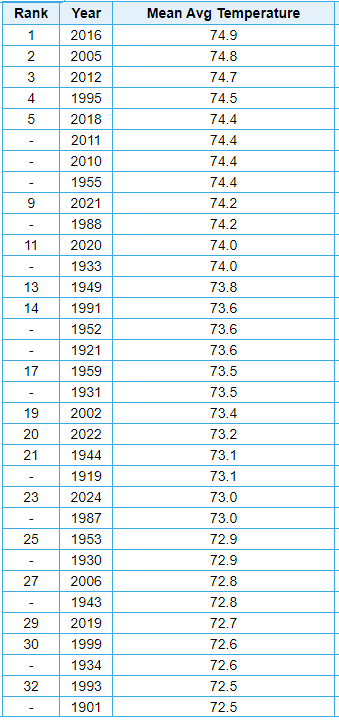
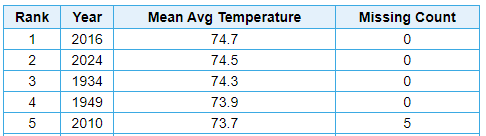
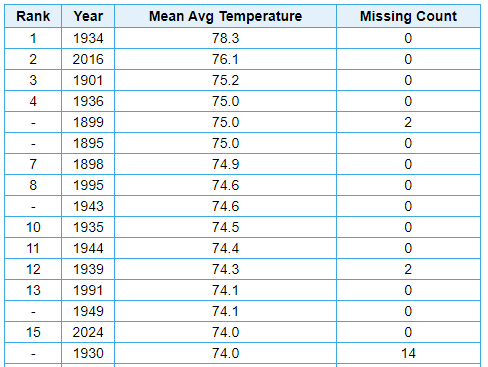
Haven't looked at this in a little while, but the recent heat wave locked up a top 10 warmest summer at Pittsburgh. Have to suspect that today and tomorrow will raise the August mean sufficiently to result in an increase of at least 0.1F in the summer mean, which would result in a tie or just ahead of 2016 for 8th place overall. Since 1901, only 2016, 1995 & 1934 were hotter in the threaded record [of course, the latter being when the station was still downtown].
-
Pittsburgh, Pa Summer 2024 Thread.
TheClimateChanger replied to meatwad's topic in Upstate New York/Pennsylvania
Wasn’t sure we’d get there today with the cloud cover, but it did reach 90F already. Might be about done though with thickening clouds and even some scattered thundershowers popping. -
A small area of exceptional drought (D4) noted in Ohio and West Virginia for the first time in both states since the drought monitor began in its current form in 2000.
-
Pittsburgh, Pa Summer 2024 Thread.
TheClimateChanger replied to meatwad's topic in Upstate New York/Pennsylvania
Looks like the morning low was 74F, which would be a record high if it holds. It might not though, due to risk of thunderstorms. Current record high minimum is 73F from 1928.
