

TheClimateChanger
-
Posts
3,547 -
Joined
-
Last visited
Content Type
Profiles
Blogs
Forums
American Weather
Media Demo
Store
Gallery
Everything posted by TheClimateChanger
-
2025-2026 ENSO
TheClimateChanger replied to 40/70 Benchmark's topic in Weather Forecasting and Discussion
This has been a fine spring for Dayton, Ohio. A little on the wet side, but almost no snow and warm temperatures. In fact, if the month ended yesterday, this would go in the books as the 7th warmest spring at the Dayton International Airport (since 1936, excludes threaded records). And this doesn't even include today's torch. People like to act as though it's supposed to be in the 90s all summer long, but that's just not how the climate works. There have been entire years where the hottest temperature observed at Dayton was only a handful of degrees above today's warmth. So I would urge everyone to enjoy the next couple of days, instead of fretting over whether it's going to be in the 60s and rainy next week. As JB says, "enjoy the weather, it's the only weather you've got."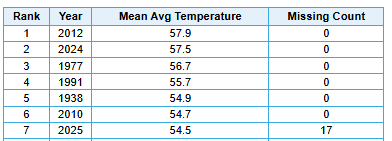
-
2025-2026 ENSO
TheClimateChanger replied to 40/70 Benchmark's topic in Weather Forecasting and Discussion
This jives with my recollections. It was much snowier as a child. Just look at the data for Cleveland. Snowfall has been in a free fall since 2014. This winter was considered a harsh winter, but just two decades ago, it would have been heralded as a very mild winter. I would expect that trend to increase with time. -
Daily record of 93F at Chicago O'Hare. Midway Airport reached 94F.
-
Occasional Thoughts on Climate Change
TheClimateChanger replied to donsutherland1's topic in Climate Change
Here is New Brunswick, NJ versus Newark for July 1993. New Brunswick was 0.6F above the 1991-2020 normal [measured with standard MMTS] versus Newark 4.3F above 1991-2020 normal [with HO-83]. Certainly seems highly suspect to me. One note - there appears to be a 1-day offset for the New Brunswick data, as the observation must have been taken the following morning and ascribed to that day [even though the maximum would have occurred the prior afternoon]. -
Occasional Thoughts on Climate Change
TheClimateChanger replied to donsutherland1's topic in Climate Change
I also wouldn't put much stock into the 1986-1995 era, which shows tons of big heat. The HO-83 had a significant warm bias. See: Inside the HO83 Hygrothermometer « Climate Audit Here is comparative data from Lincoln, NE, for 1991 & 1992, comparing readings from the HO-83 versus a newly installed ASOS. There was only 1 day where the HO-83 max was lower than the ASOS. On one date, it was 7 degrees warmer! We have to remember our ability to measure temperature today is better than at any point in history. As almost any bias results in a warmer temperature [except for poor calibration, which could go either way, and shading, which introduces a cool bias], this naturally makes it more difficult to reach these lofty readings with regularity. Shading is probably a bigger issue today. I know NYC doesn't comply with setbacks and I see trees around a lot of sites. -
Occasional Thoughts on Climate Change
TheClimateChanger replied to donsutherland1's topic in Climate Change
I wouldn't put too much emphasis on the older records. It's not always an apples-to-apples comparison to modern data. The thermometers were typically housed in cotton region shelters on rooftops, which can introduce significant warming bias relative to ground-based readings. No correction is ever made for this bias. By the time they decommissioned the Baltimore Common House station, it was reporting dozens more days of 90+ than the airport. Watts somehow flips this to say it's causing a warming bias, when a more reasonable conclusion is that if we continued measuring temperature consistently at Baltimore, there would be dozens of additional days at or above 90F each summer. See: How not to measure temperature, part 48. NOAA cites errors with Baltimore's Rooftop USHCN Station – Watts Up With That? -
Occasional Thoughts on Climate Change
TheClimateChanger replied to donsutherland1's topic in Climate Change
It takes decades to get the full panoply of possible climatological outcomes in a stable climate. We have only surpassed 1.5C for a couple of years. Even if temperatures were to stabilize at this point for several decades, we would likely eventually see a summer heat wave exceeding anything of record as we started to "feel" the full impact of variability upon a new climatological state. -
Occasional Thoughts on Climate Change
TheClimateChanger replied to donsutherland1's topic in Climate Change
While less impressive from a historical standpoint, EWR saw 10 straight 90+ days in early August 2022. They also had streaks of 14 days (2010) and 12 days (2012), since 2002. -
Occasional Thoughts on Climate Change
TheClimateChanger replied to donsutherland1's topic in Climate Change
As recently as 2022, a 6-day heatwave at JFK matched its third longest string on record. A completely separate 8-day heatwave at LaGuardia later in the same summer also matched its 3 longest streak. -
There's nearly 100 years with, more or less, complete data for May in the threaded record. As for that claim, possible, but unlikely. Fort Frances, Ontario is just across the border from International Falls and shows 0 days of 90+ that month. The second closest site (Littlefork Ranger Station) recorded 1 day.
-
Occasional Thoughts on Climate Change
TheClimateChanger replied to donsutherland1's topic in Climate Change
It's observed from space. Less reflectivity would make it appear somewhat dimmer. -
Occasional Thoughts on Climate Change
TheClimateChanger replied to donsutherland1's topic in Climate Change
I would say a monthly record high maximum of 96F and monthly record high minimum of 70F are potentially deadly in a location with limited air conditioning. But this is a sparsely populated region, so one or two deaths over the baseline wouldn't even register as a blip. -
Occasional Thoughts on Climate Change
TheClimateChanger replied to donsutherland1's topic in Climate Change
A record-breaking 4th 90+ day at International Falls. Never before observed in the month of May. For some context, Cleveland has only seen one May with 4 or more days of 90+ (1962, 4); Detroit, 3 (1962, 6; 2018, 4; and 1895, 4); and Bristol, TN, 2 (1962 & 1941, 6). INL has twice as many days at or above 90+ than Dayton, Ohio has seen in the last 13 years! International Falls working hard to shed that the "icebox of the nation" title. I think we are really going to need to reconsider that title moving forward in a location that sees this kind of heat in the month of May. -
International Falls has seen twice as many 90+ days in the month of May over the last 4 days than Dayton, Ohio has seen in the last 13 years! Just unreal. @Spartman
-
To put that into perspective, Cleveland has only seen one May with 4 90+ days (1962); Detroit, 3 times: 1962 (6), 2018 (4), and 1895 (4); and Bristol/Johnson City, Tennessee, twice (1962 & 1941, 6 each). And for those who would blame the latter on elevation, Tri-Cities Airport in Tennessee is actually closer in elevation to International Falls than the other two cities. International Falls looking to shed its title as "icebox of the nation" in a BIG way!
-
Incredible stuff. Record breaking 4th day at or above 90F yesterday at International Falls. That's the most ever recorded in the month of May, with 17 days remaining in the month.
-
Occasional Thoughts on Climate Change
TheClimateChanger replied to donsutherland1's topic in Climate Change
He also never posts the record lows which would invariably show a much greater bias towards early year than record highs, especially using his convention of ignoring subsequent ties. -
Occasional Thoughts on Climate Change
TheClimateChanger replied to donsutherland1's topic in Climate Change
Those maps are always just a bunch of nonsense anyways. Martz only lists the first occurrence of a record high so it biases it toward earlier years. With that said, even using his data, 10 of 50 states have set monthly record highs since 2000. That's 20 percent of all states. Keep in mind, the data this is drawn from actually extends beyond 1895, with scattered data all the way back to 1870 [and limited data before then]. Limiting to 1895, that's 20 percent in 19.3 percent of the total years. Extending back to 1870, that becomes a fairly hefty overweighting of recent record highs. Again, especially considering that Martz only shows the first occurrence, so there are probably more recent ties not reflected on the map. Data quality on some of these records are also highly questionable. He includes even highly questioned observations. I saw one record shown in March for the State of Missouri that was 10+ degrees warmer than any other observation from the same month. When I went back to the original document, the Weather Bureau had actually drawn a question mark by a few of the observed highs. And even some of the recognized highs are questionable by today's standards. For instance, the 112F at Martinsburg, West Virginia in July 1936. It was 105F in Kearneysville, and 103F in Hagerstown on the same day. Is that level of discrepancy plausible for a daytime high temperature? @FPizzand @ChescoWxwould be having a conniption fit. People are constantly complaining about ASOS readings a couple of degrees too high on here. -
-
Occasional Thoughts on Climate Change
TheClimateChanger replied to donsutherland1's topic in Climate Change
This is such a big anomaly, I wonder if it's just some sort of data entry error. -
Occasional Thoughts on Climate Change
TheClimateChanger replied to donsutherland1's topic in Climate Change
Here's the difference for each site. The rankings have 1978 as 0.4F warmer in this District. Idk. Coatesville 1 SW: 0.7F cooler in 1978 Devault 1 W: 0.6F warmer in 1978 Drexel University: 2.2F cooler in 1978 Ephrata: 2.5F cooler in 1978 George School: 2.3F cooler in 1978 Graterford 1 E: 2.3F cooler in 1978 Holtwood: 1.8F cooler in 1978 Landisville 2 NW: 2.0F cooler in 1978 Lebanon 2 W: 2.2F cooler in 1978 Marcus Hook: 2.2F cooler in 1978 Morgantown: 1.0F cooler in 1978 Philadelphia (City): 3.8F cooler in 1978 Philadelphia (AP): 1.0F cooler in 1978 Phoenixville 1 E: 0.8F cooler in 1978 Reading 3 N: 1.6F cooler in 1978 West Chester 1 W: 1.1F cooler in 1978 -
Occasional Thoughts on Climate Change
TheClimateChanger replied to donsutherland1's topic in Climate Change
I will say the adjustments are not perfect. There was one thing that had me scratching my head. I was confused that I thought I had made a mistake and was looking at the wrong data! 1976 is shown as the fifth coldest July on record for Pennsylvania's Division 3, with a reported mean of 71.2F on Climate at a Glance. This appears to be entirely an artifact of whatever adjustments they are making. The raw data reflects a cooler than normal July, but only by a little bit. The reported mean is 74.6F. By comparison, 1978 was much colder with a reported mean of 72.7F, yet Climate at a Glance has it at 71.6F or 0.4F warmer than 1976! Looking at the station composition, they add Blue Marsh Lake, Octoraro Lake, and get rid of Philadelphia 2304 Mkt [inner city] and West Grove 1 SE. So the 1978 set is more rural and not directly comparable, but what's odd is if you compare every site that it's common to both datasets 1978 is still significantly cooler across the board. Yet Climate at a Glance shows it as warmer. I highly doubt 1976 was actually the 5th coldest July on record for this climate division. I'm not really sure what's going on here, and whether it affects other districts. 1976 was the only year that had anywhere near that deviation from the mean. Wonder if it's just some sort of data error? -
Occasional Thoughts on Climate Change
TheClimateChanger replied to donsutherland1's topic in Climate Change
Anyways, I went through the raw published figures for the month of July for Pennsylvania's Division 3 [Southeastern Piedmont] back to 1957, and the raw numbers were warming at 3.3F/century. Climate at a Glance shows 5.8F/century. This isn't evidence of any error or nefarious intent, however; the "raw" trend that I calculated is just the change in the simple arithmetic mean. I did not make any adjustments/homogenization for changes in site location, elevation and urban character. The early years were "Philadelphia heavy" so they would be inflated relative to the recent means, with up to 4 of the stations being in the city. For comparison, PHL shows a warming trend of 7.8F/century over the same time frame. Given the changing composition of the stations, I suspect the reported trend is closer to the actual trend, although I can't rule out it being slightly overstated. -
Occasional Thoughts on Climate Change
TheClimateChanger replied to donsutherland1's topic in Climate Change
Is there any evidence these are actually stations used by NCEI? That seems like a lot for one county. Why would they add 16 stations in the past two decades? -
Occasional Thoughts on Climate Change
TheClimateChanger replied to donsutherland1's topic in Climate Change
What are the stations in each year?


