TheClimateChanger
-
Posts
4,574 -
Joined
-
Last visited
Content Type
Profiles
Blogs
Forums
American Weather
Media Demo
Store
Gallery
Everything posted by TheClimateChanger
-
Pittsburgh/Western PA Spring 2024
TheClimateChanger replied to Ahoff's topic in Upstate New York/Pennsylvania
Impressive lightning with this cluster of storms. High of 68 each of the last two days IMBY. -
Maybe, I'm skeptical of some of those readings. If you look at Bradford, in rural Pennsylvania, surrounded by the Allegheny National Forest [so no UHI impacts], pretty much every recent summer is the hottest on record. So I don't know why there would be such a disconnect between the rural and heavily populated parts of the northeast. Wouldn't the UHI effect argue for the exact opposite impact? It's almost like the greenhouse effect ameliorates some of the UHI effect by making radiational cooling less effective in more remote areas.
-
Insane, breaks the monthly & seasonal record prior to yesterday by 7F.
-
Yeah, the bias on the HO-83 was primarily daytime only. I think there were some hot summers in that era, no doubt. But the first order station data for years like 1987, 1988, 1991, 1993, 1994 & 1995 is probably a couple degrees too high for daily maxima, relative to the current readings with the HO-1088 ASOS hygrothermometer [which was reconfigured to address the issues with the HO-83]. I mean it's probably too warm even in the cold, volcanic summer of 1992. I'm just pointing out the multiple warmer years from that era.
-
Not as hot as today. Take those readings with a grain of salt [except for 1999]. Maximum temperatures at first order stations averaged about 0.5C too warm, and from 1 to as much as 3C on sunny days with light winds - i.e., typical summertime weather. The HO-83 Hygro- thermometer « Climate Audit

-
I think if we measured temperatures the same way we used to, we would have 100F+ temperatures every summer. They had to shut down the original Baltimore station because it was so hot. The same station that is the official records from Baltimore before BWI opened. Somehow the deniers argue this shows the warming is fake. Obviously, it actually shows how ridiculous the warming has been when properly observed temperatures today are now exceeding the past ones taken in an absurdly warmed local microclimate on a rooftop. What level of cognitive dissonance is that? Source: How not to measure temperature, part 48. NOAA cites errors with Baltimore's Rooftop USHCN Station – Watts Up With That?
-
What a joke - why do they allow obviously bogus readings to stay in the record books? I'm guessing that was the HO-83? Should at least have an asterisk designating its questionable nature.
-
66 in Houghton Lake, Michigan, breaks the prior monthly record of 64F (1930) & seasonal record of 64F (2/1930 & 12/2001). The temperature at Sault Ste. Marie, Michigan has ticked up to 50F since that last observation. That value ties the February monthly high of 50F, set on February 16, 1921. Nowhere near the seasonal record though. Due to the lake effect, the warmest temperatures occur in early December. 65F at Green Bay ties the monthly record from 2/22/2017 & ties the seasonal record from 2/22/2017 & 12/16/2021. Some nearby airports registering 70F.
-
A nice 69F at Madison, Wisconsin, breaking the prior monthly record of 68F set on February 22, 2017, and breaking the prior seasonal record of 68F set on February 22, 2017 & December 16, 2021. Yesterday's high of 67F came up one degree short of those values.
-
68 in LaCrosse beats the prior monthly record of 67F set yesterday, and beats the prior seasonal record of 67F set yesterday and on December 5, 1998.
-
Up to 71F at Milwaukee, tying the monthly and seasonal record high from 2/22/2017. Excellent palm growing weather for our Wisconsin enthusiasts.
-
Rockford up to 75F, easily breaking the monthly and seasonal record high of 73F set yesterday (and obliterating the previous high water mark of 70F).
-
Moline up to 77F, breaking the monthly and seasonal record high set yesterday.
-
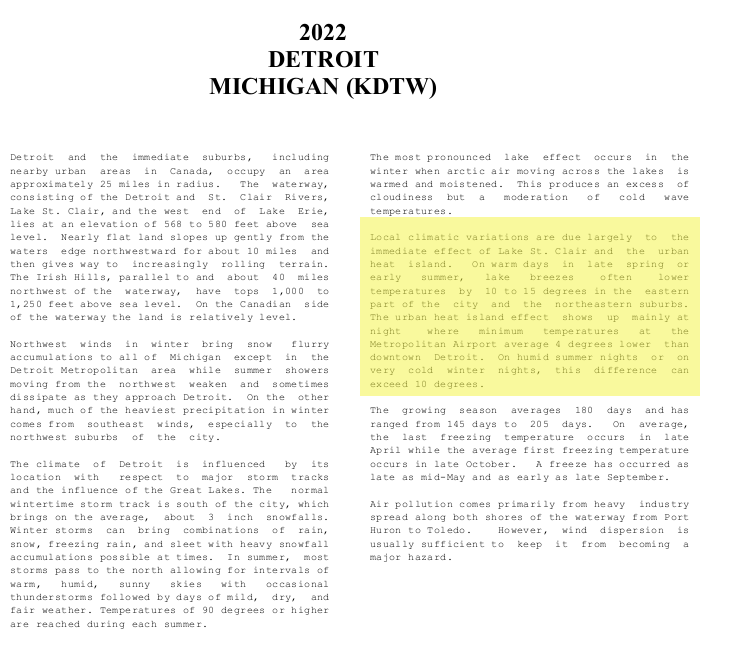
Up to 72F at both sites, as well as DTW. City Airport in Detroit is up to 73F. Prior to today, the earliest 70+F reading at Saginaw and Flint was March 7, 2000 & March 7, 1987.
-
-
What a way to send off what will almost certainly be the warmest winter on record nationally!
-
Occasional Thoughts on Climate Change
TheClimateChanger replied to donsutherland1's topic in Climate Change
All-time monthly and seasonal record highs being set all over the place in the Midwest yesterday and today - in some cases, by several degrees (and on multiple consecutive days). What a way to cap off what will surely be the warmest winter on record nationally! -
This is like the winter equivalent of March 2012 or July 1934.
-
What an absolutely historic day in Michigan! Traverse City is 70F -- that's a whopping 4F above the prior monthly record maximum and prior winter seasonal record maximum. Incredible. Likely to rise even more. Total obliteration. Alpena at 65F, tying monthly and seasonal all time maxima.
-
The current temperature at both Flint and Saginaw is 69F, setting new monthly records and all-time winter seasonal high temperatures for both sites.
-
The current temperature at Lansing is 70F, setting a new monthly record high and tying the all-time winter seasonal record high temperature set on December 31, 1875. Records date to 1863.
-
The current temperature has reached 70F at Grand Rapids, Michigan, setting a new monthly and winter seasonal all-time record high.
-
Also, only the third time on record in which it reached 70F during meteorological winter. The all-time December high is 69F, and January 67F.
-
All-time monthly maximum, dating back to at least 1874.
-
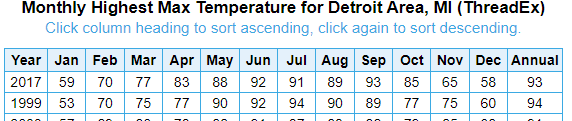
The current temperature at Detroit is 70F. This ties the February monthly record maximum. Prior to this year, the only other dates on which it reached 70F are 2/24/2017 & 2/11/1999.