
Brian D
-
Posts
2,743 -
Joined
-
Last visited
Content Type
Profiles
Blogs
Forums
American Weather
Media Demo
Store
Gallery
Everything posted by Brian D
-
Already in the 40's around here. Beautiful day. Wind adv issued with a strong front moving through. Highs in the teens tomorrow with +/- sd's in the a.m.
-
February 27 1981: Thunderstorms move across Minnesota, dumping 1.61 inches of rain at Montevideo. Many places were glazed over with ice. 1948: A severe ice storm occurs over central Minnesota. At the St. Cloud Weather Office 1/2 inch of clear ice was measured. 65 telephone poles were down in St. Cloud. For Friday, February 27, 2026 1717 - What was perhaps the greatest snow in New England history commenced on this date. During a ten day period a series of four snowstorms dumped three feet of snow upon Boston, and the city was snowbound for two weeks. Up to six feet of snow was reported farther to the north, and drifts covered many one story homes. (David Ludlum) 1969 - A record snowstorm in Maine came to an end. Two to four feet of snow buried southern and central Maine, with a state record of 57 inches reported at West Forks. Drifts covered many single story homes, and the weight of the snow collapsed many roofs. Two to four feet of snow also buried northeastern Vermont and northeastern Massachusetts. In New Hampshire, Mount Washington NH reported 97.8 inches of snow, a record storm total for New England. (24th-28th) (David Ludlum) (The Weather Channel) 1987 - A storm spread heavy snow into the Central High Plains Region, and produced severe thunderstorms in the Southern Plains. Snowfall totals in western Nebraska ranged up to 19 inches at Sydney. Severe thunderstorms in Oklahoma produced baseball size hail at Stringtown and Atoka. A storm in the eastern U.S. produced heavy rain over the Carolinas and heavy snow in the southern Appalachians and piedmont region. Five inches of rain left four feet of water in the streets of Greenville SC. Snowfall totals in southwestern Virginia ranged up to 20 inches. (The National Weather Summary) (Storm Data) 1988 - Thunderstorms along a cold front produced heavy rain in southern California, with up to 2.52 inches reported in Ventura County. Strong winds accompanying the rain gusted to 55 mph in the Tehachapi Mountains. Rapid City SD established a February record with an afternoon high of 75 degrees. (The National Weather Summary) (Storm Data) 1989 - Rain and snow prevailed in the southeastern U.S. Up to eight inches of snow blanketed north central Tennessee, and snowfall totals in western North Carolina ranged up to 14 inches at Mount Mitchell. (The National Weather Summary) (Storm Data) 1990 - A winter storm produced heavy snow in southeastern Colorado, with 12 inches reported at Lamar. The same storm produced severe thunderstorms over the Southern High Plains, with wind gusts to 93 mph reported at the White Sands Missile Range in New Mexico. Low pressure brought high winds to the Prince William Sound area of Alaska. Big River Lakes reported wind gusts to 92 mph. (The National Weather Summary) (Storm Data) 2010 - A weak EF0 tornado causes no damage as it moved across California's southern San Joaquin Valley. However it is the only tornado reported in the United States during the month. According to the Storm Prediction Center only five months since 1950 have lacked a tornado report. <a href="http://islandnet.com/~see/weather/almanac/diaryfeb.htm">The Weather Doctor</a>
-
B+ is my grade. A good mix of colder/warmer wx, and lots of little snows (and some rn). 2 snow events that were very cool. 1st was the LES dump of 6" in 3hrs on 11/29, and of course the blizzard of 2/18 which netted me 18", and shutdown Hwy 61 along the shore from DLH to the border for a good part of the day. Depending on what comes in the next couple weeks could bump it up into the A grade. Winter is not a strict DJF for me, but more like mid-Nov thru mid-March.
-
1.6" of fluffy snow. Keeping the pack robust.
-

Winter 2025-26 Short Range Discussion
Brian D replied to SchaumburgStormer's topic in Lakes/Ohio Valley
Time to move on to Spring threads looks like. -
Guess this thread ends up for me? 1-2" around here in N MN.
-
Winter 2025-26 Medium/Long Range Discussion
Brian D replied to michsnowfreak's topic in Lakes/Ohio Valley
Considering the time window for this thread, think it's time to move on over to the Spring threads. -
February 26 1996: A bolt of lightning from a snowstorm causes an explosion at a fireworks storage site in Milaca. One employee was injured and several homes in the area were damaged. An eight foot crater was all that remained where the storage site had been. 1971: Extremely low pressure moves across Minnesota. The Twin Cities had a barometer reading of 28.77 inches and Duluth beat that with 28.75. Freezing rain and snow hit northern Minnesota, dumping up to 18 inches of snow in some areas. Areas around Virginia, MN were without power for 5 days. 1896: A balmy high of 60 degrees is reported at Maple Plain. The warm weather hampered the annual ice cutting on Lake Independence to store for summer use. For Thursday, February 26, 2026 1910 - Parts of Washington State were in the midst of a storm which produced 129 inches of snow at Laconia between the 24th and the 26th, a single storm record for the state. A series of storms, which began on the 23rd, led to a deadly avalanche on the first of March. By late on the 28th, the snow had changed to rain, setting the stage for disaster. (The Weather Channel) 1972 - The Buffalo Creek disaster occurred in the Buffalo Creek Hollow of Logan County in West Virginia. A coal slag dam on the Middle Fork of Buffalo Creek burst sending a fifty foot wall of water down a narrow valley killing 125 persons and causing 51 million dollars damage. Three days of rain atop a six inches snow cover prompted the dam break. (David Ludlum) (The Weather Channel) 1987 - A slow moving storm in the southwestern U.S. spread heavy snow from the southern and central Rockies into the Central High Plains Region. Totals in Colorado ranged up to 62 inches at Purgatory. Colorado Springs CO reported a February record of 14.8 inches of snow in 24 hours. Lander WY received four inches in one hour, 13 inches in seven hours, and a record storm total of 26 inches. High winds created near blizzard conditions at Colorado Springs. Fairplay CO reported 43 inches of snow, with drifts ten feet high. (The National Weather Summary) (Storm Data) 1988 - Eight cities in the central and western U.S. reported new record high temperatures for the date, including Lamoni IA with a reading of 67 degrees. Temperatures in North Dakota were as warm as those in Florida. (The National Weather Summary) 1989 - An upper level weather disturbance brought snow to parts of the central U.S. which just one day earlier were enjoying temperatures in the 60s. Snowfall totals in Missouri ranged up to nine inches at Rolla. (The National Weather Summary) (Storm Data) 1990 - Unseasonably cold weather followed in the wake of the winter storm in the northeastern U.S. Ten cities reported record low temperatures for the date, including Syracuse NY with a reading of 10 degrees below zero. Freezing temperatures in southeastern Virginia caused considerable damage to plants and fruit trees. The barometric pressure reading of 30.88 inches at Wilmington NC was February record for that location. (The National Weather Summary) (Storm Data) 2004 - A major snowstorm dumps up to 20 inches of snow in the Charlotte metropolitan area. Charlotte's third largest snowstorm on record accumulates 11.6 inches at the airport.
-
Slept in a little this morning, and I wake up to 1"+ of snow. Still snowing, so will take a measure later, and report it. Wasn't expecting that much.
-
Ice is back to near normal after warmer wx, and winds.
-
February 25 1934: A late season cold snap produces a bitterly cold low of -46 at Big Falls. For Wednesday, February 25, 2026 1922 - The temperature at Los Angeles, CA, soared to 92 degrees to establish a record for the month of February. (David Ludlum) 1977 - Dust reduced visibilities from eastern Virginia through the southeastern states to Florida between the 24th and the 28th. The dust originated in the western Great Plains on the 22nd and 23rd, with wind gusts above 100 mph reported at Guadalupe Pass TX, at White Sands NM, in Sherman County KS, and in eastern Colorado. (The Weather Channel) 1987 - Low pressure in Nevada produced snow from the southwestern U.S. to the Dakotas. Snowfall totals in Arizona ranged up to 82 inches at Alpine. Flagstaff AZ reported 23 inches of snow in 24 hours. Other heavier snowfall totals included 20 inches at Daggett NV, 24 inches at Brian Head UT, 24 inches at Red Lodge MT, and 26 inches at Angel Fire NM. Snow at Los Alamos NM pushed their snowfall total for the winter past their previous record of 123.5 inches. (The National Weather Summary) (Storm Data) 1988 - Overnight snow squalls in the Lower Great Lakes Region buried Pulaski NY under 17 inches of snow. Sunny and mild weather prevailed across the rest of the nation. Havre MT reported a record high of 66 degrees. (The National Weather Summary) (Storm Data) 1989 - Thirteen cities in Florida reported record low temperatures for the date, including Jacksonville with a reading of 24 degrees. Severe cold in Florida claimed three lives, and resulted in 250 to 300 million dollars crop damage. Unseasonably warm weather prevailed in the central U.S. Dodge City KS reported record high of 80 degrees. (The National Weather Summary) (Storm Data) 1990 - Snow spread across the northeastern U.S. Massachusetts was blanketed with 8 to 15 inches of snow, 5 to 10 inches was reported in Rhode Island, and totals in Connecticut ranged up to 10.5 inches at New Canaan. In central New York State, snow and high winds resulted in a number of chain-reaction multiple accidents, and a total of 108 persons were injured. Snow and high winds created white-out conditions along Interstate 87 in Saratoga County NY. Subzero cold was reported from Minnesota through Michigan to northern New England. Duluth MN reported a record low of 26 degrees below zero. (The National Weather Summary) (Storm Data) 2009 - Two Alaskan communities set their all-time records for highest windspeed. St. Paul registers a wind of 91 mph, and on St George Island the wind reaches 94 mph.
-
So I get hit with a blizzard with 20-40" storm totals, and then the NE gets hit with the same. Ma Nature n Old Man Winter hookin up on a waterbed
-
Breezy, chilly a.m. with -sd's around the area this morning. DLH already has a High Wind Watch for the North Shore for Friday with a strong front moving through.
-
1.9" of snow with that band in just over 2 hrs. A little refresher for the snowpack
-
February 24 1835: The temperature at Ft. Snelling falls 26 degrees in only three hours. For Tuesday, February 24, 2026 1852 - The Susquehanna River ice bridge at Havre de Grace, MD, commenced to break up after forty days of use. A total of 1738 loaded freight cars were hauled along rails laid on the ice. (David Ludlum) 1936 - Vermont and New Hampshire received brown snow due to dust from storms in the Great Plains Region. A muddy rain fell across parts of northern New York State. (24th-25th) (David Ludlum) (The Weather Channel) 1987 - A massive winter storm began to overspread the western U.S. In southern California, Big Bear was blanketed with 17 inches of snow, and Lake Hughes reported four inches of snow in just one hour. Snow pellets whitened coastal areas of Orange County and San Diego County, with three inches at Huntington Beach. The storm also produced thunderstorms with hail and waterspouts. (The National Weather Summary) (Storm Data) 1988 - Strong winds produced snow squalls in the Great Lakes Region which created "white-out" conditions in eastern Upper Michigan. Squalls produced up to 14 inches of snow in Geauga County of northeastern Ohio. (The National Weather Summary) (Storm Data) 1989 - A total of thirty-three cities in the eastern U.S. reported new record low temperatures for the date, and an Atlantic coast storm spread heavy snow from Georgia to southern New England. Snowfall totals in New Jersey ranged up to 24 inches in May County, with 19 inches reported at Atlantic City. Totals in North Carolina ranged up to 18 inches in Gates County, and winds along the coast of North Carolina gusted to 70 mph at Duck Pier. Strong winds gusting to 52 mph created blizzard conditions at Chatham MA. (The National Weather Summary) (Storm Data) 1990 - Strong northerly winds prevailed from Illinois to the Southern and Central Appalachians. Winds gusted to 68 mph at Sewickley Heights PA. High winds caused considerable blowing and drifting of snow across northern and central Indiana through the day. Wind gusts to 47 mph and 6 to 8 inches of snow created white-out conditions around South Bend IN. Traffic accidents resulted in two deaths and 130 injuries. Sixty-five persons were injured in one accident along Interstate 69 in Huntington County. Wind gusts to 60 mph and 4 to 8 inches of snow created blizzard conditions in eastern and northern Ohio. (The National Weather Summary) (Storm Data) 2004 - Heavy snows blanket wide areas of northern New Mexico, closing schools and highways. he mountains east of Santa Fe receive 20 inches. Sandia Park, east of Albuquerque, measures 11 inches. 8 inches falls at Los Alamos.
-
Band of +SN moving through this a.m. with some blowing. 1-2" looks to be what I'll get.
-
Looks like Cook County will be a big winner here with Lake enhanced snows.
-
February 23 1981: Warmth returns to Minnesota with a high of 55 at Pipestone and a high of 52 at Luverne. For Monday, February 23, 2026 1802 - A great snowstorm raged along the New England coast producing 48 inches of snow north of Boston. Three large ships from Salem were wrecked along Cape Cod. (David Ludlum) 1936 - A severe blizzard in the Sierra Nevada Range closed Donner Pass. It stranded 750 motorists and claimed seven lives. (David Ludlum) 1987 - A winter storm buried the Middle Atlantic Coast Region under heavy snow. Totals ranged up to 24 inches at Lancaster PA, with 23 inches at Coatesville PA. During the height of the storm Philadelphia PA received five inches of snow in just one hour. The Washington D.C. area was blanketed with up to 15 inches of snow. (The National Weather Summary) (Storm Data) 1988 - Strong northwesterly winds ushered arctic air into the central U.S., and temperatures in Missouri were thirty degrees colder than the previous day. The strong winds produced squalls along the shore of Lake Superior, with up to 15 inches of snow reported over the Keweenaw Peninsula of Upper Michigan. (The National Weather Summary) (Storm Data) 1989 - Nineteen cities in the central U.S. reported new record low temperatures for the date, including Lincoln NE with a reading of 19 degrees below zero. (The National Weather Summary) 1990 - A fast moving storm produced near blizzard conditions in Michigan. Snowfall totals ranged up to 9.5 inches in Allegan County, wind gusts reached 74 mph at Ann Arbor, and five foot snow drifts were reported around Saginaw. The Michigan AAA records showed more than 5000 traffic accidents reported, a near record for one day. There were several chain reaction collisions. One near Pontiac involved a hundred cars. (The National Weather Summary) (Storm Data)
-
Never really like the standard method. Dense highlights the metrics of wx first, and when it occurred second. But std is normal protocol that is taught, so met folks use that. The biggest difference is usually in the the daily temp records where you see a lot of ties.
-
North Shore looking good on Tues. This weekend, snowmobiles everywhere around here. Add more for the trails.
-
February 22 1922: A blizzard, ice storm and thunderstorms all occur on the same day across Minnesota. Winds hit 50 mph in Duluth while thunderstorms were reported in the Twin Cities. Heavy ice over southeast Minnesota with 2 inches of ice on wires near Winona. Over two inches of precipitation fell. This was also one of the largest ice storms ever in Wisconsin history with ice four inches in diameter on telegraph wires. One foot of ice covered wire weighed 11 pounds. One killed and four injured in Wisconsin. For Sunday, February 22, 2026 1773 - The memorable "Cold Sabbath" in New England history. Many persons froze extremities while going to church. (David Ludlum) 1936 - Although heat and dust prevailed in the spring and summer, early 1936 brought record cold to parts of the U.S. Sioux Center IA reported 42 inches of snow on the ground, a state record. (20th-22nd) (The Weather Channel) 1986 - A twelve day siege of heavy rain and snow, which produced widespread flooding and mudslides across northern and central California, finally came to an end. The storm caused more than 400 million dollars property damage. Bucks Lake, located in the Sierra Nevada Range, received 49.6 inches of rain during the twelve day period. (Storm Data) 1987 - A storm moving northeastward out of the Gulf of Mexico began to spread heavy snow across the Middle Atlantic Coast Region. Thunderstorms in northern Florida produced wind gusts to 65 mph in Alachua County. (The National Weather Summary) (Storm Data) 1988 - Dry weather prevailed across the nation, with windy conditions from the Central Rockies to northern New England. Winds gusted to 58 mph at Cleveland OH, and reached 63 mph at Erie PA. Winds in the Central Rockies gusted to 120 mph at Mines Peak CO and Rendezvous Peak WY. (The National Weather Summary) (Storm Data) 1989 - Strong northwesterly winds ushering cold arctic air into the north central U.S. produced snow squalls in the Great Lakes Region, with heavy snow near Lake Michigan. Totals in northwest Indiana ranged up to 24 inches at Gary, and up to 16 inches buried northeastern Illinois. (The National Weather Summary) (Storm Data) 1990 - Thunderstorms developing along and ahead of a cold front produced severe weather from southern Mississippi to North Carolina. One thunderstorm spawned a tornado just prior to dawn which touched down near Opp AL injuring ten persons and causing half a million dollars damage. Thunderstorm winds injured four persons south of Troy AL, and five people at Columbus GA. Thunderstorm winds gusted to 76 mph at Dothan AL. (The National Weather Summary) (Storm Data)
-
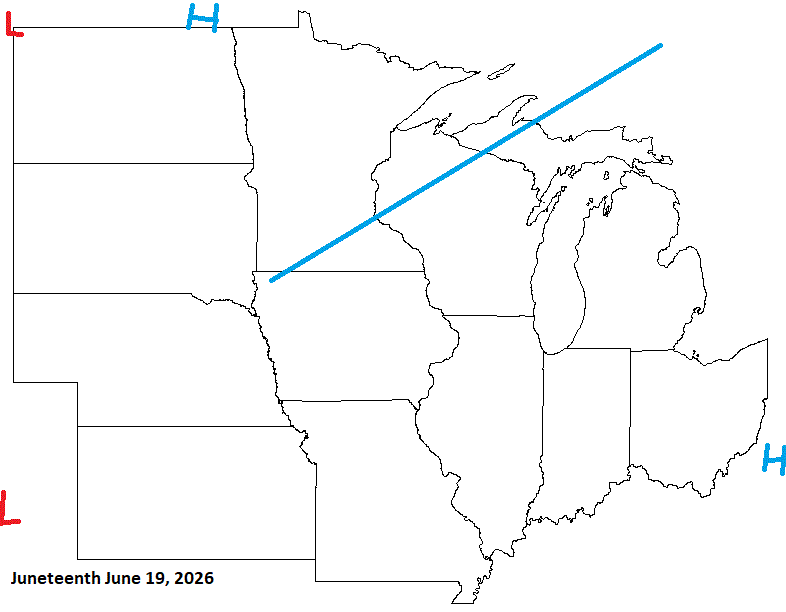
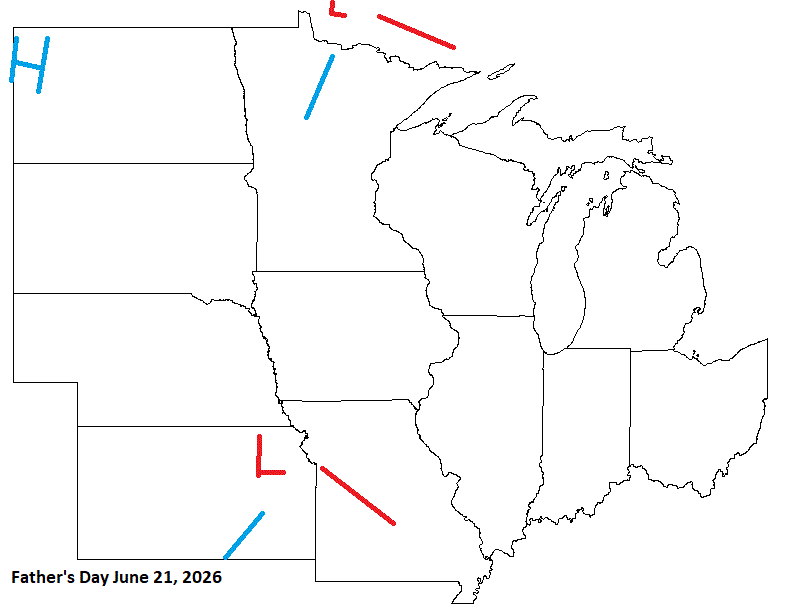
Juneteenth, and Father's Day are a couple days apart. Father's Day is also on the Summer Solstice. Front moving through quickly on the 19th with another round of shwrs/stms on the 21st. Concerned about this Father's Day. Might get rather frisky that day.
-
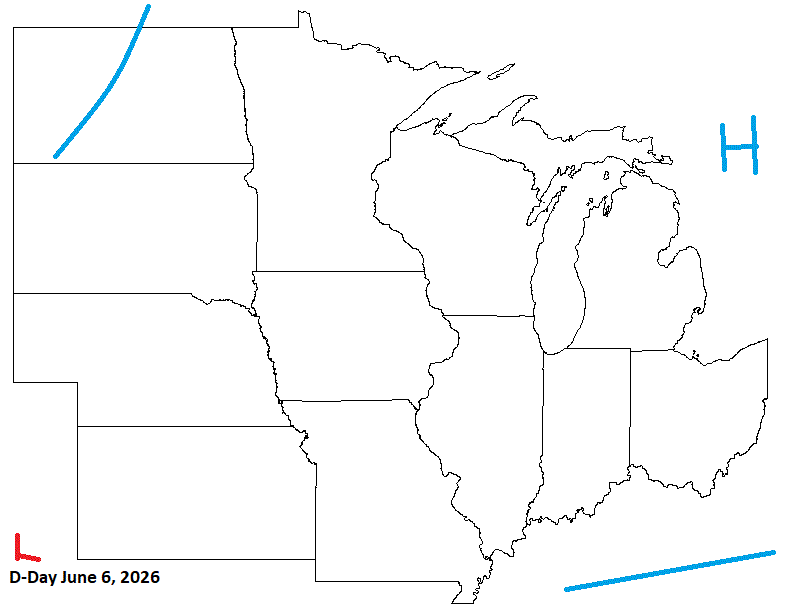
D-Day in early June look pretty fair with HP exiting, and a front moving into the W sub.
-
Was just looking at solar data. Sun looks to be going blank already in the cycle. Seems a little early for that. It will not last long, but interesting, nonetheless. https://solarham.com/
-
Cloudy am with FL. Ice is reforming on Agate bay where the ore docks are located (seen from webcam there). Temps in the sd's inland with 10's along the shore. Those high winds chewed the ice on the Lake pretty good.

