

MN Transplant
-
Posts
17,493 -
Joined
-
Last visited
Content Type
Profiles
Blogs
Forums
American Weather
Media Demo
Store
Gallery
Everything posted by MN Transplant
-
December 22-23, 2022: Warm Rain to Arctic Chill
MN Transplant replied to WxUSAF's topic in Mid Atlantic
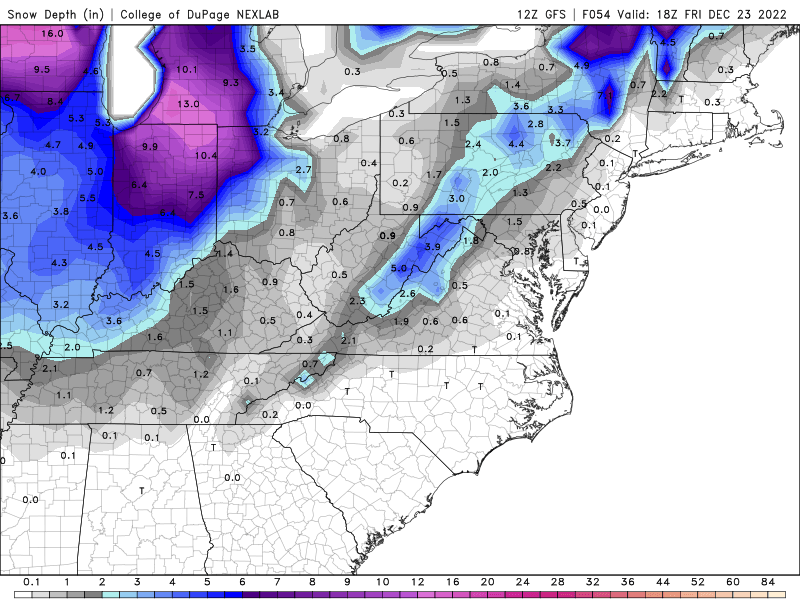
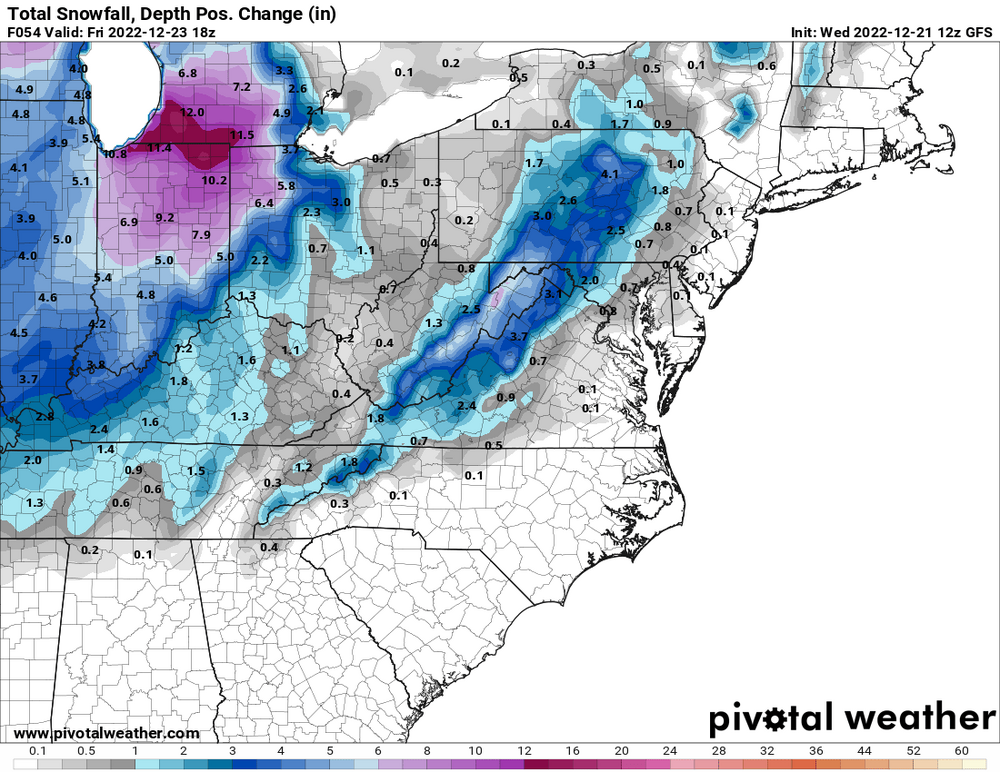
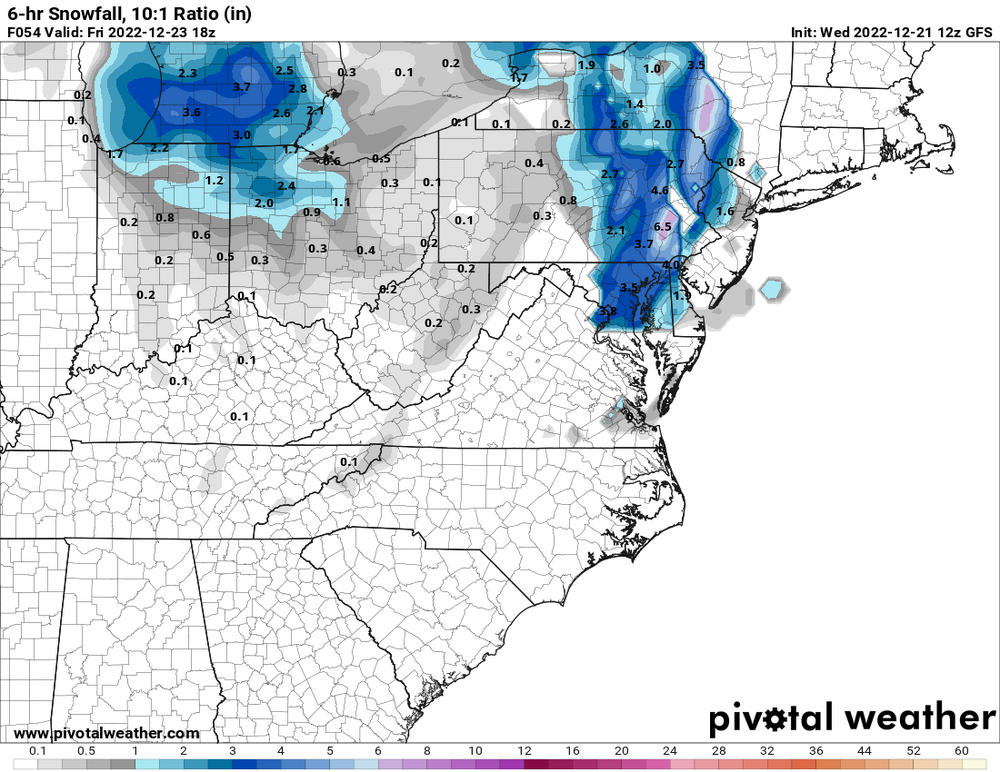
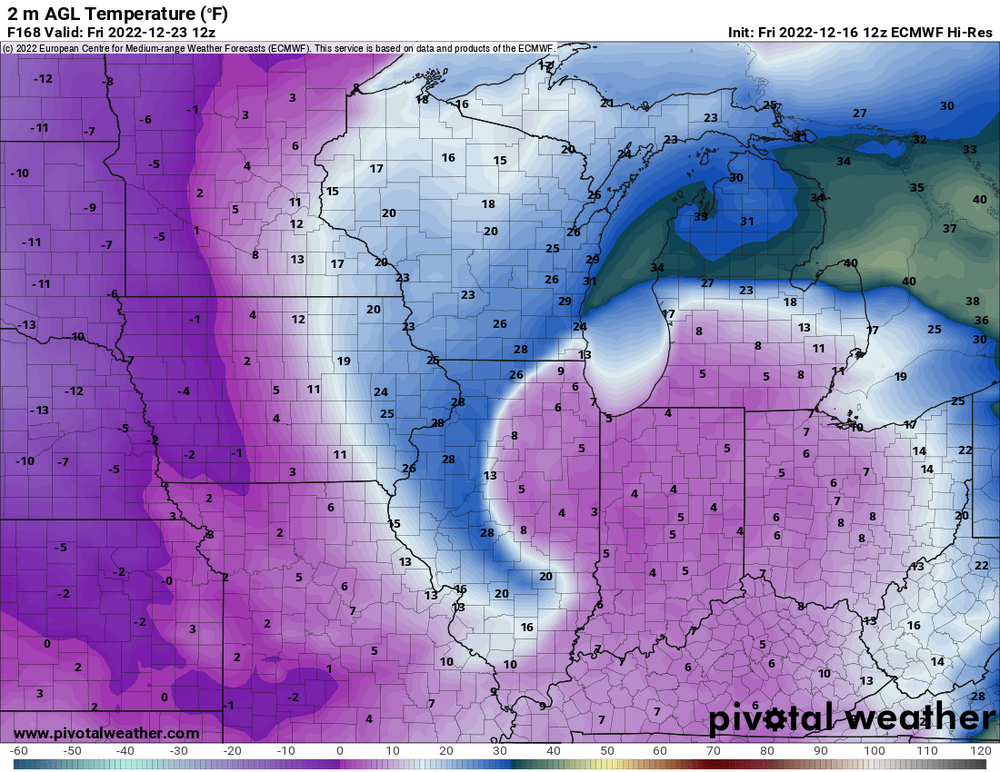
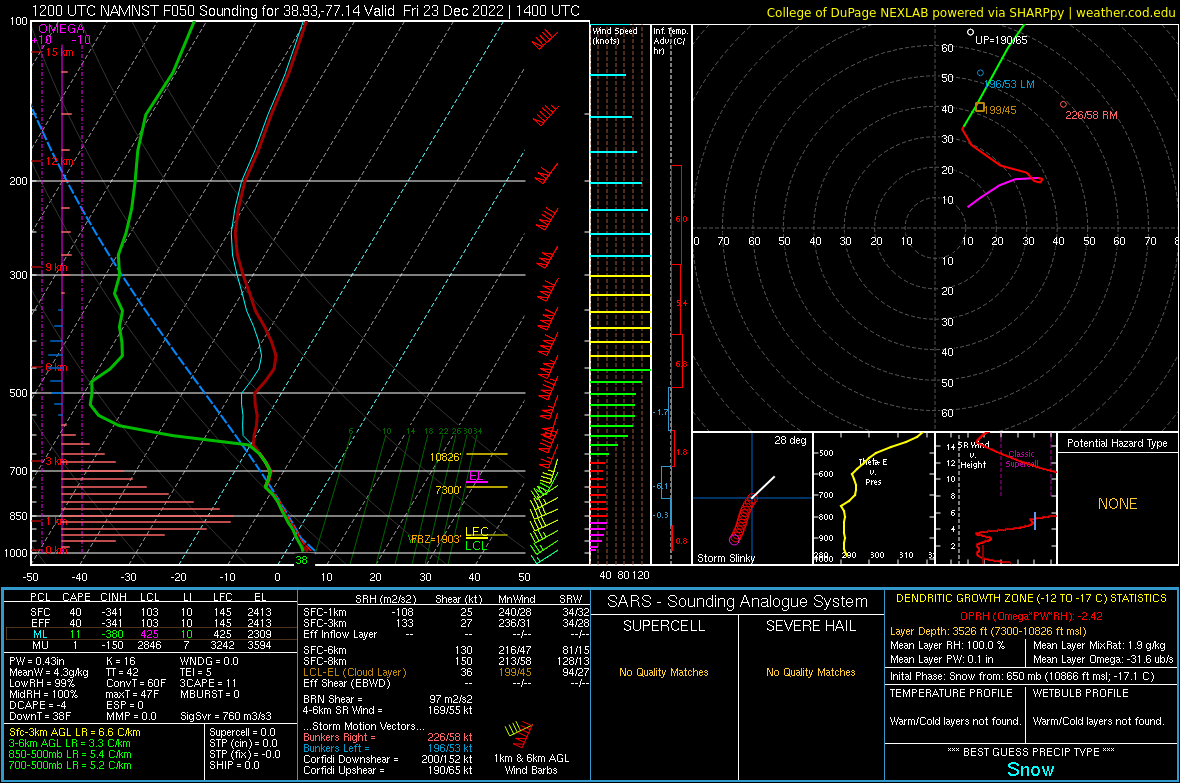
Here's further proof that some of the snow maps we are seeing from the GFS are simply processing artifacts. Check out the following examples from Dupage and Pivotal. The snow accumulation products are clearly not able to handle the fast-moving front and are incorrectly partitioning the precipitation between rain and snow. However, the snow depth products do not have the same problem. The GFS may still be wrong about 0.5-1.0" on the backside of the front, but that is the actual projection.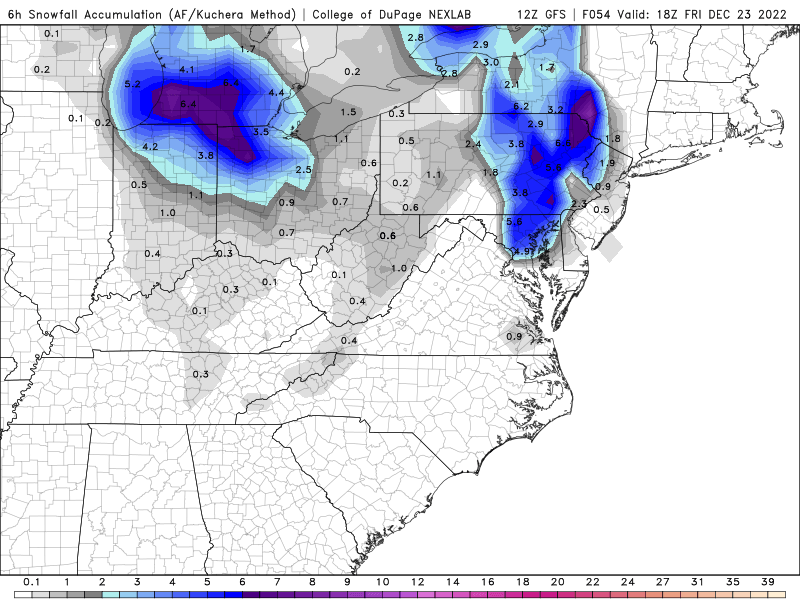
-
While I generally agree with the overall sentiment you are conveying, there is a real chance that DCA may see a record low max on Christmas Eve (current record, 23). This is a very solid cold air shot one month before our peak climo cold.
-
December 22-23, 2022: Warm Rain to Arctic Chill
MN Transplant replied to WxUSAF's topic in Mid Atlantic
This is as the front is coming through my area of the DC burbs.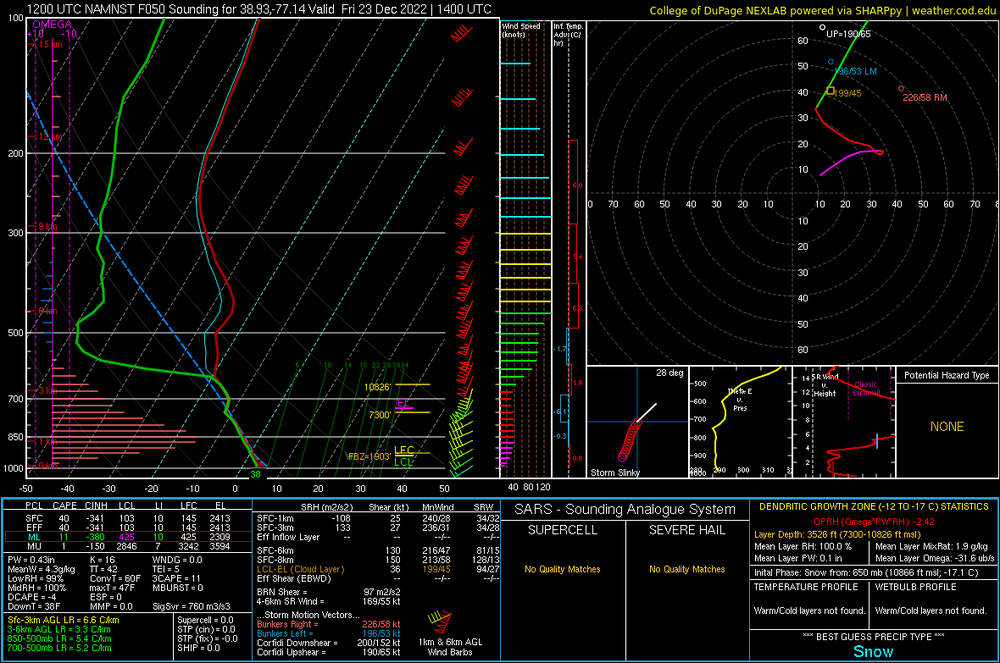
-
December 22-23, 2022: Warm Rain to Arctic Chill
MN Transplant replied to WxUSAF's topic in Mid Atlantic
The 6z NAM Nest was a good scenario for us. One interesting thing that has been happening is that the models have done away with the Friday morning warmth. Instead of the 50s, we are in the lower 40s before the front blasts through. -
December 22-23, 2022: Warm Rain to Arctic Chill
MN Transplant replied to WxUSAF's topic in Mid Atlantic
Good to know. What is the time step now for the GFS? -
December 22-23, 2022: Warm Rain to Arctic Chill
MN Transplant replied to WxUSAF's topic in Mid Atlantic
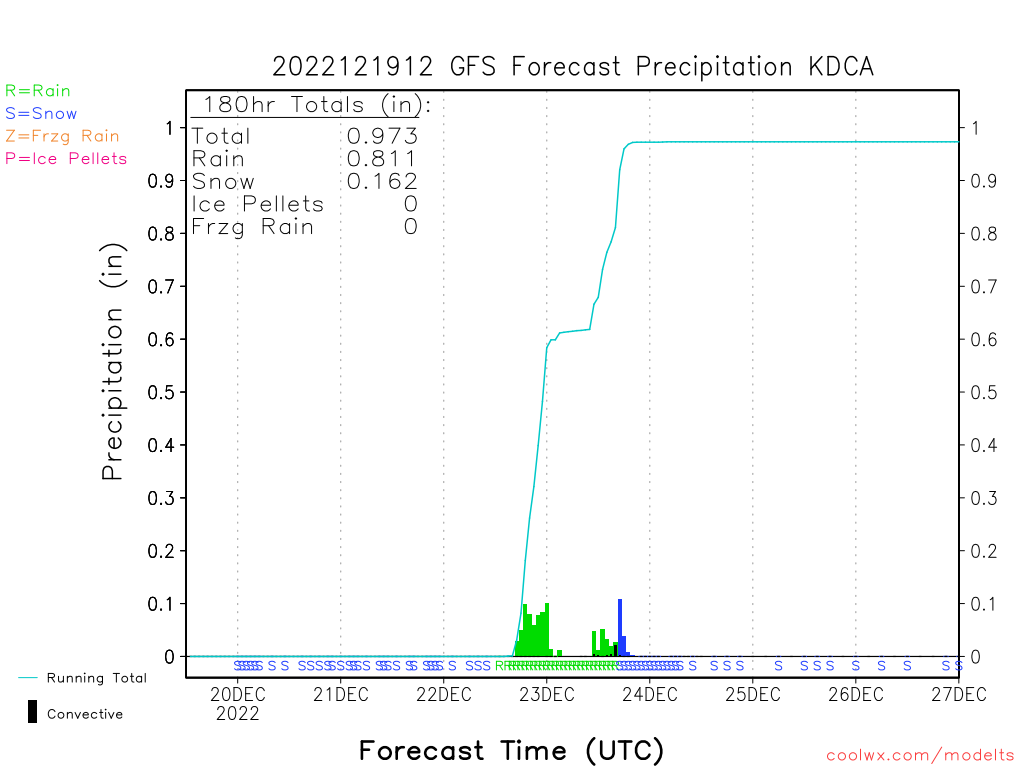
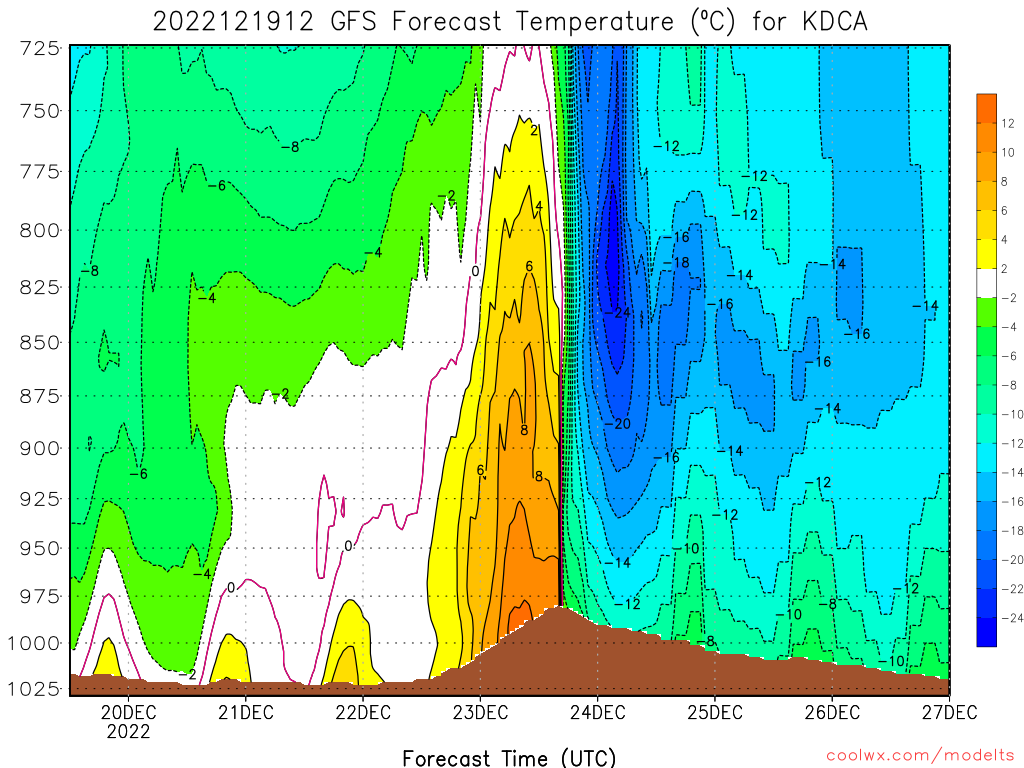
Here's an example from CoolWx, with hourly GFS output. It still has to assign a precip type to an entire hour period, and I'd be willing to be that the little spike there is not all snow precip in the model. Below that is a cool vertical view of the temperature structure.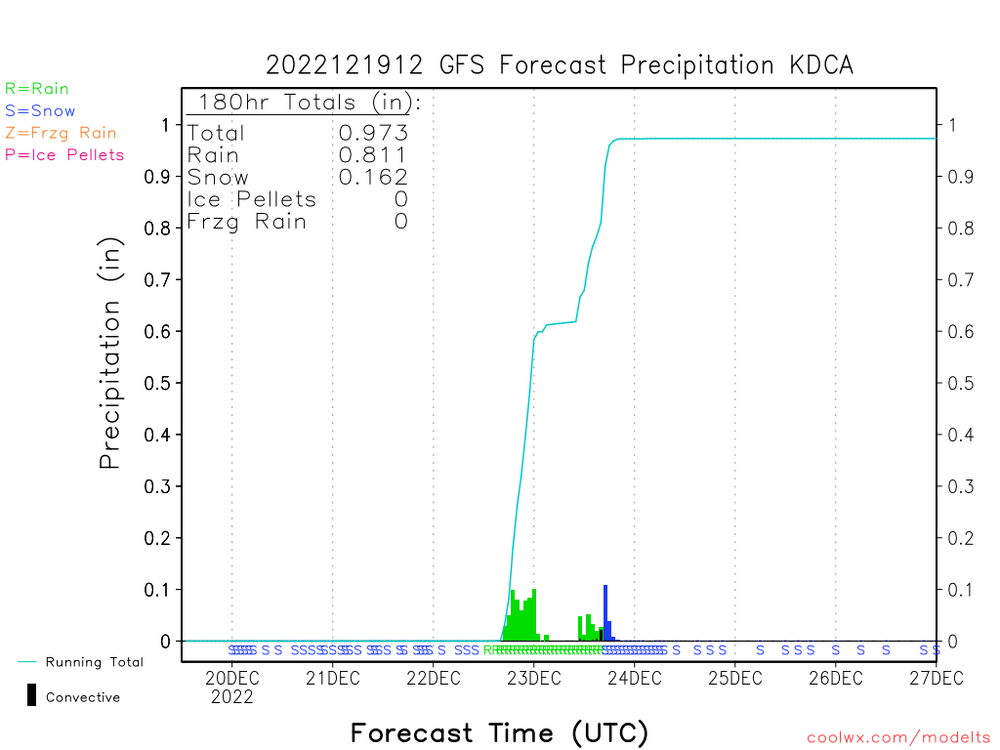

-
December 22-23, 2022: Warm Rain to Arctic Chill
MN Transplant replied to WxUSAF's topic in Mid Atlantic
Looks like peak gusts in the mid 40s to around 50 on Friday per the GFS, Euro, and ICON. Potentially higher near the Bay and for our upslope friends. -
December 22-23, 2022: Warm Rain to Arctic Chill
MN Transplant replied to WxUSAF's topic in Mid Atlantic
Everything about that map screams temporal resolution problems. -
December 22-23, 2022: Warm Rain to Arctic Chill
MN Transplant replied to WxUSAF's topic in Mid Atlantic
I assume the snow algorithms are just having a tough time with the speed of the front. -
Final play of Pats/Raiders
-
GFS does the same. We know that December snow climo around here stinks, but the GFS and Euro are suggesting that Boston may get to New Year's with 1.0" on the year, and NYC with a T. So, it isn't like we are alone in missing out.
-
The band is sinking south. 4th Q might be good.
-
I don’t have the words. That first half never should have happened, but damn what a comeback.
-
We got absolutely screwed. That was the tying TD (plus conversion)
-
They aren't built to go far in the playoffs. They are a mid-tier team that has played well in clutch situations, but the switch to the Fangio defense under Donatell has been a full-on failure.
-
Imagine losing to the Vikings this year. The Vikings have a serious problem of snowball games. When things go off track and they become one-dimensional, the OL can't keep up and the D is just really bad. This game is still likely a loss, but without the blocked punt TD and the Cook fumble, it is much closer.
-
The euro isn't what we want in the end, but you have to marvel at a setup that would produce this temperature structure.
-
Euro top, GFS bottom
.thumb.png.c65e22420d994c2e2a36413cb87d33bf.png)
-
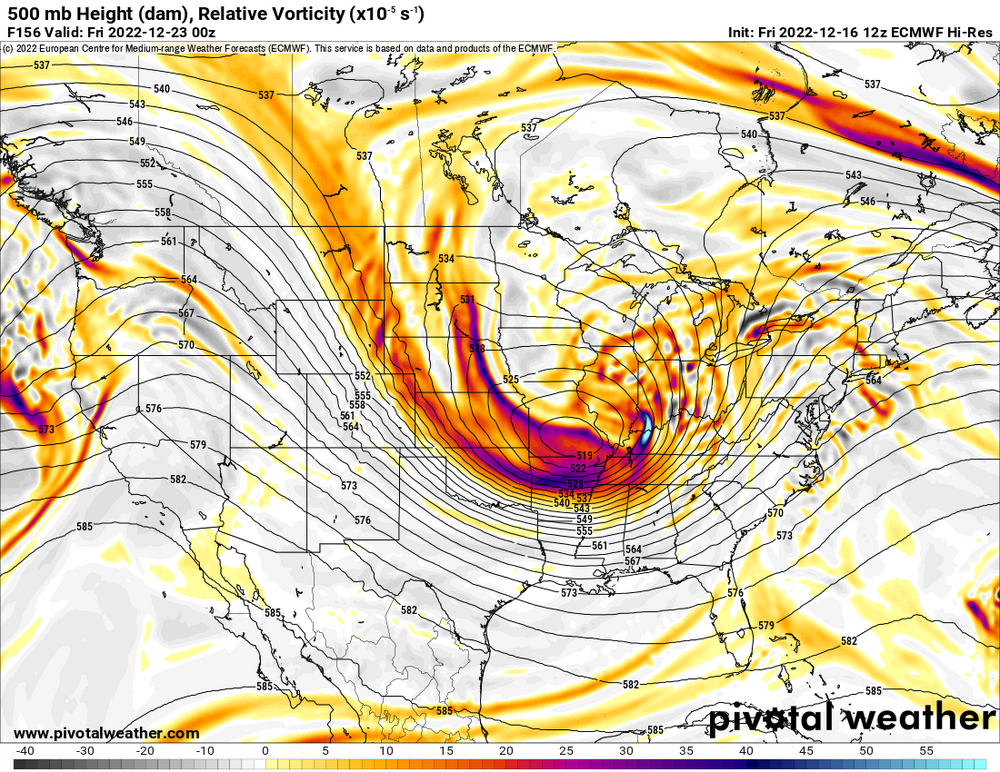
500 low is diving. Primary is in the midwest, but we care whether we can get the 500 far enough south to pop a new surface low.
-
The 12z run has a closed low over central South Dakota. 00z had more of an elongated low/trough sweeping through MN/WI at the same time.
-
Winter 2022-2023 Digital Snow Thread
MN Transplant replied to SnowenOutThere's topic in Mid Atlantic
You want to grab the full run weenie map, you know, for fun? -
50kts at 925mb as the storm wraps up
-
971 over Ocean City. Oh my.
-
There are a ton of Germans up in Minnesota. Looking good at 162.
-
My 8 year old thinks that the S word is "stupid". We've sheltered her. But more importantly, no older siblings.


.png.a58c81f21f25e37564d8d6bc1256972c.png)
