
MN Transplant
-
Posts
17,947 -
Joined
-
Last visited
Content Type
Profiles
Blogs
Forums
American Weather
Media Demo
Store
Gallery
Everything posted by MN Transplant
-
We get a nice NW flow when the hurricane curves off to sea.
-
Not so fast. With the 100 at IAD too, i think@RickinBaltimore took the lead.
-
BWI got 100
-
Highs as of the 2pm ob: DCA: 94 IAD: 97 BWI: 97
-
It seems like you’ve just lost contact with the outside unit. I think for some of these the barometer is in the display until. What is your power source outside?
-
IAD and my station are running slightly ahead of yesterday. BWI about even and DCA a touch behind.
-
Yup, it doesn’t take long unfortunately. Measurable rain once here in 2.5 weeks.
-
All records, of course.
-
Sets us up for tomorrow with the slightly higher 850s.
-
DCA joins the 98+ cohort
-
Screams dry downslope. Amazing.
-
Might be a fake 5-min 99 unless the NWS has confirmed it. The official ob was 98. IAD at least 98. DCA at least 96. 94.8 is the high at home.
-
The 5-minute ob reminder. There will never be a 98 degree 5-min ob (only the hourly obs at 52 or 53 past) because of the silly rounding that is done, but any 100 is legit.
-
It is all about finding lifeguards.
-
Since you and I have DCA/IAD identical, I really just need BWI to hit 100 and not RIC. Of course, we are both going to lose when IAD/DCA hit 100 tomorrow.
-
Our pool was hopping too, but they are open for two more weekends (and 4-8pm during the week).
-
DCA is running well ahead of yesterday while IAD is a touch ahead. The clouds hung around yesterday so the comparisons are a bit tough to make. My station is actually a degree behind.
-
March 1907 is amazing. There are 4 record highs that still stand including the hottest March temp (93).
-
98 at DCA. Believe that is the new high for the year.
-
Topped my high from yesterday. 94.5 and gross.
-
A lot of the entries are still in play. Stupid BWI pavement stopped working.
-
I was tracking IAD for a while earlier today but fell off the pace. Only 94.
-
93.4 is the high so far here.
-
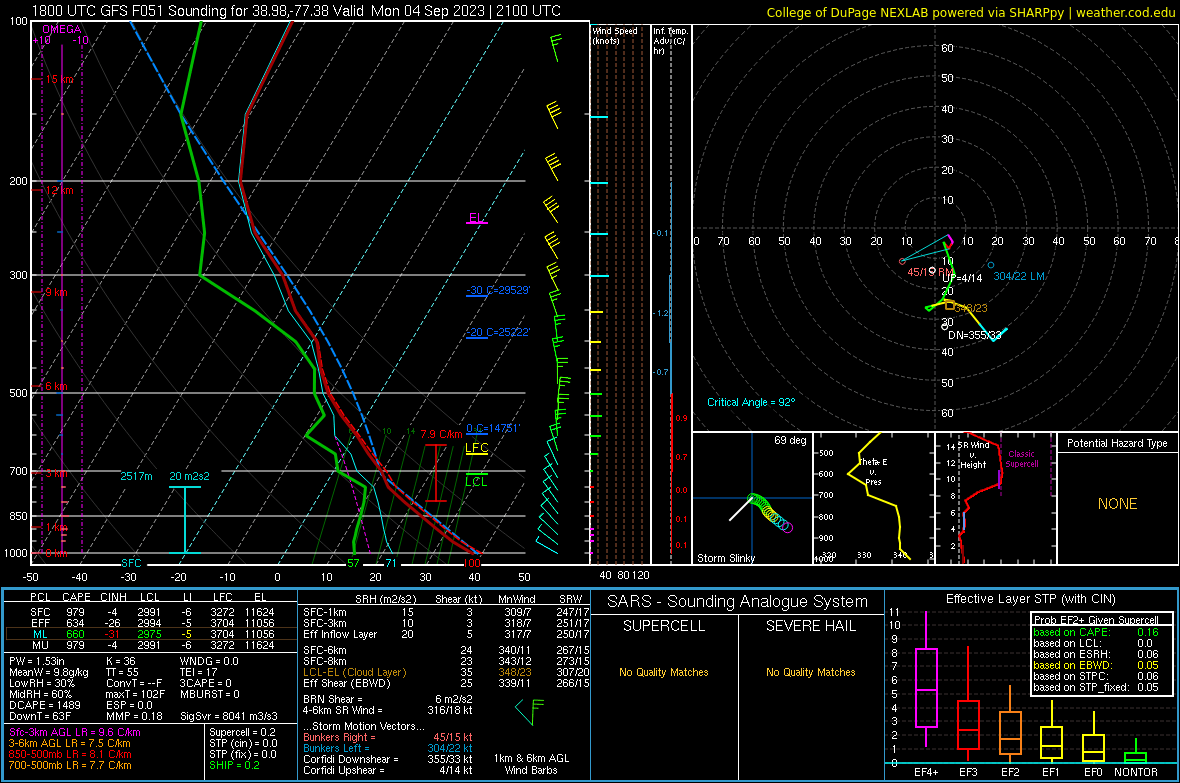
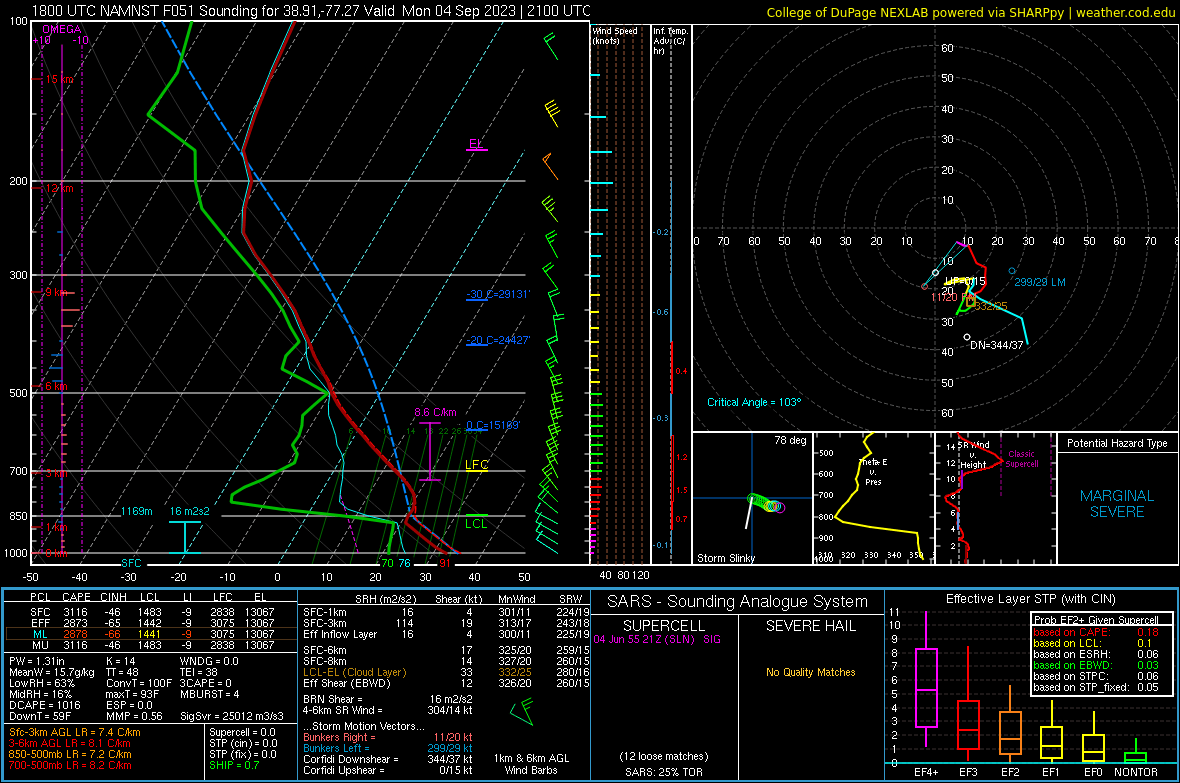
These differences are just wild for Monday afternoon. The NAM seems way too humid at the low levels, but the GFS mixing depth is, uh, let's go with aggressive.
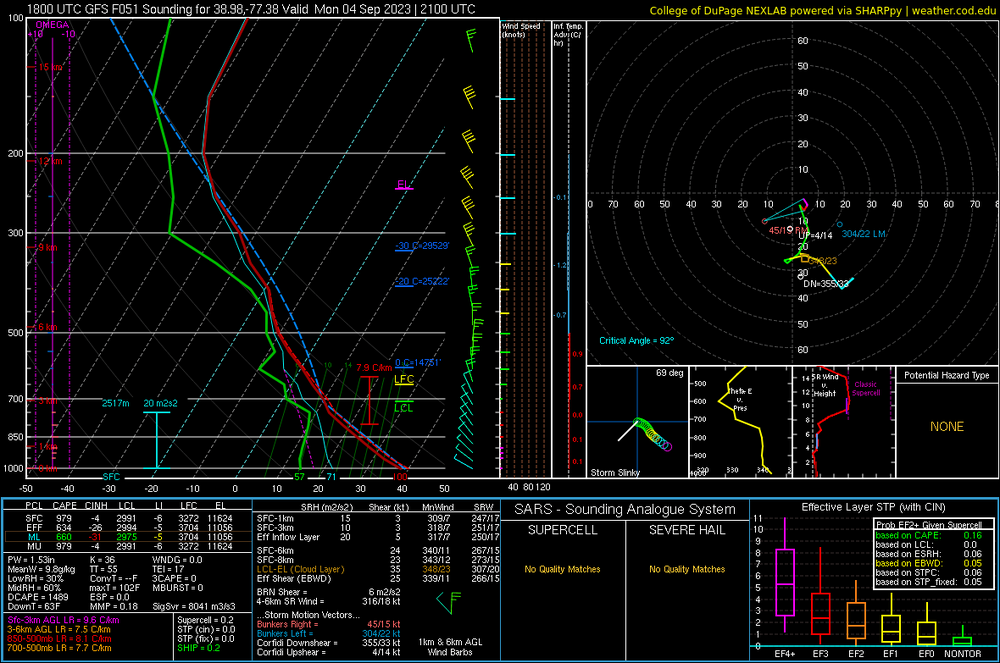
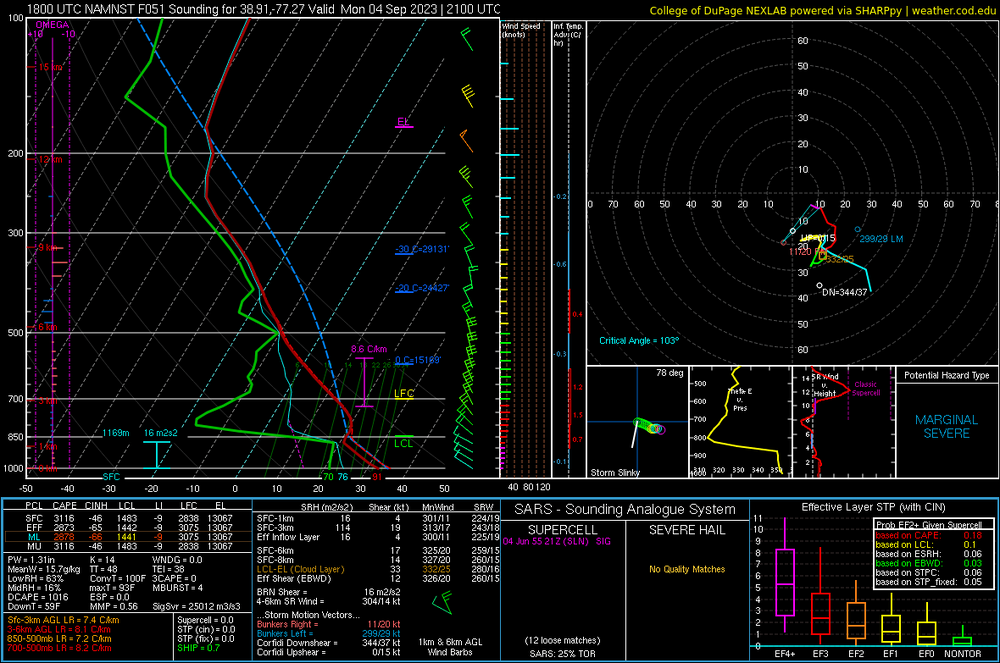
-
Yeah. This is a brutal image. The +2 period is basically ending in 2040, +3 in 2060, and +4 in 2080. Projected changes to mean annual snowfall (%) at Toronto, Ontario (a); Montréal, Québec (b); Halifax, Nova Scotia (c); Boston, Massachusetts (d); New York City, New York (e); and Washington, D.C. (f) for the three global warming levels. Relative changes with respect to the 1980–2009 mean are plotted for each CRCM5 simulation (symbols indicated in the legend). A kernel density estimation of the distribution of projected changes among the CRCM5-ClimEx simulations is shaded in the gray violin plots generated using the Seaborn package (Waskom, 2021). Within each violin plot, a smaller box plot is included indicating the median (white dot), 25th–75th percentile (dark gray box) and complete range of the CRCM5-ClimEx data (dark gray vertical lines). Values calculated from the pooled data for all 50 ClimEx members are indicated by the purple circles. Signal-to-noise ratio (S/N) calculated from the ClimEx data is indicated under each violin plot.