

MN Transplant
-
Posts
17,493 -
Joined
-
Last visited
Content Type
Profiles
Blogs
Forums
American Weather
Media Demo
Store
Gallery
Everything posted by MN Transplant
-
2023 Mid-Atlantic Severe Wx Thread (General Discussion)
MN Transplant replied to Kmlwx's topic in Mid Atlantic
Just got the cell phone alert for 80mph. -
2023 Mid-Atlantic Severe Wx Thread (General Discussion)
MN Transplant replied to Kmlwx's topic in Mid Atlantic
TDCA with 70+ headed toward Manassas- 2,785 replies
-
- 3
-

-
- severe
- thunderstorms
- (and 3 more)
-
2023 Mid-Atlantic Severe Wx Thread (General Discussion)
MN Transplant replied to Kmlwx's topic in Mid Atlantic
It's going to be on me before it has time to take off, if it does. -
2023 Mid-Atlantic Severe Wx Thread (General Discussion)
MN Transplant replied to Kmlwx's topic in Mid Atlantic
76mph pixel on the tor warned cell just entering Loudoun.- 2,785 replies
-
- 6
-
-
- severe
- thunderstorms
- (and 3 more)
-
2023 Mid-Atlantic Severe Wx Thread (General Discussion)
MN Transplant replied to Kmlwx's topic in Mid Atlantic
There's the warning- 2,785 replies
-
- 2
-
-
- severe
- thunderstorms
- (and 3 more)
-
2023 Mid-Atlantic Severe Wx Thread (General Discussion)
MN Transplant replied to Kmlwx's topic in Mid Atlantic
The multiple bowing segments idea seems to be winning. The line in VA doesn't look very impressive on reflectivity, but there are still 60mph+ velocity readings just north of 66. -
2023 Mid-Atlantic Severe Wx Thread (General Discussion)
MN Transplant replied to Kmlwx's topic in Mid Atlantic
This isn't the derecho. That was a truly special airmass.- 2,785 replies
-
- 3
-
-
- severe
- thunderstorms
- (and 3 more)
-
2023 Mid-Atlantic Severe Wx Thread (General Discussion)
MN Transplant replied to Kmlwx's topic in Mid Atlantic
18z HRRR with less wind coverage, but one intense area (67kt). However, per usual, it is running dew points 5 degrees below actual.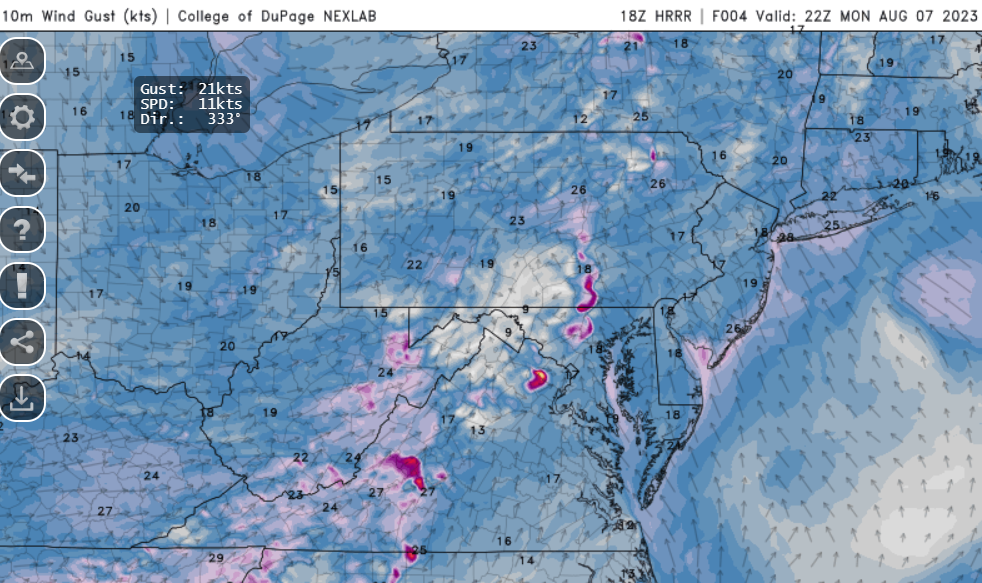
-
2023 Mid-Atlantic Severe Wx Thread (General Discussion)
MN Transplant replied to Kmlwx's topic in Mid Atlantic
HRRR gusts again 17z. Just seeing how it does with the character of the event.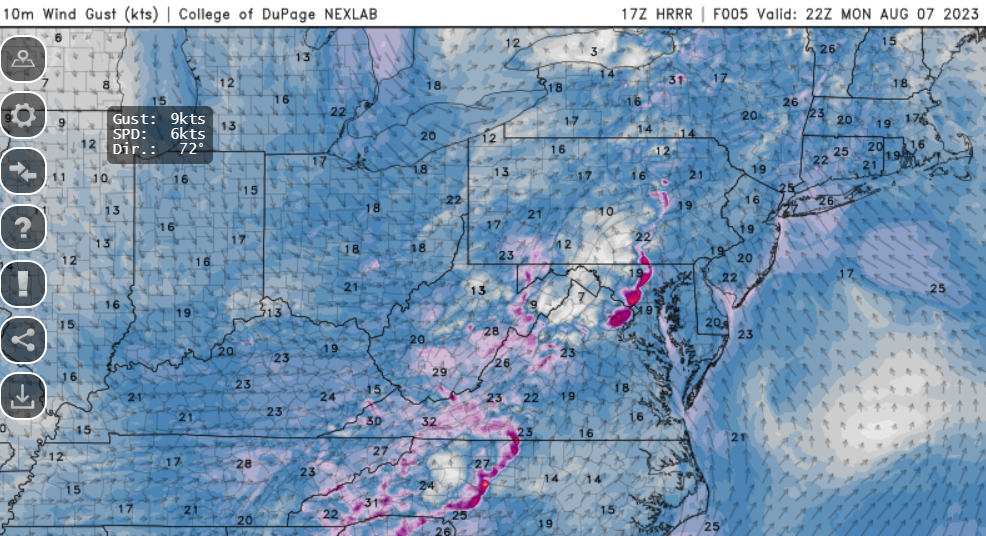
-
2023 Mid-Atlantic Severe Wx Thread (General Discussion)
MN Transplant replied to Kmlwx's topic in Mid Atlantic
It is favoring distinct bowing segments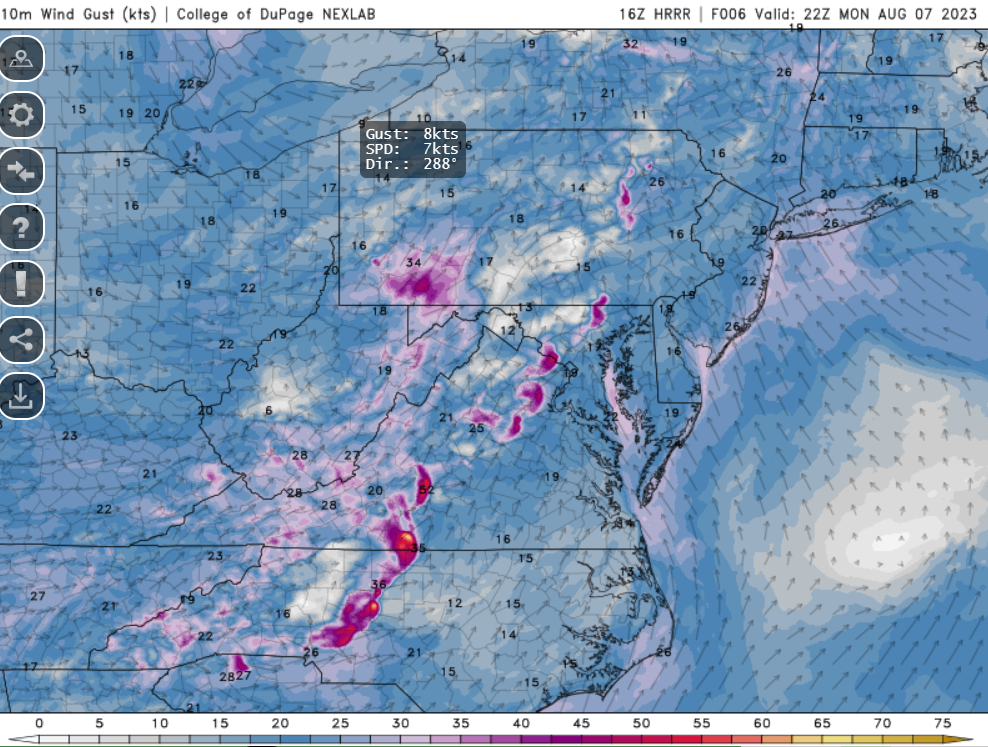
- 2,785 replies
-
- 6
-
-
- severe
- thunderstorms
- (and 3 more)
-
2023 Mid-Atlantic Severe Wx Thread (General Discussion)
MN Transplant replied to Kmlwx's topic in Mid Atlantic
The higher deck of clouds were preventing the sun from doing work on the lower deck. Now that the higher clouds have passed, it is only a matter of time. I see blue. 78.7 and humid.- 2,785 replies
-
- 7
-
-
- severe
- thunderstorms
- (and 3 more)
-
2023 Mid-Atlantic Severe Wx Thread (General Discussion)
MN Transplant replied to Kmlwx's topic in Mid Atlantic
That’s a good idea. From everything I’ve read that location is now completely desiccated from the ongoing mega drought, so sight lines should be good.- 2,785 replies
-
- 8
-

-
- severe
- thunderstorms
- (and 3 more)
-
Kinda thought we’d do better than 0.07” with that line
-
Low of 63 and thankful the smoke is mostly staying aloft
-
The smoke is causing at least a 30% reduction in incoming solar on my station. Sitting at an amazing 76.5 in the afternoon on August 1st.
-
0.90" yesterday for a healthy 7.83" July precip total.
-
Where are you getting 99 at BWI?
-
96/96/97
-
2023 Mid-Atlantic Severe Wx Thread (General Discussion)
MN Transplant replied to Kmlwx's topic in Mid Atlantic
But, DC split?- 2,785 replies
-
- 5
-
-
-
- severe
- thunderstorms
- (and 3 more)
-
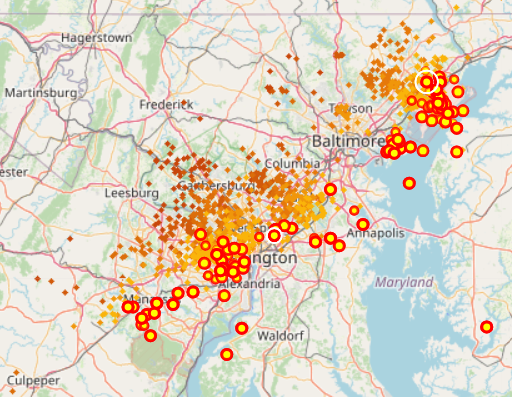
lightningmaps.org
-
2023 Mid-Atlantic Severe Wx Thread (General Discussion)
MN Transplant replied to Kmlwx's topic in Mid Atlantic
60mph at DCA per NWS on Twitter- 2,785 replies
-
- 1
-
-
- severe
- thunderstorms
- (and 3 more)
-
No severe here, but loud and a 11"/hr rain rate. The T&L is spectacular. edit - 10 seconds after I sent that there was a CG that made me jump. Wow.
-
2023 Mid-Atlantic Severe Wx Thread (General Discussion)
MN Transplant replied to Kmlwx's topic in Mid Atlantic
NW DC is about to get nailed. Definitely the loudest storm of the year over here, but it doesn't look like I'll get big wind. -
Getting loud out there. Topped out at 94.3, so it ended up as a 93/95/94 stretch at home.
-
2023 Mid-Atlantic Severe Wx Thread (General Discussion)
MN Transplant replied to Kmlwx's topic in Mid Atlantic
That warning box is massive