MN Transplant
-
Posts
17,845 -
Joined
-
Last visited
Content Type
Profiles
Blogs
Forums
American Weather
Media Demo
Store
Gallery
Everything posted by MN Transplant
-
The squirrels are freaking everywhere. My 6 and 18 month old pups are a handful on walks. Some of the idiot squirrels run right in front of them.
-
6" for December puts me only a few inches below normal on the year. As of December 10th I was still running last place over the past 10 years, but the three storms bumped me over 2016 and 2017.
-
Best spot for snow vacation home within 4 hours of NOVA
MN Transplant replied to SnowenOutThere's topic in Mid Atlantic
Does anyone just buy a lot and plop down a pre-fab house? -
Evergreen post
-
‘09/10 was Canada’s warmest winter on record to that point.
-
NWS has gusts to 40mph. That makes sense.
-
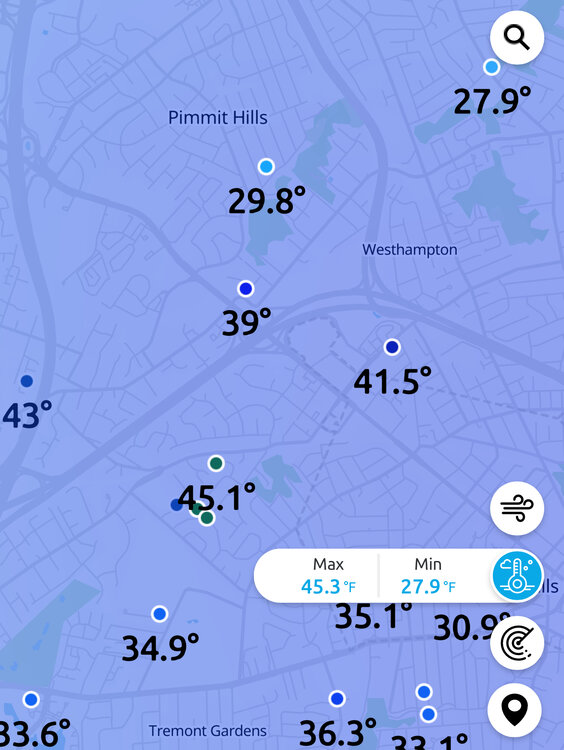
Casual 17 degree spread over a couple of miles
-
This would be a bummer for a lot of places that are used to a White Christmas.
-
The coast may get interesting, but those SE winds rarely ever mix down inland.
-
Probably. We can all use our Reddit alts.
-
Not gonna lie, I read the name as Kestrel and thought it was appropriate
-
That is shockingly comical
-
Was that the one where they lost track of the snow board?
-
DCA's ASOS is on the east (river) side of the runways. It is not near the buildings. Now, the snowfall measurement location is a completely different issue, but they seem to have fixed that in the past 5 years or so.
-
Mid-Atlantic Snow Totals Thread - Winter 2023-2024
MN Transplant replied to mattie g's topic in Mid Atlantic
12/11/2023 - 0.7" -
It is always sun angle season
-
After driving down towards the river, I’m shocked that DCA did get on the board. There is no sign at all that it snowed, other than the cars that came in from higher elevations.
-
Revising mine to 0.7” after a few more measurements. 1.58” total liquid. Hard to get a good snow water equivalent, but my best guess is a 3:1 ratio.
-
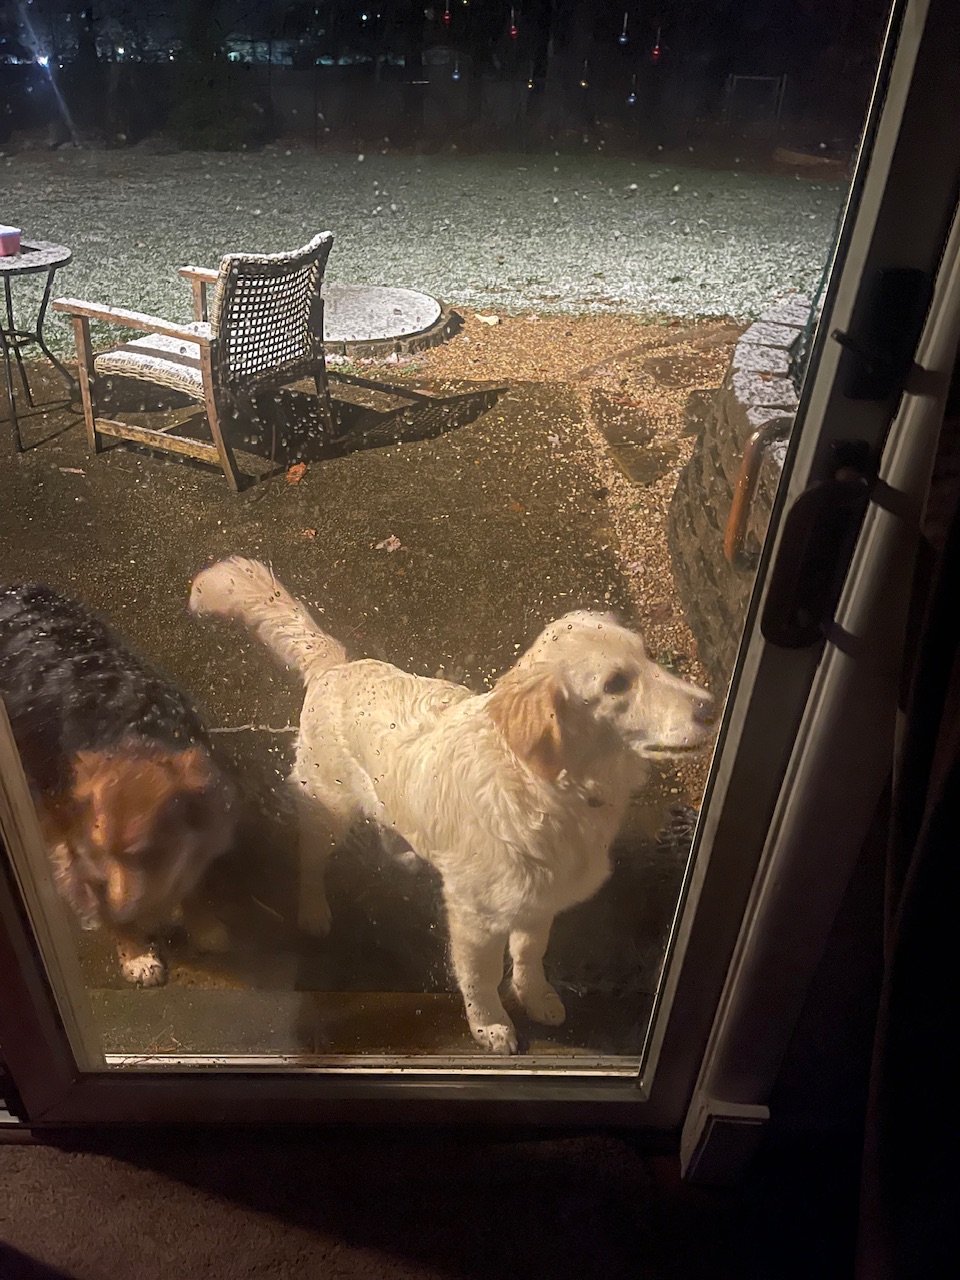
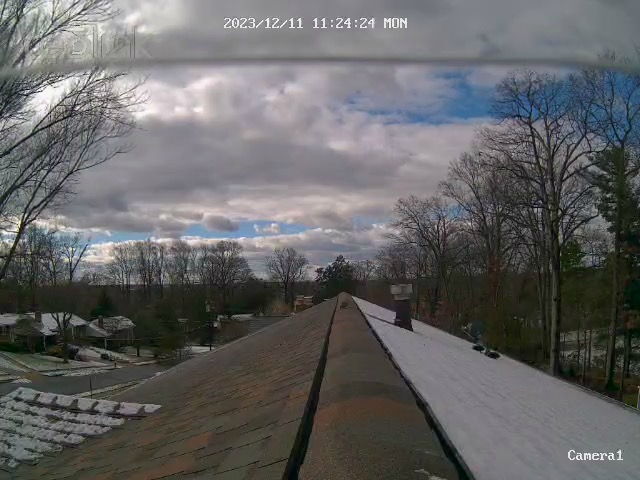
Tried to give the white one her first snow experience. I don’t think she wanted to be up and about.

-
Beautiful. Grass is white. Surprised by the temp down to 32.4.
-
The Vikings have set back football 100 years in the past two weeks. And they are still in the 6th seed in the NFC.
-
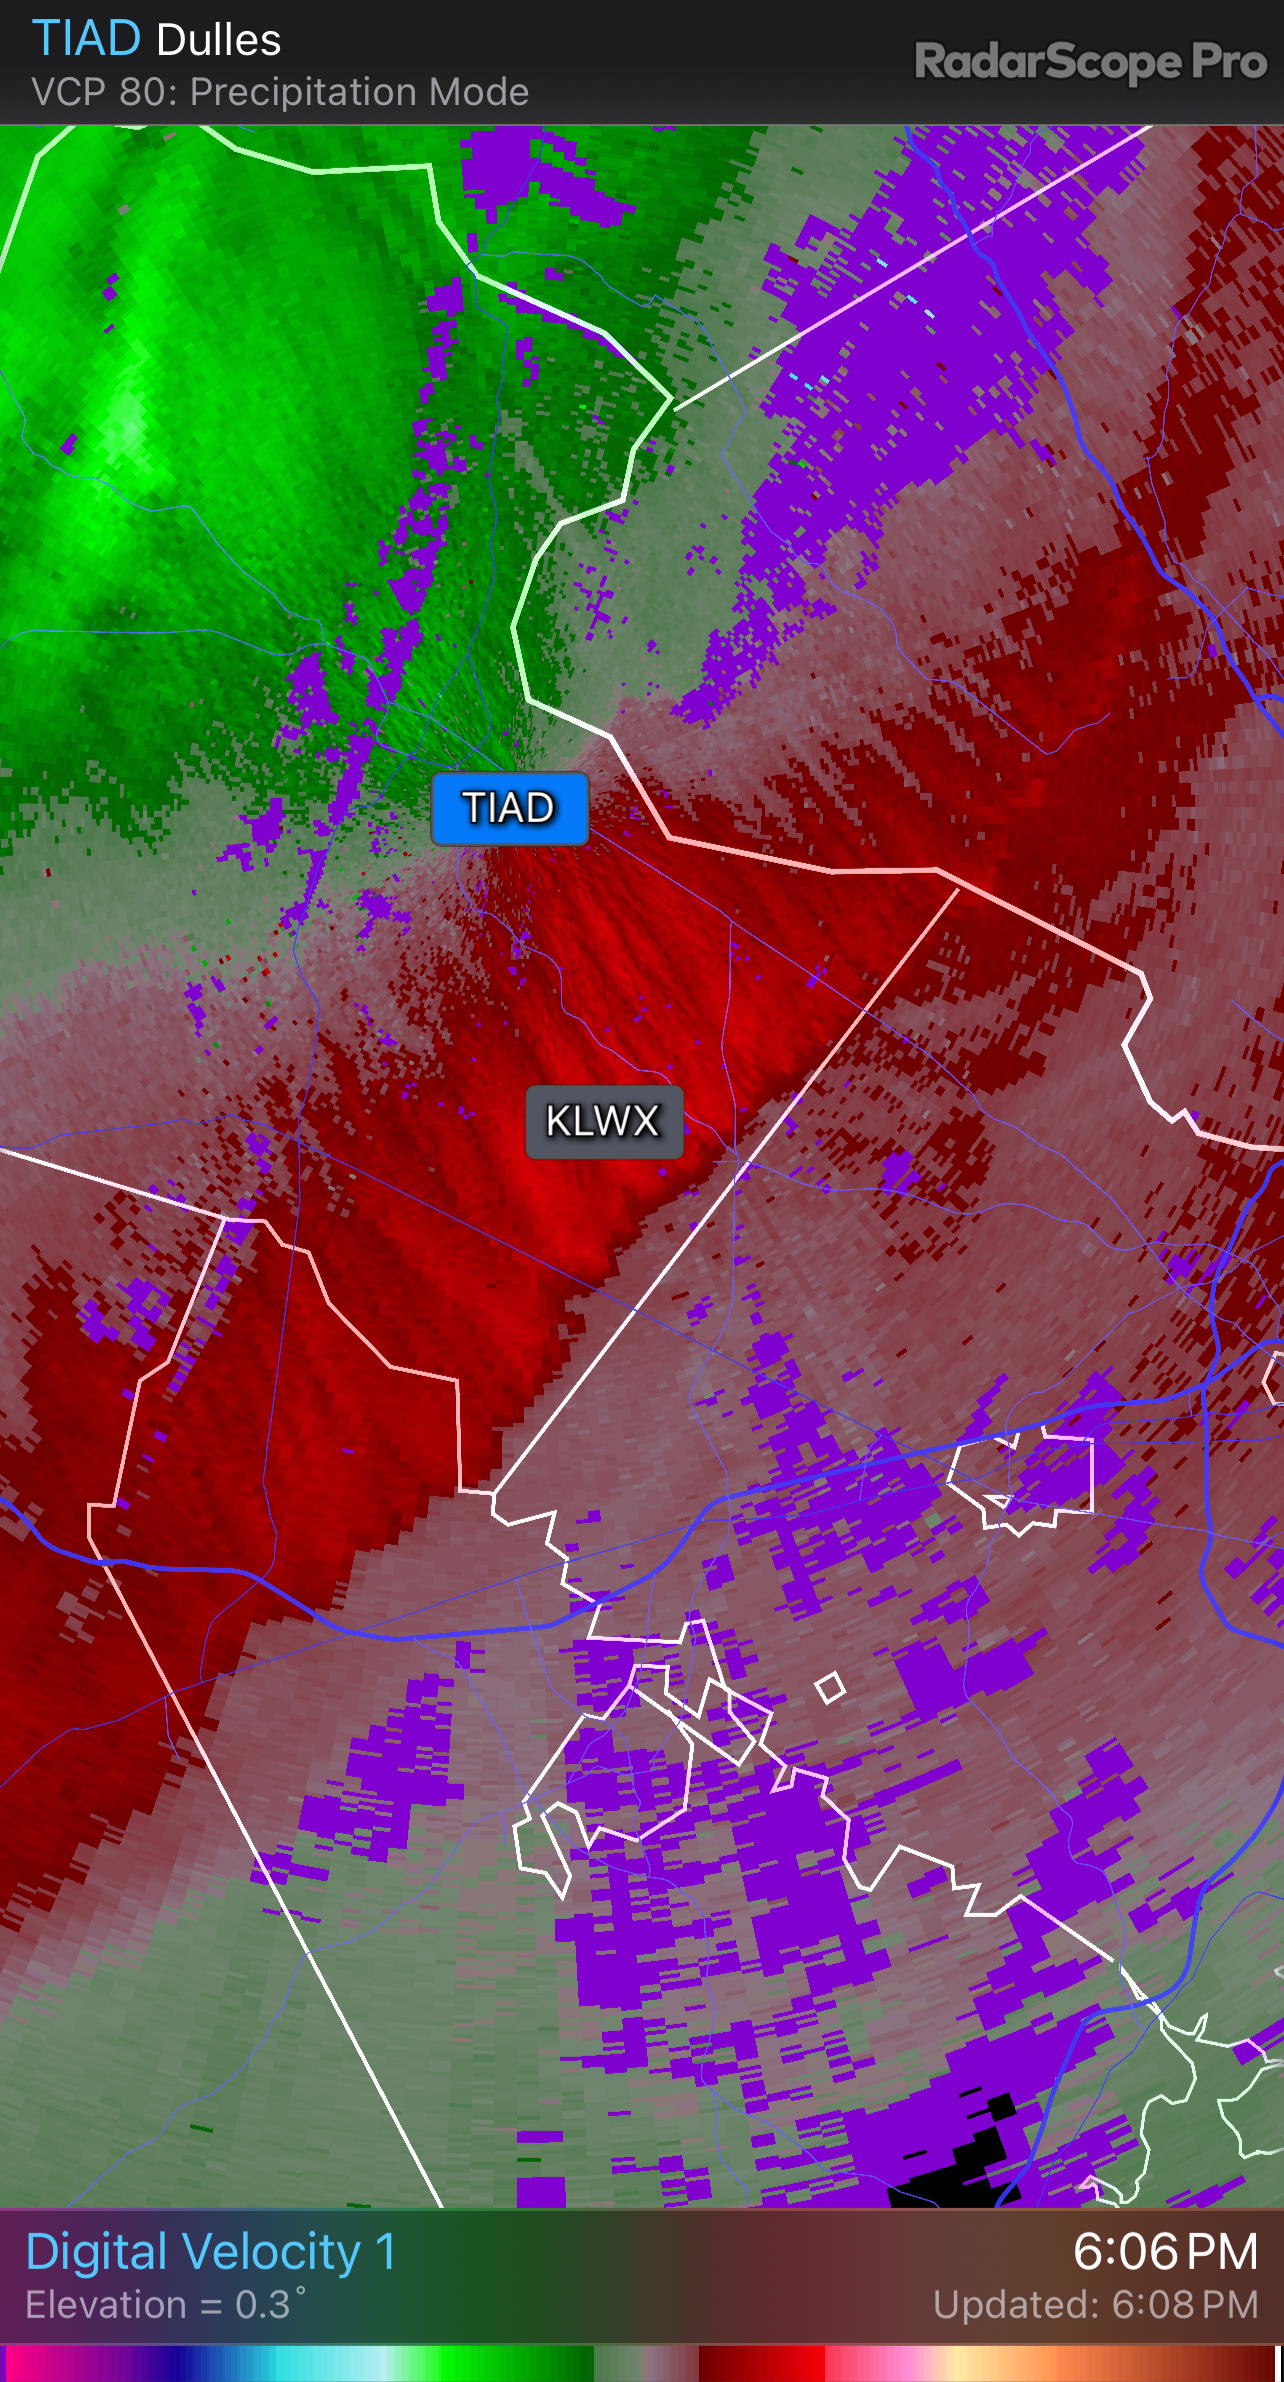
At Dulles

-
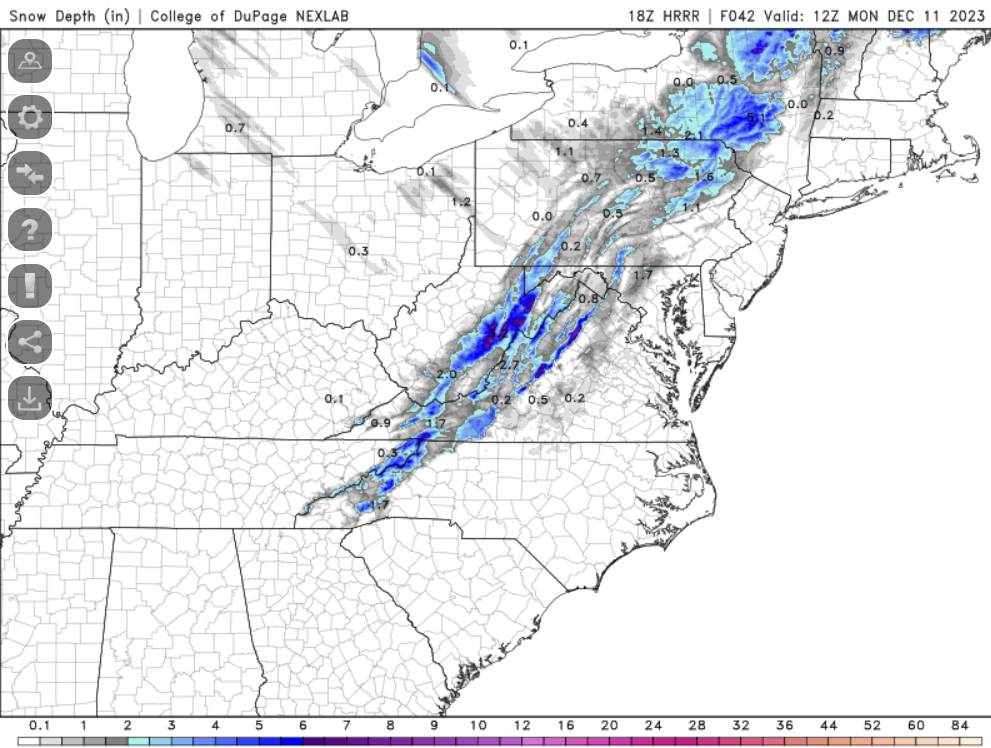
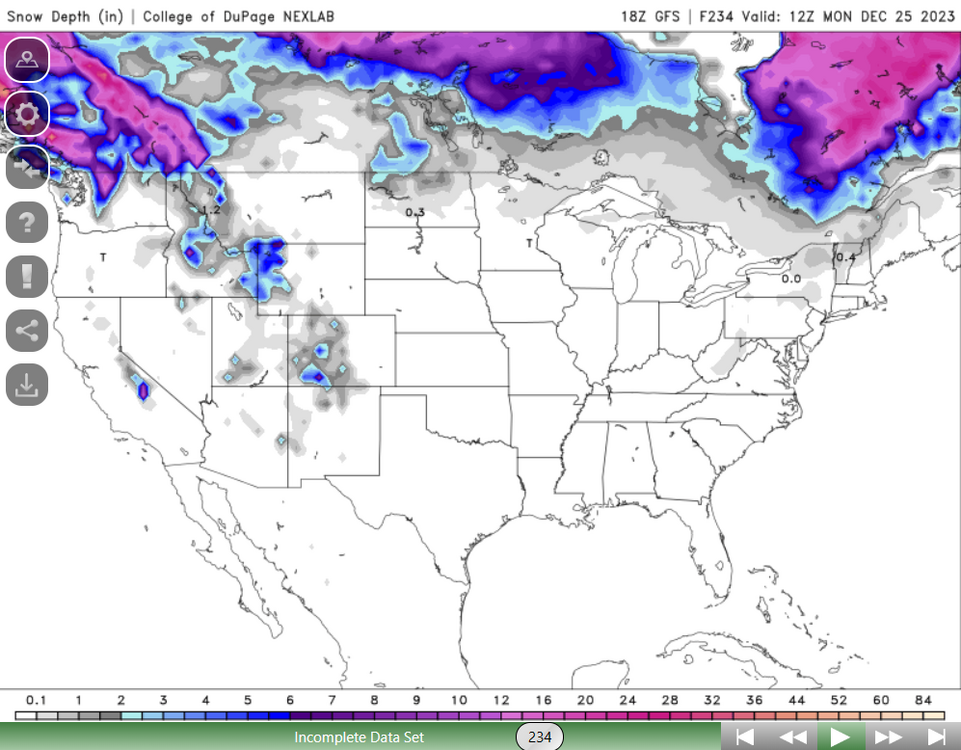
12z HRRR stays warm at the surface, so no snow depth accumulation for most of us.
-
The 06z NAM 3km drops 0.6" precip in my backyard after the switchover. I love that stupid weenie model.
-