

dallen7908
-
Posts
960 -
Joined
-
Last visited
Content Type
Profiles
Blogs
Forums
American Weather
Media Demo
Store
Gallery
Everything posted by dallen7908
-
January Storm Term Threat Discussions (Day 3 - Day 7)
dallen7908 replied to WxUSAF's topic in Mid Atlantic
The TPV (as represented by GFSv16) continues to accelerate south/southeast and begins (continues?) to influence our favorite anomaly. Based on the movement of the TPV one would think we are looking at different times but no all of the plots below are from 7 AM on the 28th.gif.bdfb9dd91de19e5fc82c040ee92ec652.gif)
-
January Storm Term Threat Discussions (Day 3 - Day 7)
dallen7908 replied to WxUSAF's topic in Mid Atlantic
EPS members snow/sleet totals (inches) for the last 14 (00 and 12 UT) runs (College Park) through 00 UT Feb 3 90th percentile: 9 15 12 15 12 16 18 12 13 10 10 11 9 10 80th percentile: 6 10 11 9 10 12 13 9 11 7 6 8 6 8 70th percentile: 6 6 9 8 7 11 11 8 9 6 3 6 5 6 60th percentile: 4 5 8 6 6 7 9 7 7 4 2 5 5 5 50th percentile: 3 4 6 5 4 6 7 6 6 2 1 4 4 4 40th percentile: 2 3 4 4 4 5 6 5 6 2 0.8 4 3 3 30th percentile: 2 1 4 3 3 4 5 4 5 0.9 0.6 3 3 2 20th percentile: 0.7 0.6 3 2 2 3 3 4 3 0.5 0.4 2 2 1 10th percentile: 0.5 0.3 1 1 1 1 3 3 1 0 0.1 1 2 1 -
January Storm Term Threat Discussions (Day 3 - Day 7)
dallen7908 replied to WxUSAF's topic in Mid Atlantic
More fun with letter grades ECM A UKM B GFSv16 C+ CMC C+ JMA C+ GFS C (barely) FNO D- -
January Storm Term Threat Discussions (Day 3 - Day 7)
dallen7908 replied to WxUSAF's topic in Mid Atlantic
GFVv16 (parallel) Looking better with time.
-
January Storm Term Threat Discussions (Day 3 - Day 7)
dallen7908 replied to WxUSAF's topic in Mid Atlantic
EPS members snow/sleet totals (inches) for the last 13 (00 and 12 UT) runs (College Park) through 00 UT Feb 3 90th percentile: 9 15 12 15 12 16 18 12 13 10 10 11 9 80th percentile: 6 10 11 9 10 12 13 9 11 7 6 8 6 70th percentile: 6 6 9 8 7 11 11 8 9 6 3 6 5 60th percentile: 4 5 8 6 6 7 9 7 7 4 2 5 5 50th percentile: 3 4 6 5 4 6 7 6 6 2 1 4 4 40th percentile: 2 3 4 4 4 5 6 5 6 2 0.8 4 3 30th percentile: 2 1 4 3 3 4 5 4 5 0.9 0.6 3 3 20th percentile: 0.7 0.6 3 2 2 3 3 4 3 0.5 0.4 2 2 10th percentile: 0.5 0.3 1 1 1 1 3 3 1 0 0.1 1 2 -
January Storm Term Threat Discussions (Day 3 - Day 7)
dallen7908 replied to WxUSAF's topic in Mid Atlantic
What's nice about the Para is that it has an expansive region of snow compared to its preceding 2 runs. Pushes solid snow amounts east to the coast and north -
January Storm Term Threat Discussions (Day 3 - Day 7)
dallen7908 replied to WxUSAF's topic in Mid Atlantic
EPS members snow/sleet totals (inches) for the last 12 runs (College Park) through 00 UT Feb 3 90th percentile: 9 15 12 15 12 16 18 12 13 10 10 11 80th percentile: 6 10 11 9 10 12 13 9 11 7 6 8 70th percentile: 6 6 9 8 7 11 11 8 9 6 3 6 60th percentile: 4 5 8 6 6 7 9 7 7 4 2 5 50th percentile: 3 4 6 5 4 6 7 6 6 2 1 4 40th percentile: 2 3 4 4 4 5 6 5 6 2 0.8 4 30th percentile: 2 1 4 3 3 4 5 4 5 0.9 0.6 3 20th percentile: 0.7 0.6 3 2 2 3 3 4 3 0.5 0.4 2 10th percentile: 0.5 0.3 1 1 1 1 3 3 1 0 0.1 1 -
January Storm Term Threat Discussions (Day 3 - Day 7)
dallen7908 replied to WxUSAF's topic in Mid Atlantic
Poor timing with all of the GFS excitement but here are the EPS numbers for the last 11 runs EPS members snow/sleet totals (inches) for the last 11 runs (College Park) through 00 UT Feb 3 90th percentile: 9 15 12 15 12 16 18 12 13 10 10 80th percentile: 6 10 11 9 10 12 13 9 11 7 6 70th percentile: 6 6 9 8 7 11 11 8 9 6 3 60th percentile: 4 5 8 6 6 7 9 7 7 4 2 50th percentile: 3 4 6 5 4 6 7 6 6 2 1 40th percentile: 2 3 4 4 4 5 6 5 6 2 0.8 30th percentile: 2 1 4 3 3 4 5 4 5 0.9 0.6 20th percentile: 0.7 0.6 3 2 2 3 3 4 3 0.5 0.4 10th percentile: 0.5 0.3 1 1 1 1 3 3 1 0 0.1 -
I feel your pain. To the best of my recollection, I haven't experienced a 2" storm in my backyard since January 2016. I was on vacation during the March (spring training) and January (Tucson trip following AMS meeting) events we had during the last several years.
-
Feb Long Range Discussion (Day 3 and beyond) - MERGED
dallen7908 replied to WinterWxLuvr's topic in Mid Atlantic
Retreat! EPS members snow/sleet totals (inches) for the last 10 runs (College Park) through 00 UT Feb 3 90th percentile: 9 15 12 15 12 16 18 12 13 10 80th percentile: 6 10 11 9 10 12 13 9 11 7 70th percentile: 6 6 9 8 7 11 11 8 9 6 60th percentile: 4 5 8 6 6 7 9 7 7 4 50th percentile: 3 4 6 5 4 6 7 6 6 2 40th percentile: 2 3 4 4 4 5 6 5 6 2 30th percentile: 2 1 4 3 3 4 5 4 5 0.9 20th percentile: 0.7 0.6 3 2 2 3 3 4 3 0.5 10th percentile: 0.5 0.3 1 1 1 1 3 3 1 0 (With next week's east coast storm ~ a week away, this will be the last post of this type in the long-range forum) -
Feb Long Range Discussion (Day 3 and beyond) - MERGED
dallen7908 replied to WinterWxLuvr's topic in Mid Atlantic
EPS members snow/sleet totals (inches) for the last 9 runs (College Park) through 00 UT Feb 3 90th percentile: 9 15 12 15 12 16 18 12 13 80th percentile: 6 10 11 9 10 12 13 9 11 70th percentile: 6 6 9 8 7 11 11 8 9 60th percentile: 4 5 8 6 6 7 9 7 7 50th percentile: 3 4 6 5 4 6 7 6 6 40th percentile: 2 3 4 4 4 5 6 5 6 30th percentile: 2 1 4 3 3 4 5 4 5 20th percentile: 0.7 0.6 3 2 2 3 3 4 3 10th percentile: 0.5 0.3 1 1 1 1 3 3 1 -
Feb Long Range Discussion (Day 3 and beyond) - MERGED
dallen7908 replied to WinterWxLuvr's topic in Mid Atlantic
EPS members snow/sleet totals (inches) for the last 8 runs (College Park) through 00 UT Feb 3 90th percentile: 9 15 12 15 12 16 18 12 80th percentile: 6 10 11 9 10 12 13 9 70th percentile: 6 6 9 8 7 11 11 8 60th percentile: 4 5 8 6 6 7 9 7 50th percentile: 3 4 6 5 4 6 7 6 40th percentile: 2 3 4 4 4 5 6 5 30th percentile: 2 1 4 3 3 4 5 4 20th percentile: 0.7 0.6 3 2 2 3 3 4 10th percentile: 0.5 0.3 1 1 1 1 3 3 -
Feb Long Range Discussion (Day 3 and beyond) - MERGED
dallen7908 replied to WinterWxLuvr's topic in Mid Atlantic
EPS members snow/sleet totals (inches) for the last 7 runs (College Park) through 00 UT Feb 3 90th percentile: 9 15 12 15 12 16 18 80th percentile: 6 10 11 9 10 12 13 70th percentile: 6 6 9 8 7 11 11 60th percentile: 4 5 8 6 6 7 9 50th percentile: 3 4 6 5 4 6 7 40th percentile: 2 3 4 4 4 5 6 30th percentile: 2 1 4 3 3 4 5 20th percentile: 0.7 0.6 3 2 2 3 3 10th percentile: 0.5 0.3 1 1 1 1 3 -
Feb Long Range Discussion (Day 3 and beyond) - MERGED
dallen7908 replied to WinterWxLuvr's topic in Mid Atlantic
North, south, east or west most of us are in the game!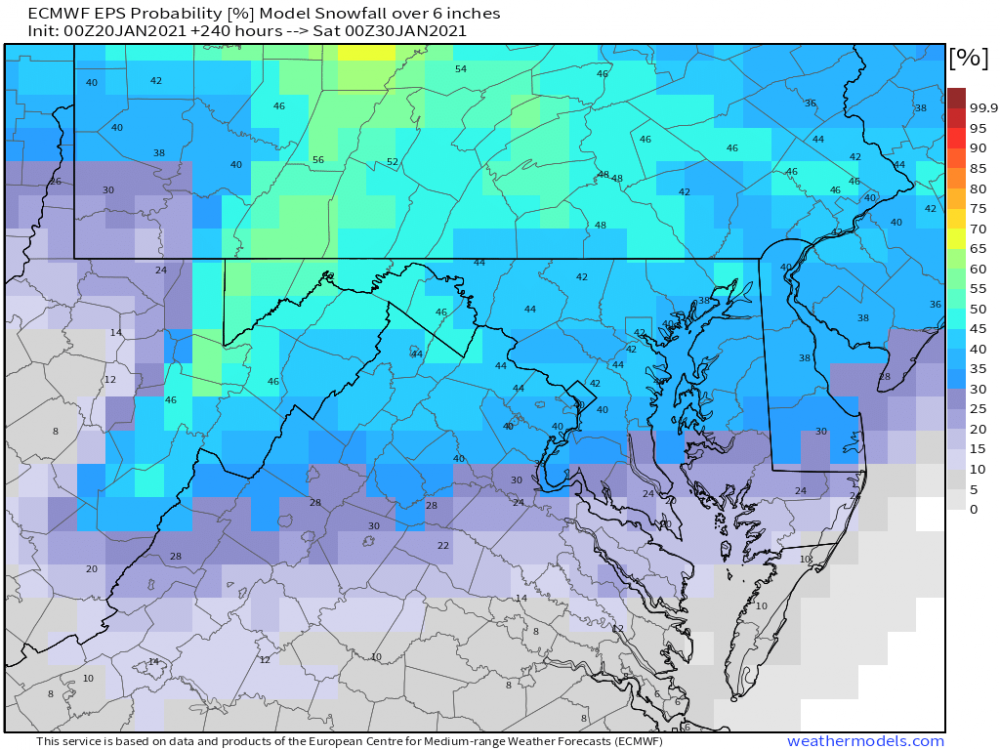
-
Feb Long Range Discussion (Day 3 and beyond) - MERGED
dallen7908 replied to WinterWxLuvr's topic in Mid Atlantic
EPS members snow/sleet totals (inches) for the last 6 runs (College Park) through Feb 2 90th percentile: 9 15 12 15 12 16 80th percentile: 6 10 11 9 10 12 70th percentile: 6 6 9 8 7 11 60th percentile: 4 5 8 6 6 7 50th percentile: 3 4 6 5 4 6 40th percentile: 2 3 4 4 4 5 30th percentile: 2 1 4 3 3 4 20th percentile: 0.7 0.6 3 2 2 3 10th percentile: 0.5 0.3 1 1 1 1 -
Feb Long Range Discussion (Day 3 and beyond) - MERGED
dallen7908 replied to WinterWxLuvr's topic in Mid Atlantic
EPS members snow/sleet totals (inches) for the last 5 runs (College Park) through Feb 2 90th percentile: 9 15 12 15 12 80th percentile: 6 10 11 9 10 70th percentile: 6 6 9 8 7 60th percentile: 4 5 8 6 6 50th percentile: 3 4 6 5 4 40th percentile: 2 3 4 4 4 30th percentile: 2 1 4 3 3 20th percentile: 0.7 0.6 3 2 2 10th percentile: 0.5 0.3 1 1 1 -
Feb Long Range Discussion (Day 3 and beyond) - MERGED
dallen7908 replied to WinterWxLuvr's topic in Mid Atlantic
When we shift (12z today or tomorrow makes sense), I'd suggest moving over all discussion of the very active January 25 - January 29 time period. -
Feb Long Range Discussion (Day 3 and beyond) - MERGED
dallen7908 replied to WinterWxLuvr's topic in Mid Atlantic
Still in the game although the start of any fun is delayed until next Tuesday or so. EPS members 360 hour snow/sleet totals (inches) for the last 4 runs (College Park) 90th percentile: 9 15 12 15 80th percentile: 6 10 11 9 70th percentile: 6 6 9 8 60th percentile: 4 5 8 6 50th percentile: 3 4 6 5 40th percentile: 2 3 4 4 30th percentile: 2 1 4 3 20th percentile: 0.7 0.6 3 2 10th percentile: 0.5 0.3 11 -
Feb Long Range Discussion (Day 3 and beyond) - MERGED
dallen7908 replied to WinterWxLuvr's topic in Mid Atlantic
NAEFS time series for the next few weeks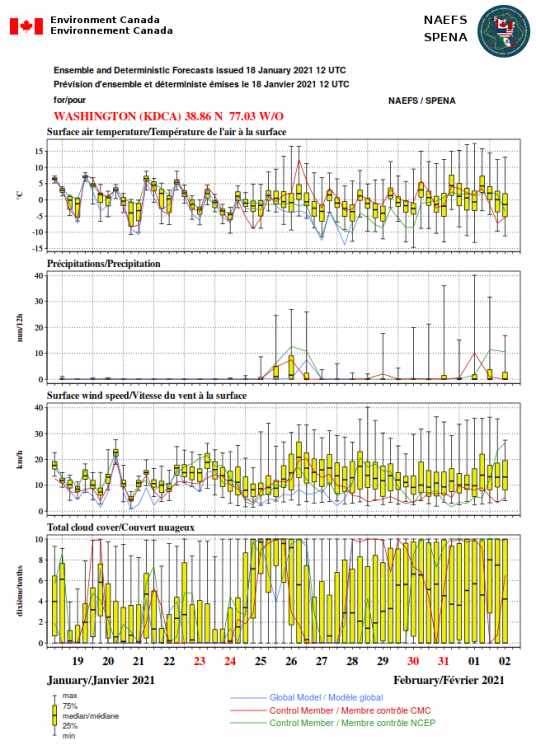
-
Feb Long Range Discussion (Day 3 and beyond) - MERGED
dallen7908 replied to WinterWxLuvr's topic in Mid Atlantic
EPS members 360 hour snow/sleet totals (inches) for the last 3 runs (College Park) 90th percentile: 9 15 12 80th percentile: 6 10 11 70th percentile: 6 6 9 60th percentile: 4 5 8 50th percentile: 3 4 6 40th percentile: 2 3 4 30th percentile: 2 1 4 20th percentile: 0.7 0.6 3 10th percentile: 0.5 0.3 1 -
Feb Long Range Discussion (Day 3 and beyond) - MERGED
dallen7908 replied to WinterWxLuvr's topic in Mid Atlantic
I've bottomed out at 23 degrees - at least that's the lowest I've seen. don't have a max/min. The 00 EPS does show below normal high temperatures for a 9 day period beginning next Saturday. -
Feb Long Range Discussion (Day 3 and beyond) - MERGED
dallen7908 replied to WinterWxLuvr's topic in Mid Atlantic
The 00UT EPS still have numerous good hits in the 8-11 day range. The downside is that most of the ensemble members delay the start of any event until next Tuesday - about 24 hours later than the ensembles showed 2 days ago. For College Park, 1/3 of the members are snowless while 1/5 predict a MECS or BECS resulting in an impressive snow mean of 6-7" and a median of 4" Hopefully, we won't end up getting the mode. -
Feb Long Range Discussion (Day 3 and beyond) - MERGED
dallen7908 replied to WinterWxLuvr's topic in Mid Atlantic
12 UT GFS: Primary reaches Manitowoc at hour 192. Wintry precipitation yet to reach MBY. Cold air moving make that running away. Hour 198, rain. Hopefully, we pick up an inch or two between 193 and 194 I toss. It's still ensemble range. -
Feb Long Range Discussion (Day 3 and beyond) - MERGED
dallen7908 replied to WinterWxLuvr's topic in Mid Atlantic
00 UT EPS suggests that our best chance of snow is in a 2-day window beginning a week from Monday evening and ending a week from Wednesday evening. The EPS mean for College Park is 0.7" or greater for 4 consecutive 12-hour periods; the 2nd best its been this season. -
Feb Long Range Discussion (Day 3 and beyond) - MERGED
dallen7908 replied to WinterWxLuvr's topic in Mid Atlantic
I don't mean to be a pain here but could you use "discrete". Discreet brings back bad memories. My sister lost a spelling bee because she spelled indiscreet as follows: I N D I S C R E T E.


