
Holston_River_Rambler
-
Posts
6,207 -
Joined
-
Last visited
Content Type
Profiles
Blogs
Forums
American Weather
Media Demo
Store
Gallery
Everything posted by Holston_River_Rambler
-

TN valley heavy rain/flooding week of whenever
Holston_River_Rambler replied to janetjanet998's topic in Tennessee Valley
EPS means of 7.5- 8 inches back in N Alabama: -
TN valley heavy rain/flooding week of whenever
Holston_River_Rambler replied to janetjanet998's topic in Tennessee Valley
Oliver Springs area: -
TN valley heavy rain/flooding week of whenever
Holston_River_Rambler replied to janetjanet998's topic in Tennessee Valley
wow. was wondering how things were down your way, looks like y'all still getting hammered -
TN valley heavy rain/flooding week of whenever
Holston_River_Rambler replied to janetjanet998's topic in Tennessee Valley
When I was up there a guy told me to look at it, but recommended I not do it today, lol. I didn't even know there was a tunnel until today. Here is the picnic area: Random tree floating down: -
TN valley heavy rain/flooding week of whenever
Holston_River_Rambler replied to janetjanet998's topic in Tennessee Valley
Oliver Springs area between OS and Oak Ridge: -
TN valley heavy rain/flooding week of whenever
Holston_River_Rambler replied to janetjanet998's topic in Tennessee Valley
Obed Flooding at the confluence of the little Emory: Judge Branch coming off of Frozen Head: Highway 62 at the Emory River: -
TN valley heavy rain/flooding week of whenever
Holston_River_Rambler replied to janetjanet998's topic in Tennessee Valley
Hearing reports that parts of Highway 27 in Roane/ Morgan county are under water now. -
TN valley heavy rain/flooding week of whenever
Holston_River_Rambler replied to janetjanet998's topic in Tennessee Valley
Downtown Sunbright from 8 hours ago. from Morgan County today facebook page: -
TN valley heavy rain/flooding week of whenever
Holston_River_Rambler replied to janetjanet998's topic in Tennessee Valley
Euro backed off on the rain totals overnight, but not by too much: -
TN valley heavy rain/flooding week of whenever
Holston_River_Rambler replied to janetjanet998's topic in Tennessee Valley
Top of the line rolling through now. Sounds like a tropical downpour. More vivid lightning https://giphy.com/gifs/XdD1lHWteTEi6MPD0B -
TN valley heavy rain/flooding week of whenever
Holston_River_Rambler replied to janetjanet998's topic in Tennessee Valley
Wow. In only 27 hours... looks like 6-7 in the southern, eastern great valley this is one heck of a system. -
TN valley heavy rain/flooding week of whenever
Holston_River_Rambler replied to janetjanet998's topic in Tennessee Valley
Apparently you have to have a special camera to catch lightning. I had my phone set up and got a super vivid flash and this was all it took: All you can see is a little bit of light through the trees, and you better be in a dark room, lol -
TN valley heavy rain/flooding week of whenever
Holston_River_Rambler replied to janetjanet998's topic in Tennessee Valley
Yeah, first edge of that mess is hitting me now. Heaviest rain of the day and lightning now. -
TN valley heavy rain/flooding week of whenever
Holston_River_Rambler replied to janetjanet998's topic in Tennessee Valley
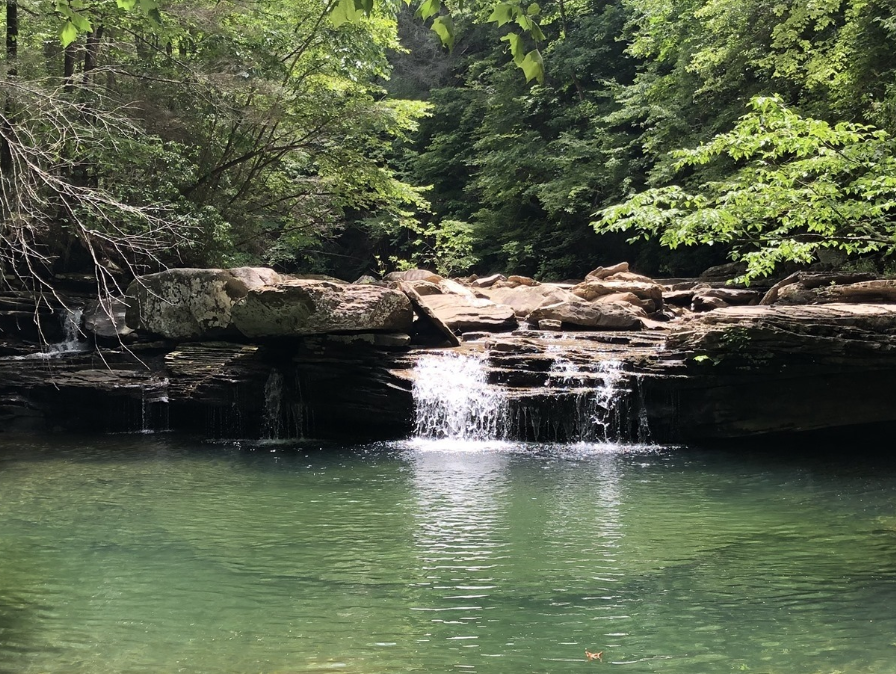
This looks pleasant: -
TN valley heavy rain/flooding week of whenever
Holston_River_Rambler replied to janetjanet998's topic in Tennessee Valley
18z GEFS has a nearly 13" MEAN lollipop in SW NC: -
TN valley heavy rain/flooding week of whenever
Holston_River_Rambler replied to janetjanet998's topic in Tennessee Valley
Hard to believe, but here we are. -
TN valley heavy rain/flooding week of whenever
Holston_River_Rambler replied to janetjanet998's topic in Tennessee Valley
Euro precip projections. Up close and personal: EPS city plots: -
TN valley heavy rain/flooding week of whenever
Holston_River_Rambler replied to janetjanet998's topic in Tennessee Valley
front yard, day 1: several creeks crossing the roads in my area of Morgan county (Mossy Grove) -
Historic Tennessee Valley Cold, Snow, and Ice Events
Holston_River_Rambler replied to Carvers Gap's topic in Tennessee Valley
Here's the 500 mb pattern for that Ice Storm in Jan 1951, from NCEP reanalysis: -
If anyone (like me) has a masochistic urge to go back and look at old Himawari 8 images for comparison, here ye go: https://seg-web.nict.go.jp/wsdb_osndisk/shareDirDownload/bDw2maKV?sI=D531106,D531107,TI,D531106m,D531107m,TIm,evm&sIt=data_im&lang=en
-
https://www.bbc.com/news/science-environment-51070870 Article about how the Euro uses ultraviolet beams from a satellite to gauge wind speeds in the atmosphere.
-
That part of the line that produced the tornado moved right over my neighborhood in Morgan County. I was gone, luckily nothing here except some large limbs down, but my wife was here and said it was pretty rough. TROWAL dog apparently tried to hide behind the toilet.
-
TN valley heavy rain/flooding week of whenever
Holston_River_Rambler replied to janetjanet998's topic in Tennessee Valley
About 2 inches so far now. EPS mean starting to show 7 inches in some spots over the next 15 days: Individual city charts: -
TN valley heavy rain/flooding week of whenever
Holston_River_Rambler replied to janetjanet998's topic in Tennessee Valley
I'm at 1.4" since midnight and the firehose really just started in the past half hour. Not promising to see a bunch of flash flood warnings in its wake: -
TN valley heavy rain/flooding week of whenever
Holston_River_Rambler replied to janetjanet998's topic in Tennessee Valley
Firehose has geared up for the evening. The only question is where will it ultimately aim?


