The 4 Seasons
-
Posts
7,985 -
Joined
-
Last visited
Content Type
Profiles
Blogs
Forums
American Weather
Media Demo
Store
Gallery
Everything posted by The 4 Seasons
-

-
gotcha, thats where i got it from, thank you verifying
-
oh right i remember him now
-
Who's in Carver
-
Where is here again
-
found it, 82" on Mar 1st, 5N Bourne.
-
If anyone here has a total for Plymouth county that would help, i got you in Mattapoisett MPM. I know theres a large area over 72" just need some numbers if possible
-
-
Someone said 64.9 in Bristol and i wrote it down, now i dont know if it was Bristol, RI or CT, and i cant find it. If you see this let me know.
-
yeah cocorahs like irishrob said, it leaves out a lot reports that are missing days as well. It also only lets you do 90 days max so you can't include november and when we get into late march and want to include that, you'll be missing a lot of december
-
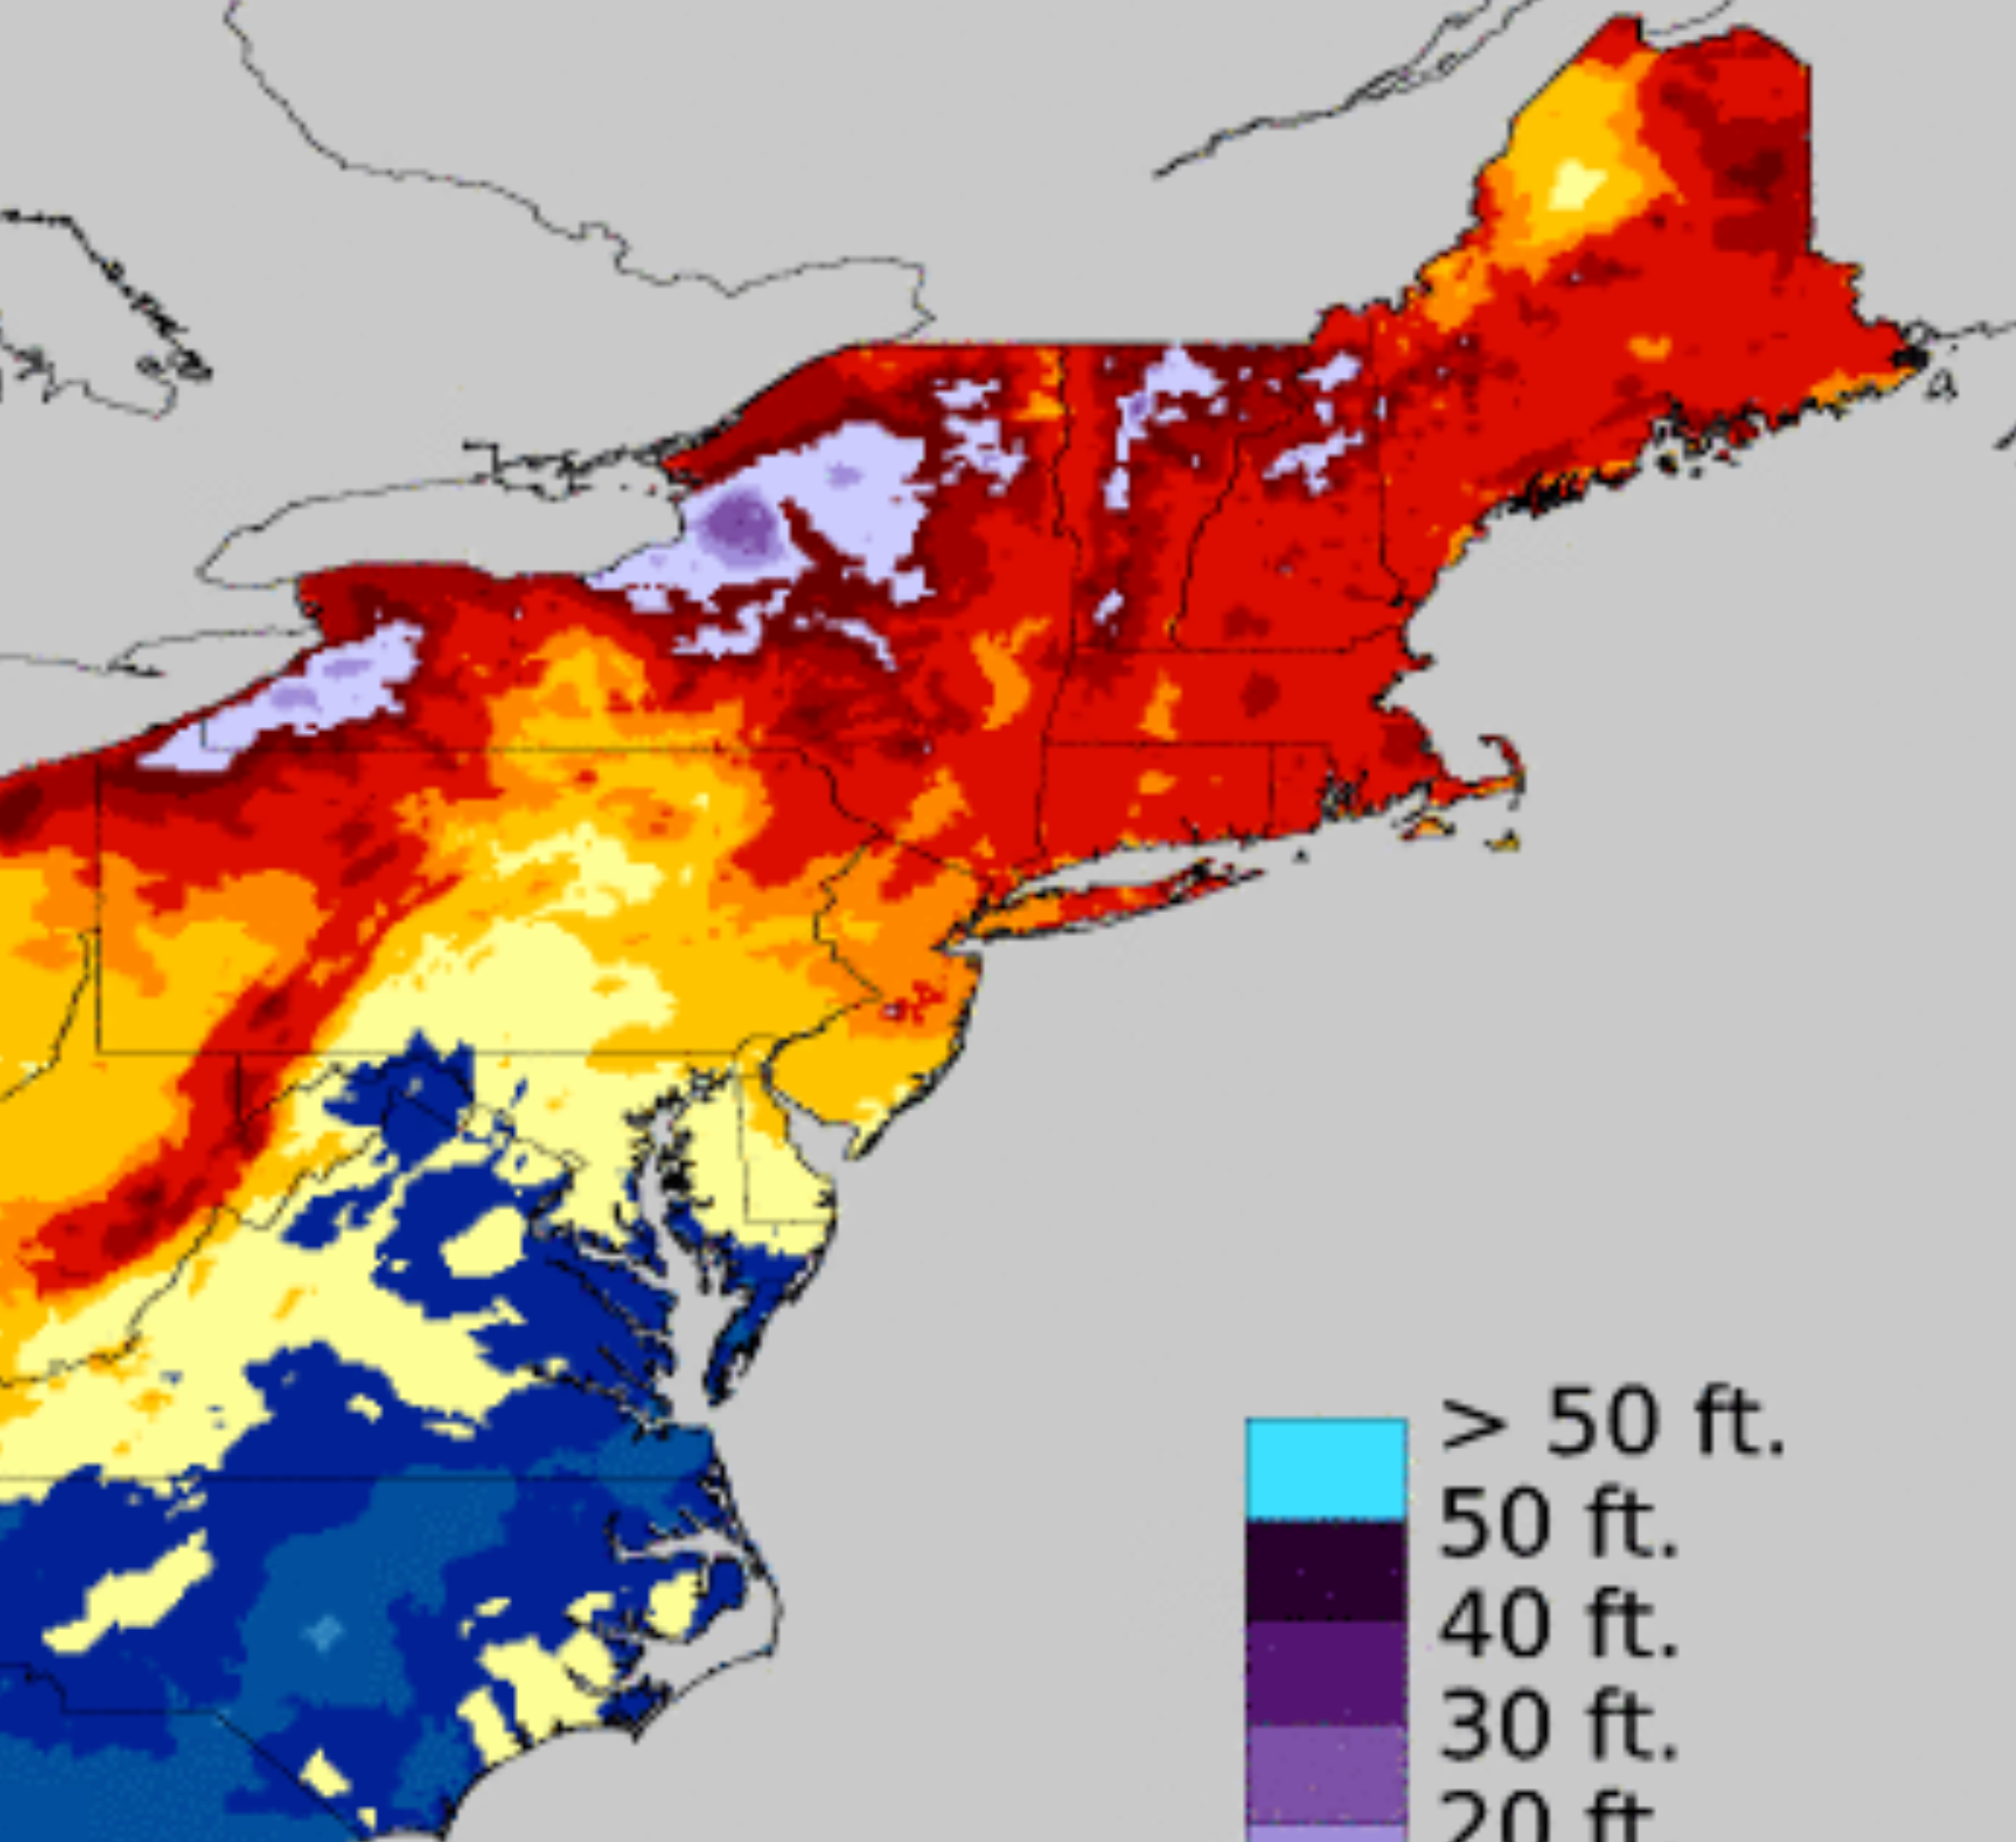
i have to leave all the cocorahs and coop stuff out of Plymouth county because its all below 60" and missing lots of days and the map the NWS has 72"+ for that whole area basically which seems right but i just cant include any numbers, sucks. @ORH_wxman would you say you have over or under 60" bc the Holliston cocorahs is 48.8 and that seems low and the other cocorahs is way too low at 27.8. Im going to lean over 60". The red on this map is 48-72" but i have that split up.

-
Third and hopefully final update to the Blizzard of 2026. I made a bunch of small changes and removed/added some numbers. Biggest change was to update LGA from 22.5 to 23.4. Everything's updated on site. Radar/other stuff in its own page coming today or tomorrow whenever NCEP updates.
-
Third and hopefully final update to the Blizzard of 2026. I made a bunch of small changes and removed/added some numbers. Biggest change was to update LGA from 22.5 to 23.4. Everything's updated on site. Radar/other stuff in its own page coming today or tomorrow whenever NCEP updates.
-
if you want to, id need it in like the next few hours. but if its missing a bunch of small stuff then dont bother, i think theres cocorahs in weymouth i can use. or at least surrounding areas.
-
who the hell would want to mod-admin for that? sounds like a nightmare waiting to happen
-
There used to be a whole forum dedicated to it called American Politics but i think its completely gone, it started around covid times 2020ish. I think. I was on there for a minute but im pretty sure its wiped.
-
The caterpillar has turned
-
Unless you get a late April 2020 or 2021 freak 6"+ event. I'm willing to bet you get 1 or 2 more accumulating events but deep winter is certainly over.
-
so you didnt get anything yesterday??
-
melting snow on the sensors...
-
got it, i thought about that for a sec but nothing indicated sarcasm, over txt it can be hard to tell sometimes.
-
and why is getting model data later a good thing?
-
Didn't realize LGA changed their number from 22.5 to 23.4. I'll have to fix that in the map
-
you have a season to date total 65.25 on the sig is right? @Damage In Tolland as well
-
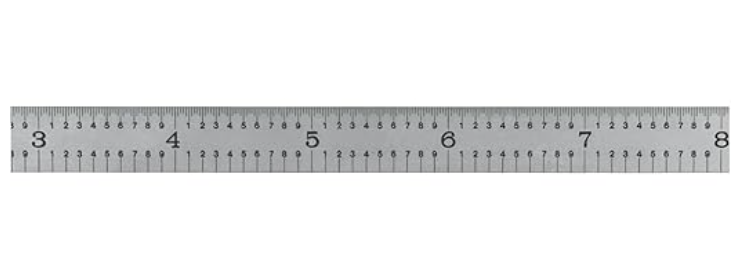
I got this steel ruler thats divided into 10ths which is great for measuring snow especially in smaller events so you dont have to guestimate or round. It's on amazon for about 20$ real weenie stuff