The 4 Seasons
-
Posts
7,985 -
Joined
-
Last visited
Content Type
Profiles
Blogs
Forums
American Weather
Media Demo
Store
Gallery
Everything posted by The 4 Seasons
-
How they did it in Feb 2026 at PVD i do not know but they all continue that standard somehow even in the most windy blizzards with lots of drifting and blowing snow. This was pretty extensive published by the state climate extremes committee (SCEC) on the record https://www.ncei.noaa.gov/monitoring-content/extremes/scec/reports/20260331-Rhode-Island-24-Hour-Snowfall.pdf
-
Big update coming soon is adding ERA5 analysis GIF loops for SFC/P-type/Thickness for all storms in the winter storm archive. This will be a major addition to the site and will take several months to complete but some will be up shortly. Most likely these will be dark mode with a northeast and US view.

-
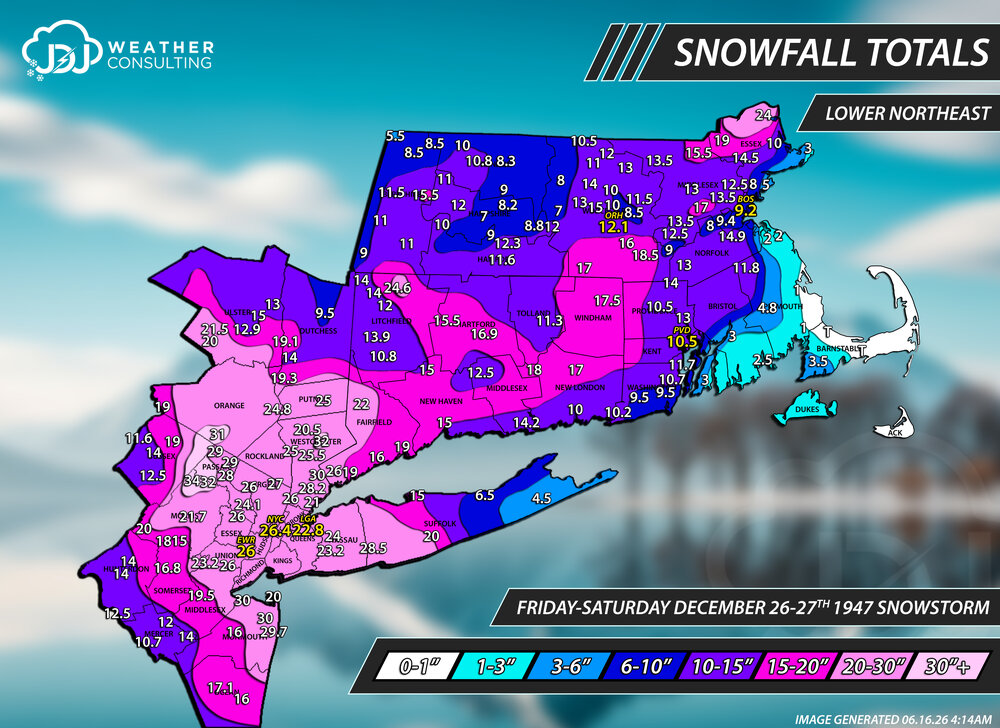
I recently did maps and updated the site for all these storms. March 1960, two Feb 1969 storms, Dec 1992, Apr 1983 and others. Just finished Boxing Day Dec 1947 snowstorm last night. https://www.jdjweatherconsulting.com/historic-storms
-
Closest screw job i can think of like that would be Feb 2021 or the 3 big storms of the 00-01 season, pretty brutal there.
-
he does. he has the book "Blizzard!" anyway, multiple more new snowstorms from the 1960s, 70s, 80s, and 90s have been added recently. Latest one was Mar 3-5, 1960, next im working on Feb 9-10th, 1969. i am working on more and will have a full update soon...for now every storm in the historic snowstorms archive has been updated with new maps. kinda sounds like dendie, though i dont think he actually really cares but just poking the bear. best of the best round here.
-
i know right, seasonal snowfall here in one storm. 44.7" in New Haven, 50 in Middletown. And considering the date im willing to bet most of these are probably snow depth or 24hr totals combined.
-
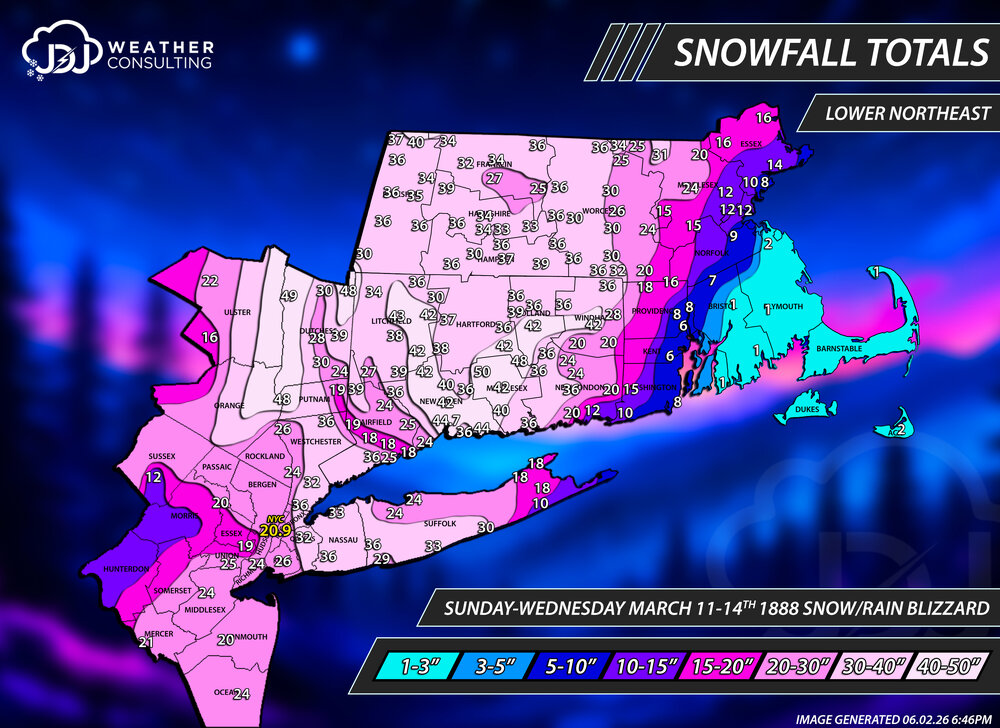
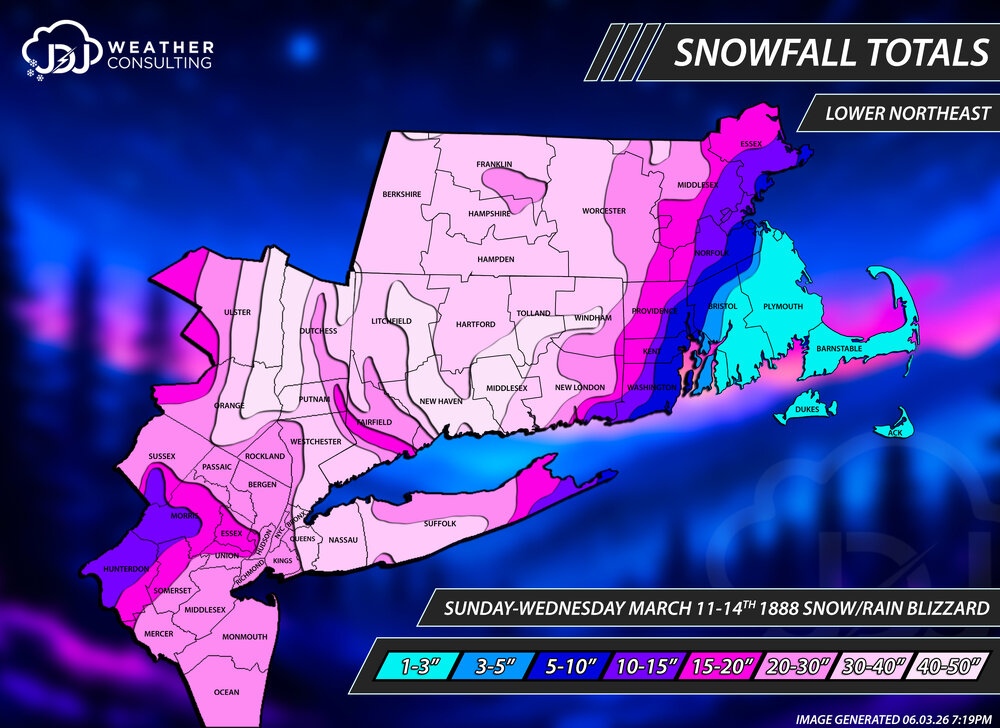
With the help of @Suchit0623 i have remapped the Blizzard of 1888 with 168 new snowfall reports from NWS COOP, climate sites and Judd Caplovich's book "Blizzard! The Great Storm of 1888." The general idea of the snowfall distribution is about the same but with significantly more reports i was able to really narrow down banding especially in CT along with the sharp cut off in E MA. The subsidence from the intense bands in central CT and LHV showed up nicely in a relative screw zone from SW Fairfield to Putnam/Dutchess where amounts dropped off from 40-50" to <20" in a narrow area. Reports were very thin in S NY and NJ unfortunately. Southern New England, Tri-State and CT maps are up as well. https://www.jdjweatherconsulting.com/mar-11-14-1888
-
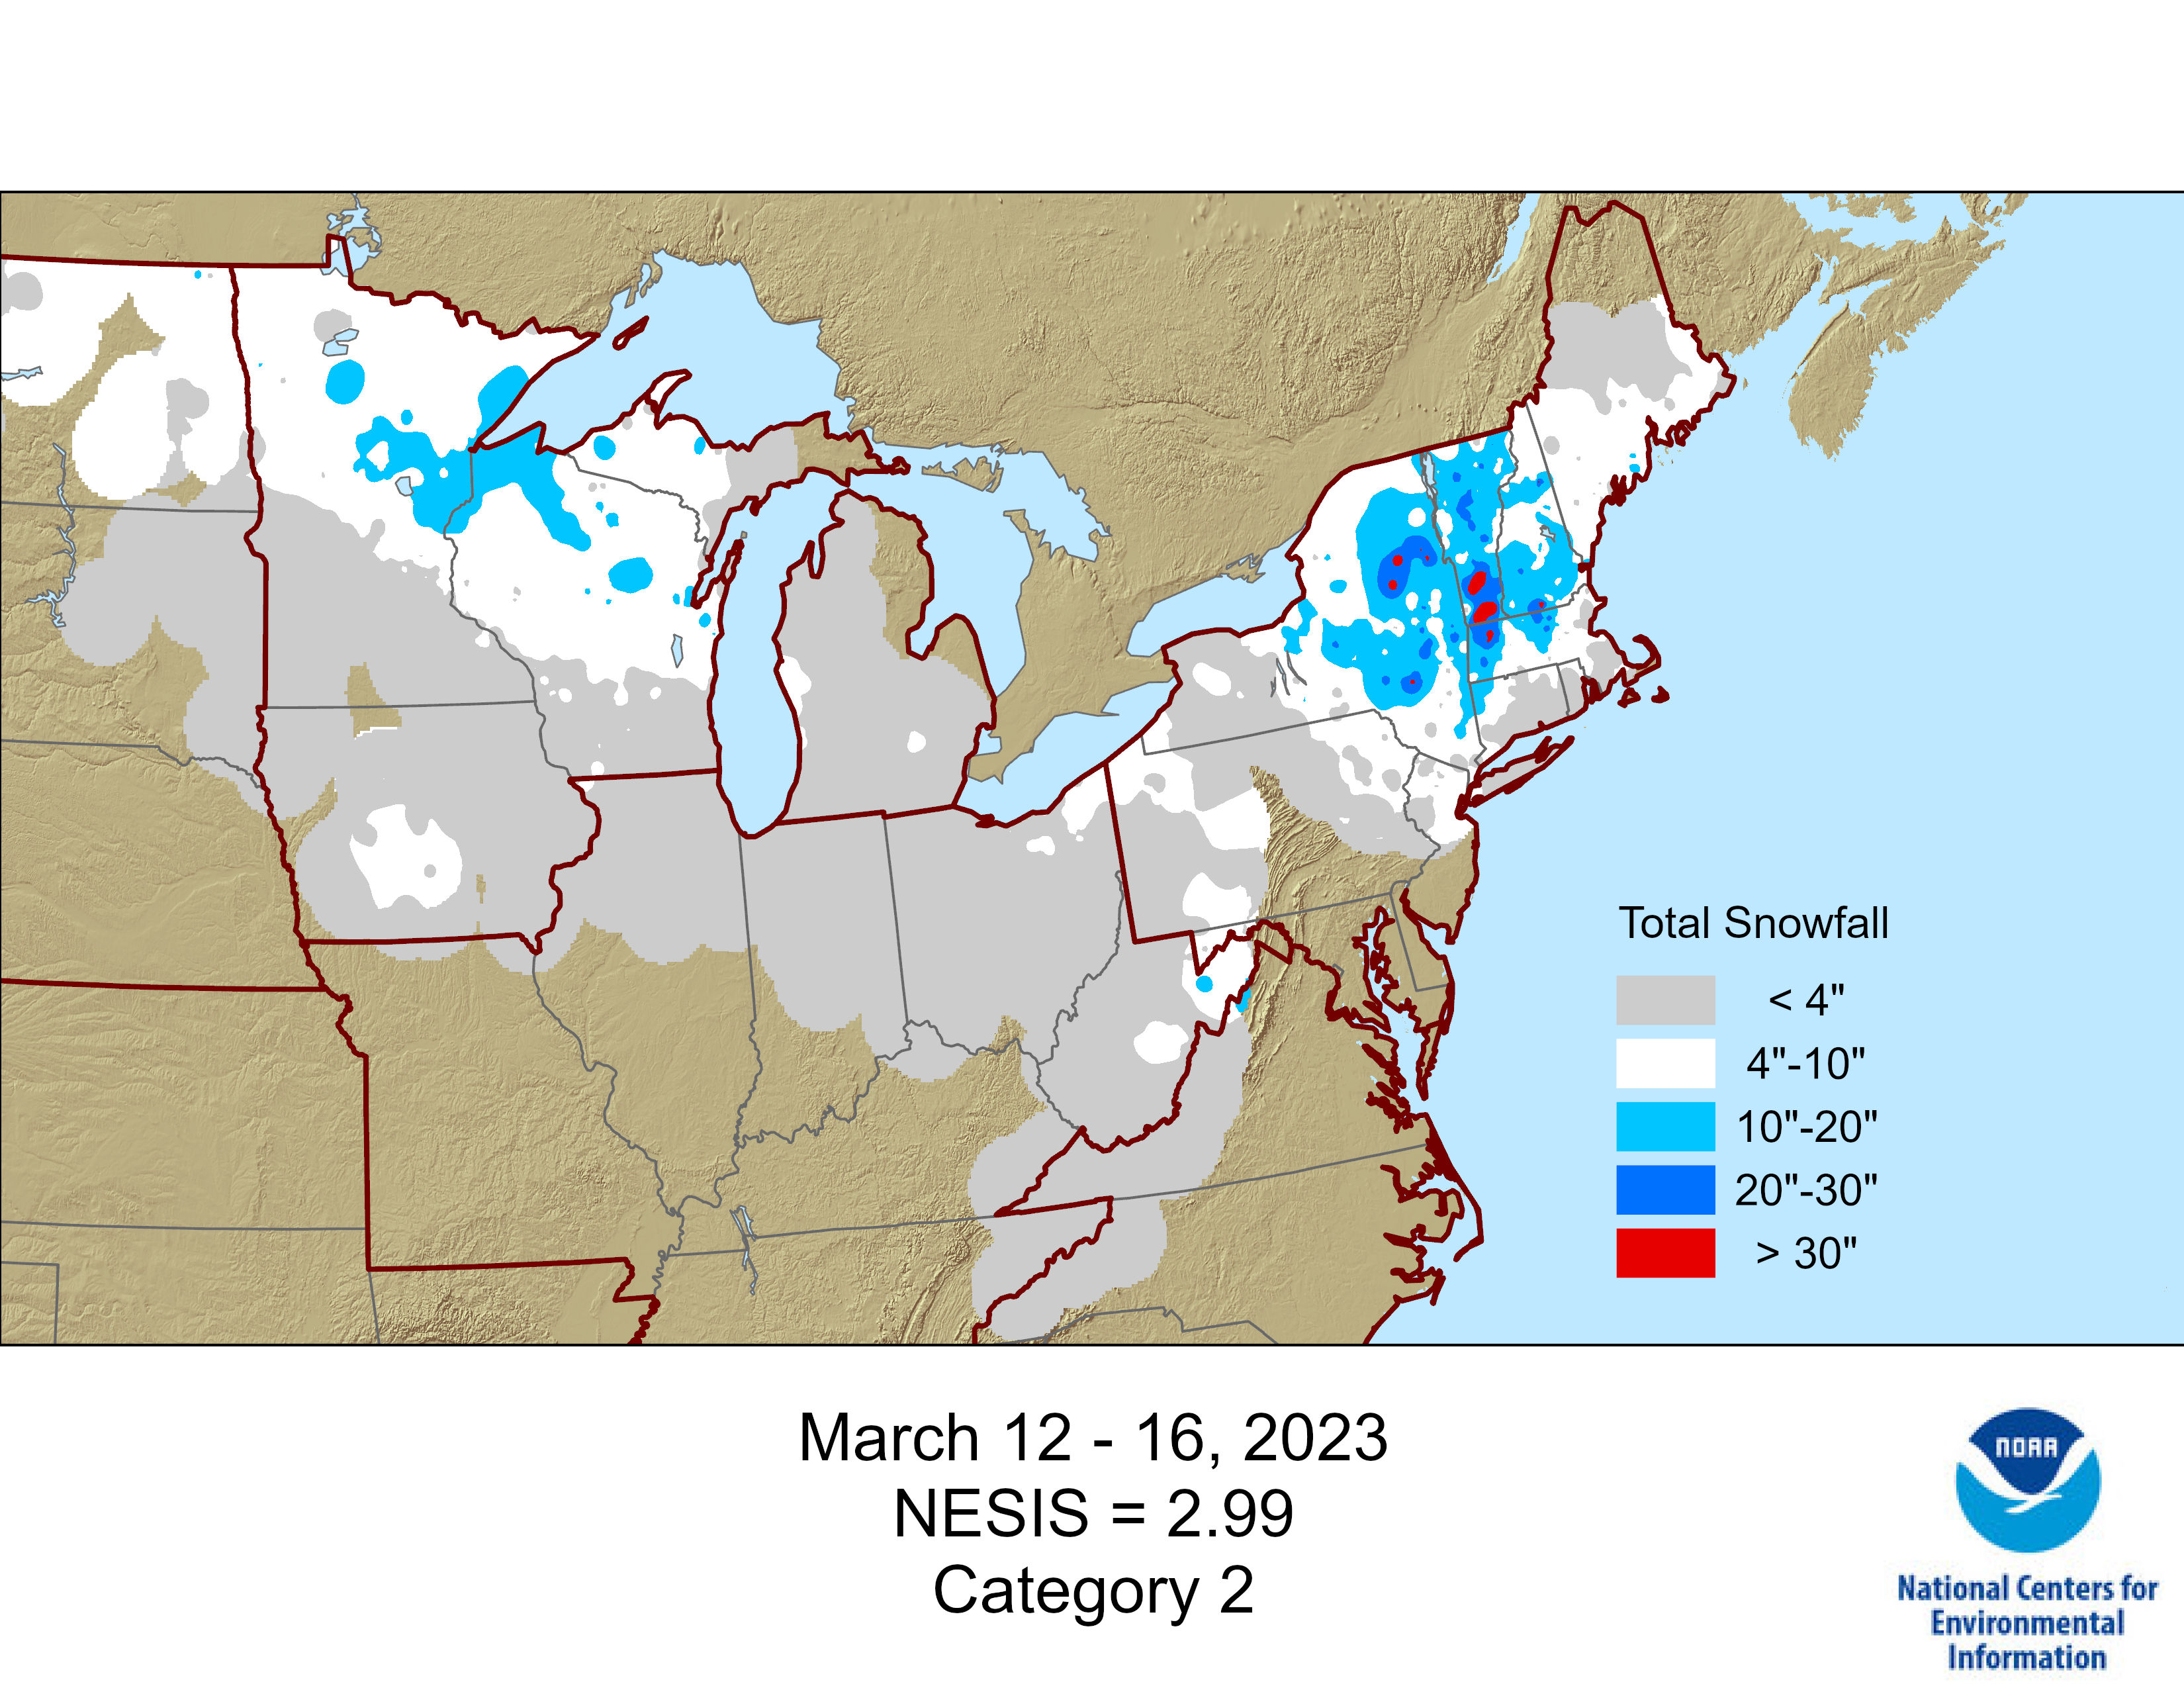
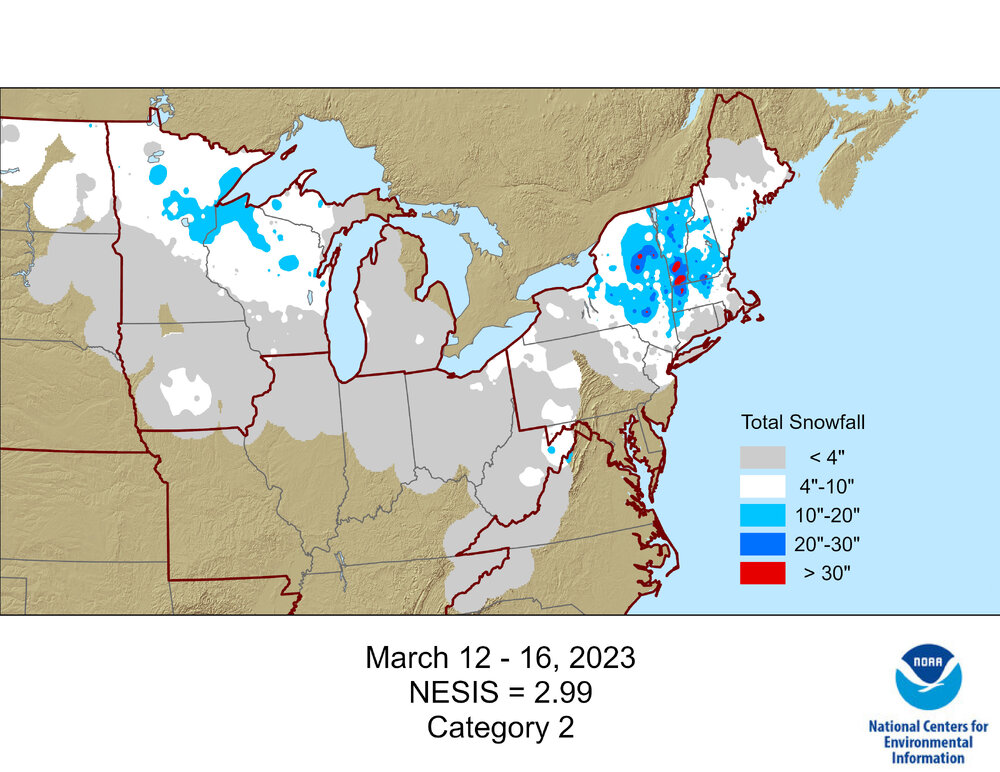
This event was recently added to the NESIS list as a cat 2 w/snowfall map. Pretty sure they added in when they did Jan 2026, last i checked the most recent was Dec 2022.
-

Winter 25-26 (All Snowfall Maps & Season Total)
The 4 Seasons replied to The 4 Seasons's topic in New England
yea i closed that gap of 36-48 from the last update on March 2nd. There was nothing under 48" from cocorahs stations but if you're right at 48 thats probably a min nearly statewide except for the cape/ACK -
Winter 25-26 (All Snowfall Maps & Season Total)
The 4 Seasons replied to The 4 Seasons's topic in New England
I wish there were some spotters in the upper elbow. It would help me know what to do there when there is a tight gradient. I rarely, if ever, see reports from Provincetown... -
Winter 25-26 (All Snowfall Maps & Season Total)
The 4 Seasons replied to The 4 Seasons's topic in New England
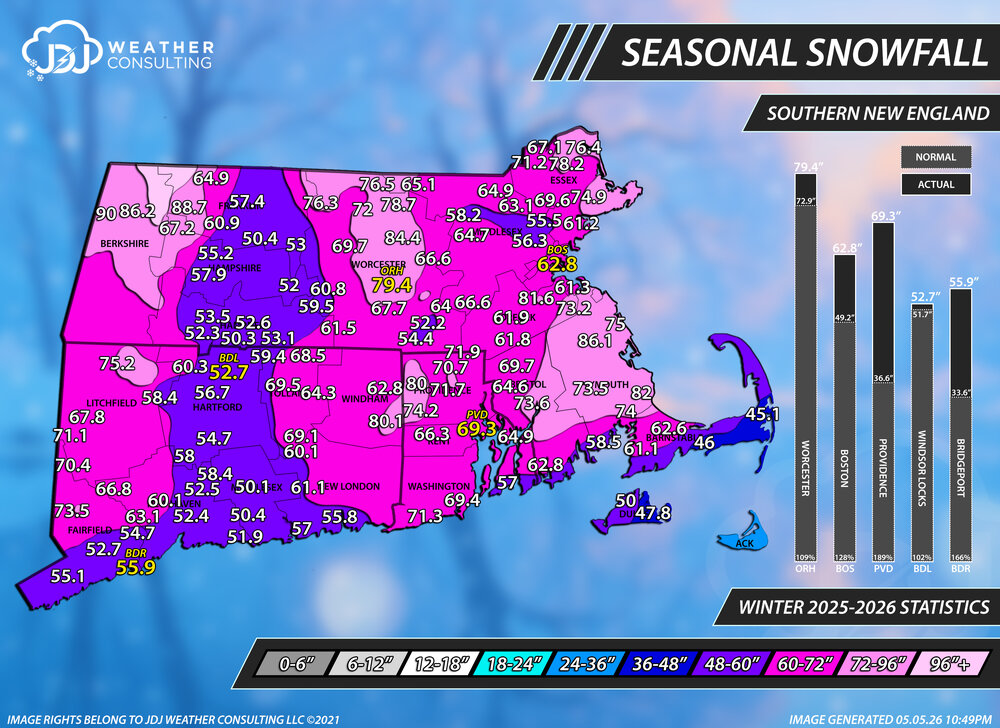
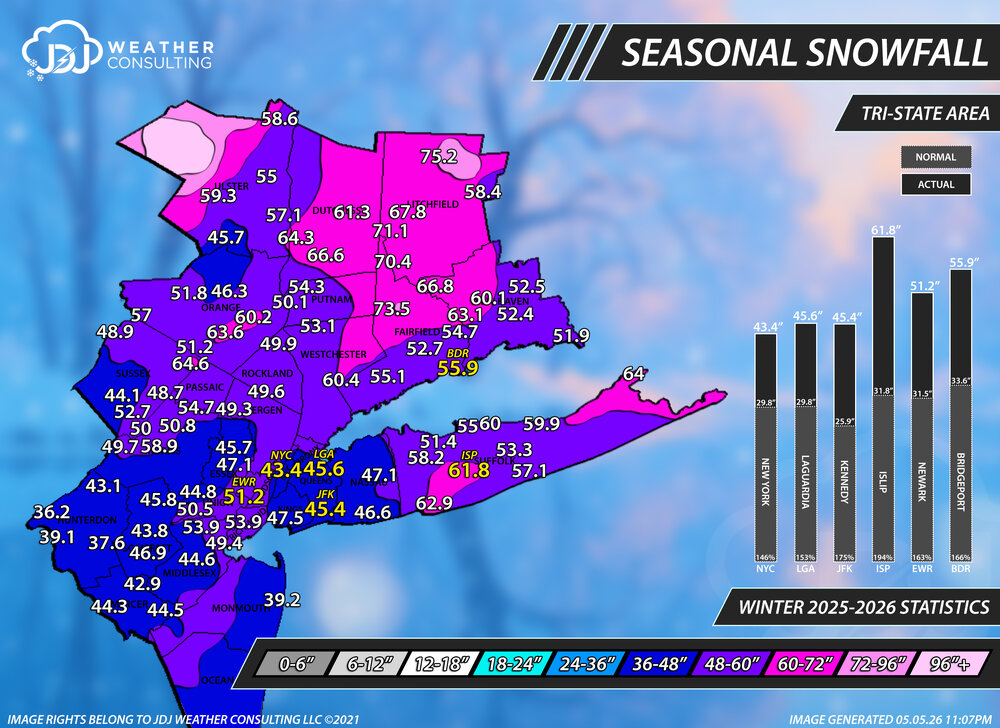
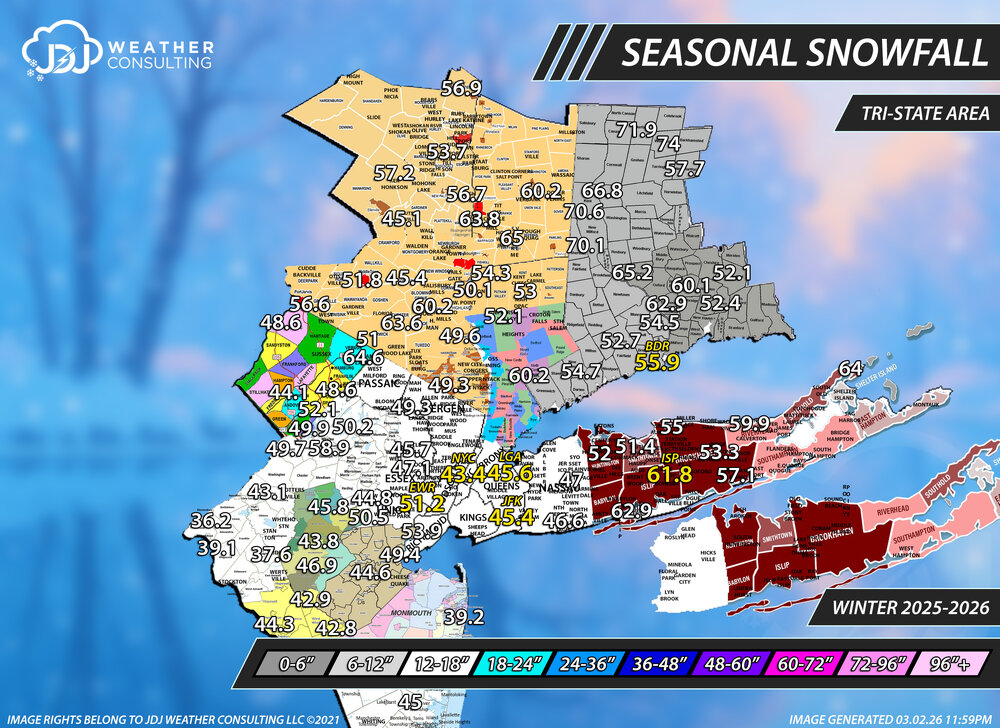
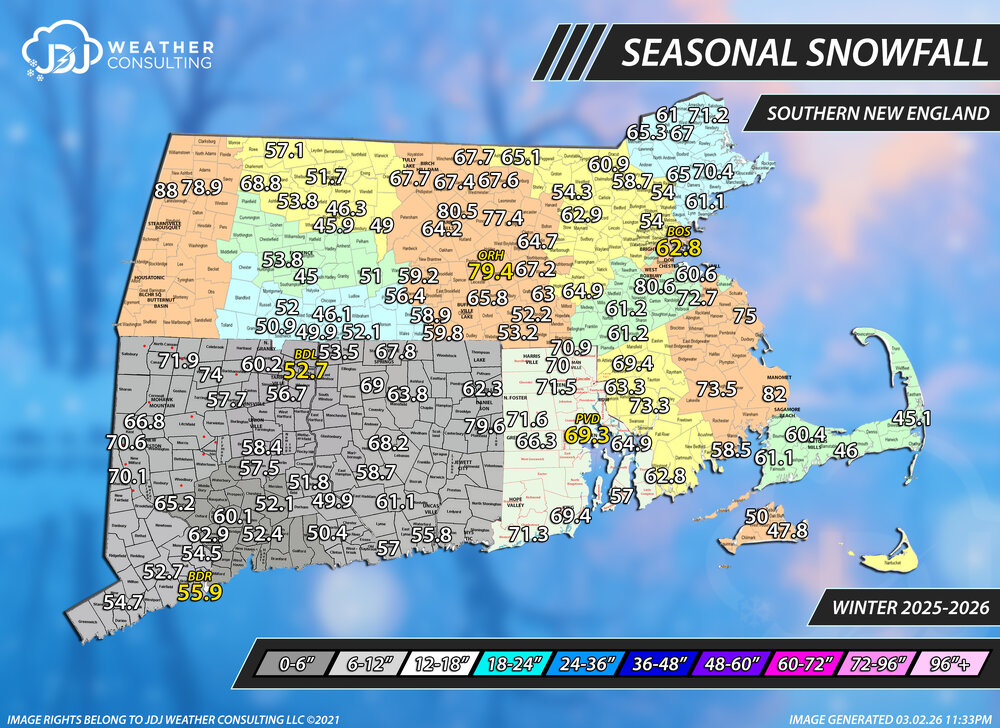
All the climate sites came in above normal but ISP had a crazy good winter with near 200% of normal snowfall, same with PVD (mostly from one storm) Long Island and the Cape/S. Coast did really well overall
-
Winter 25-26 (All Snowfall Maps & Season Total)
The 4 Seasons replied to The 4 Seasons's topic in New England
Yeah i just added the 0.5 you gave me on March 3rd to the 79.6 you had on March 2nd. Same with Tolland. I was hoping the map would change significantly after the beginning of March but i guess not...not this year, another dead March. -
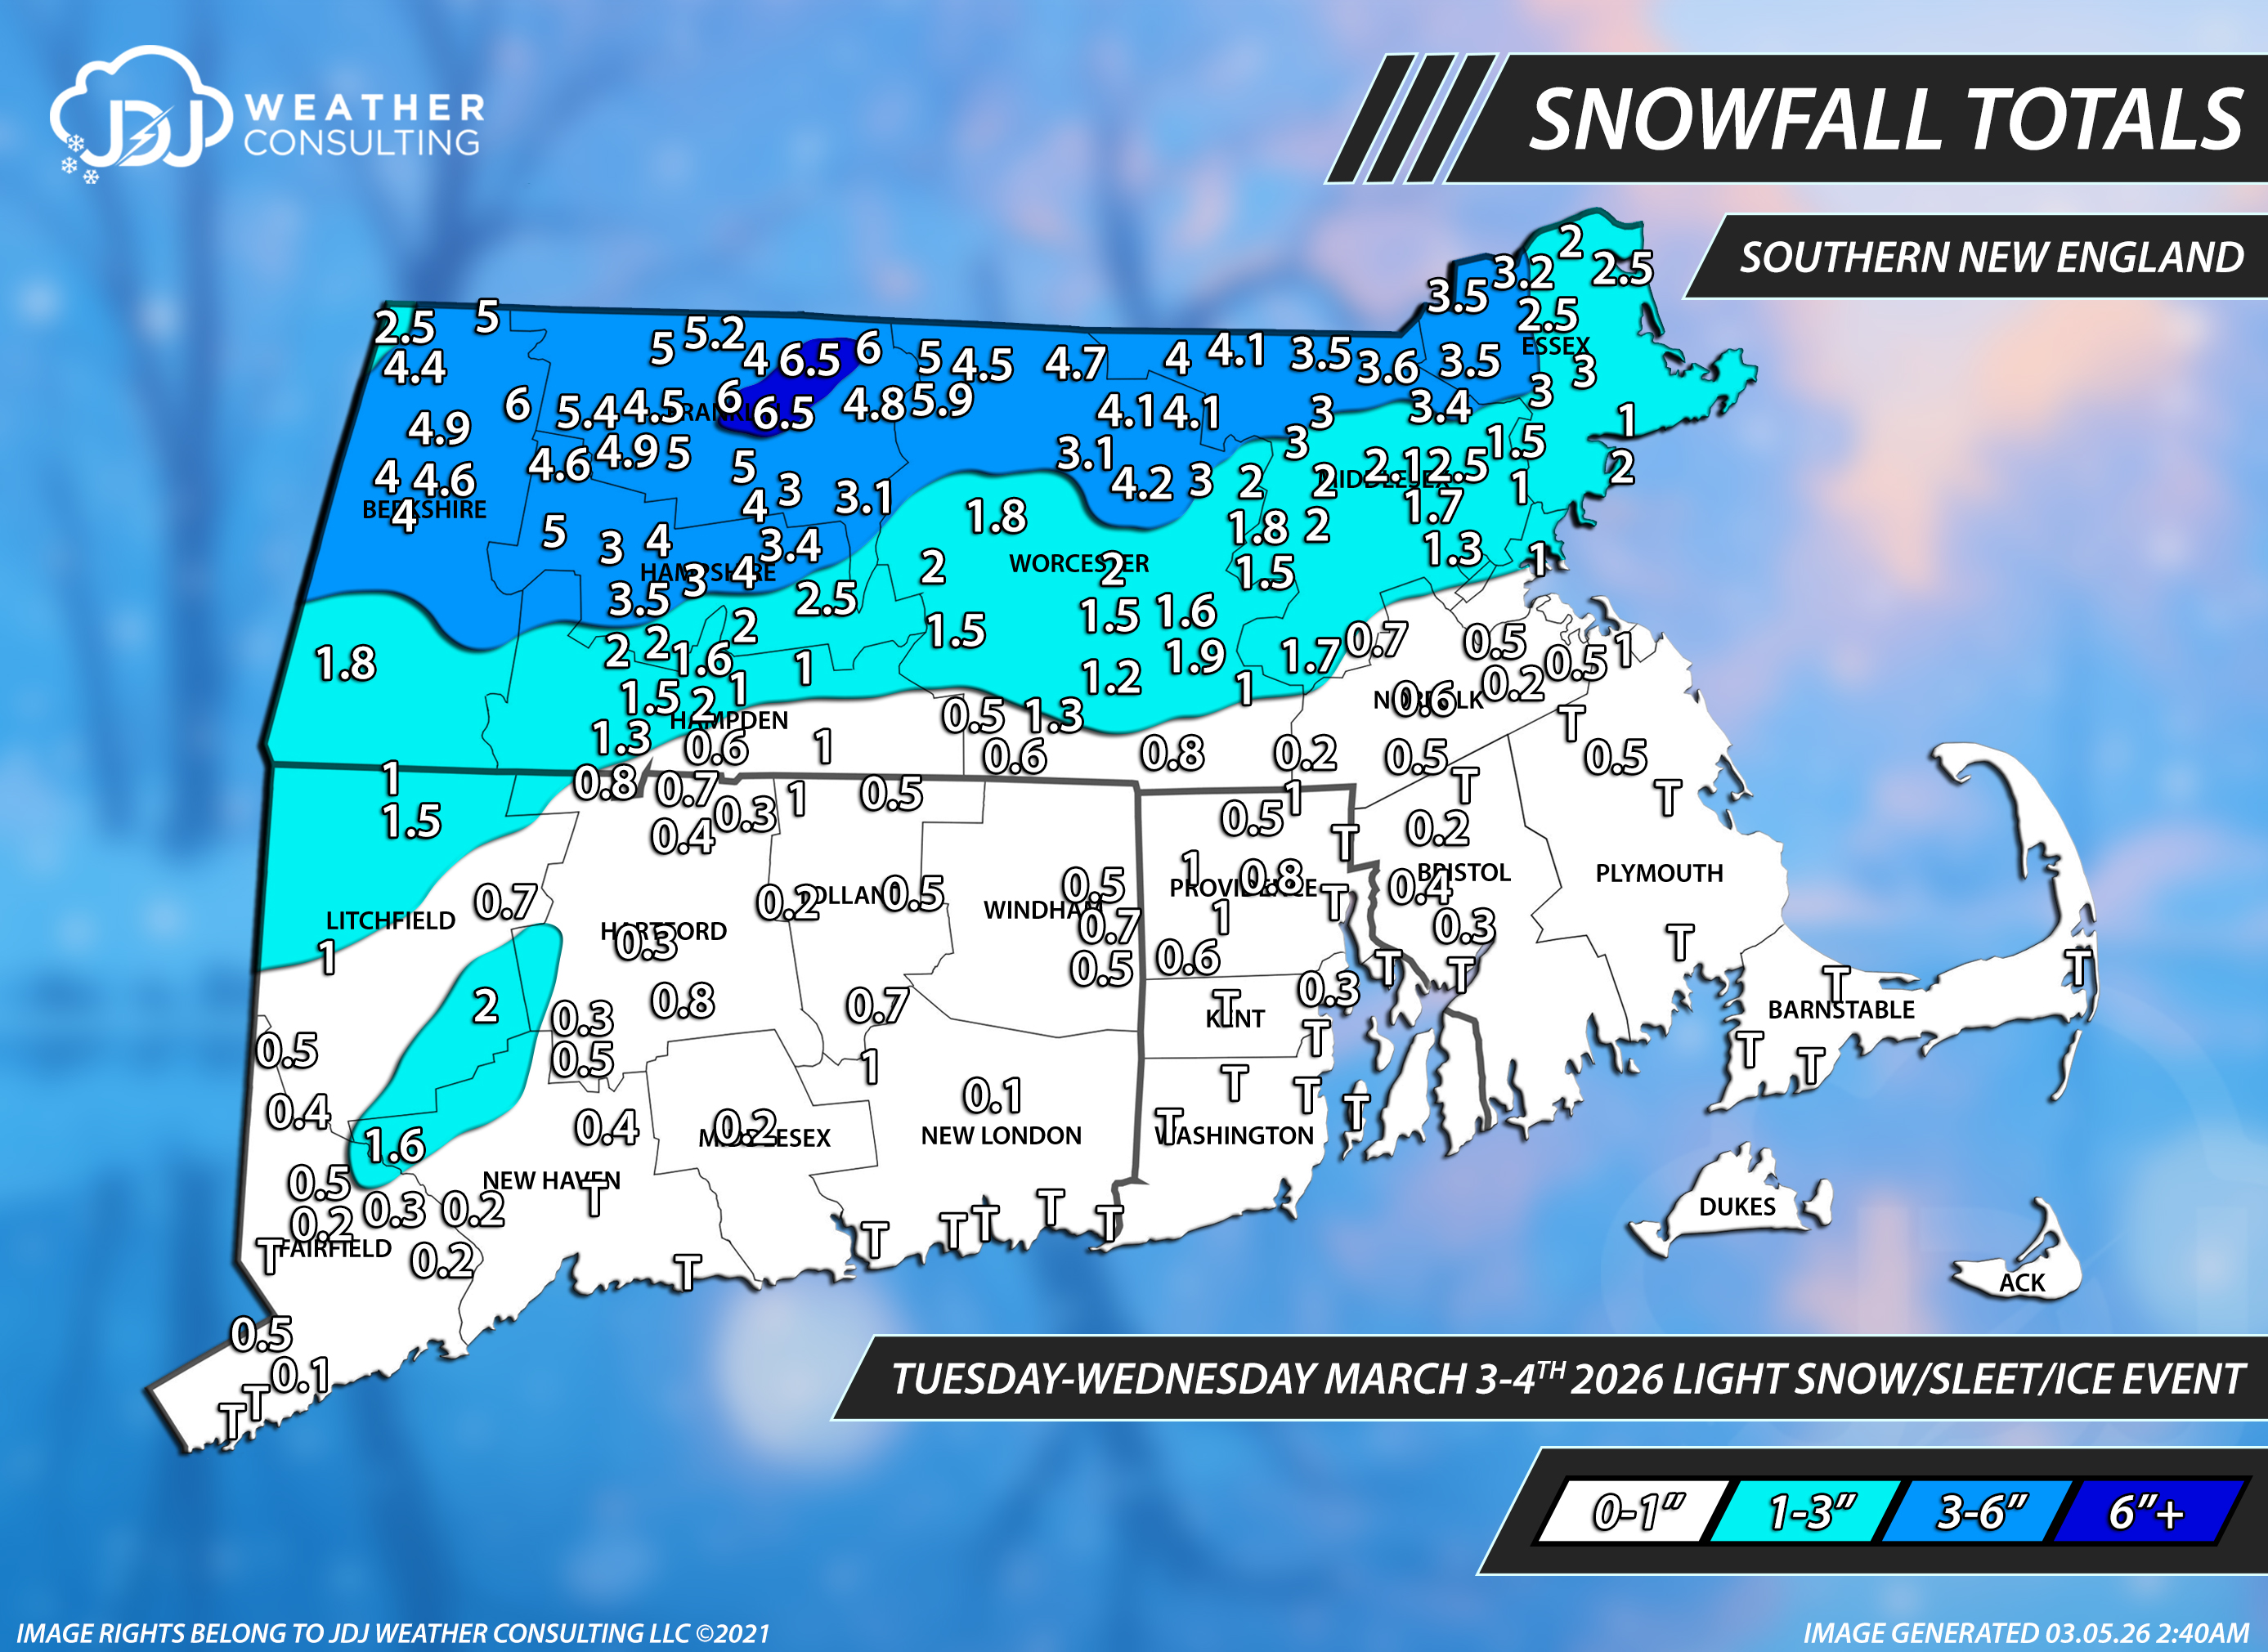
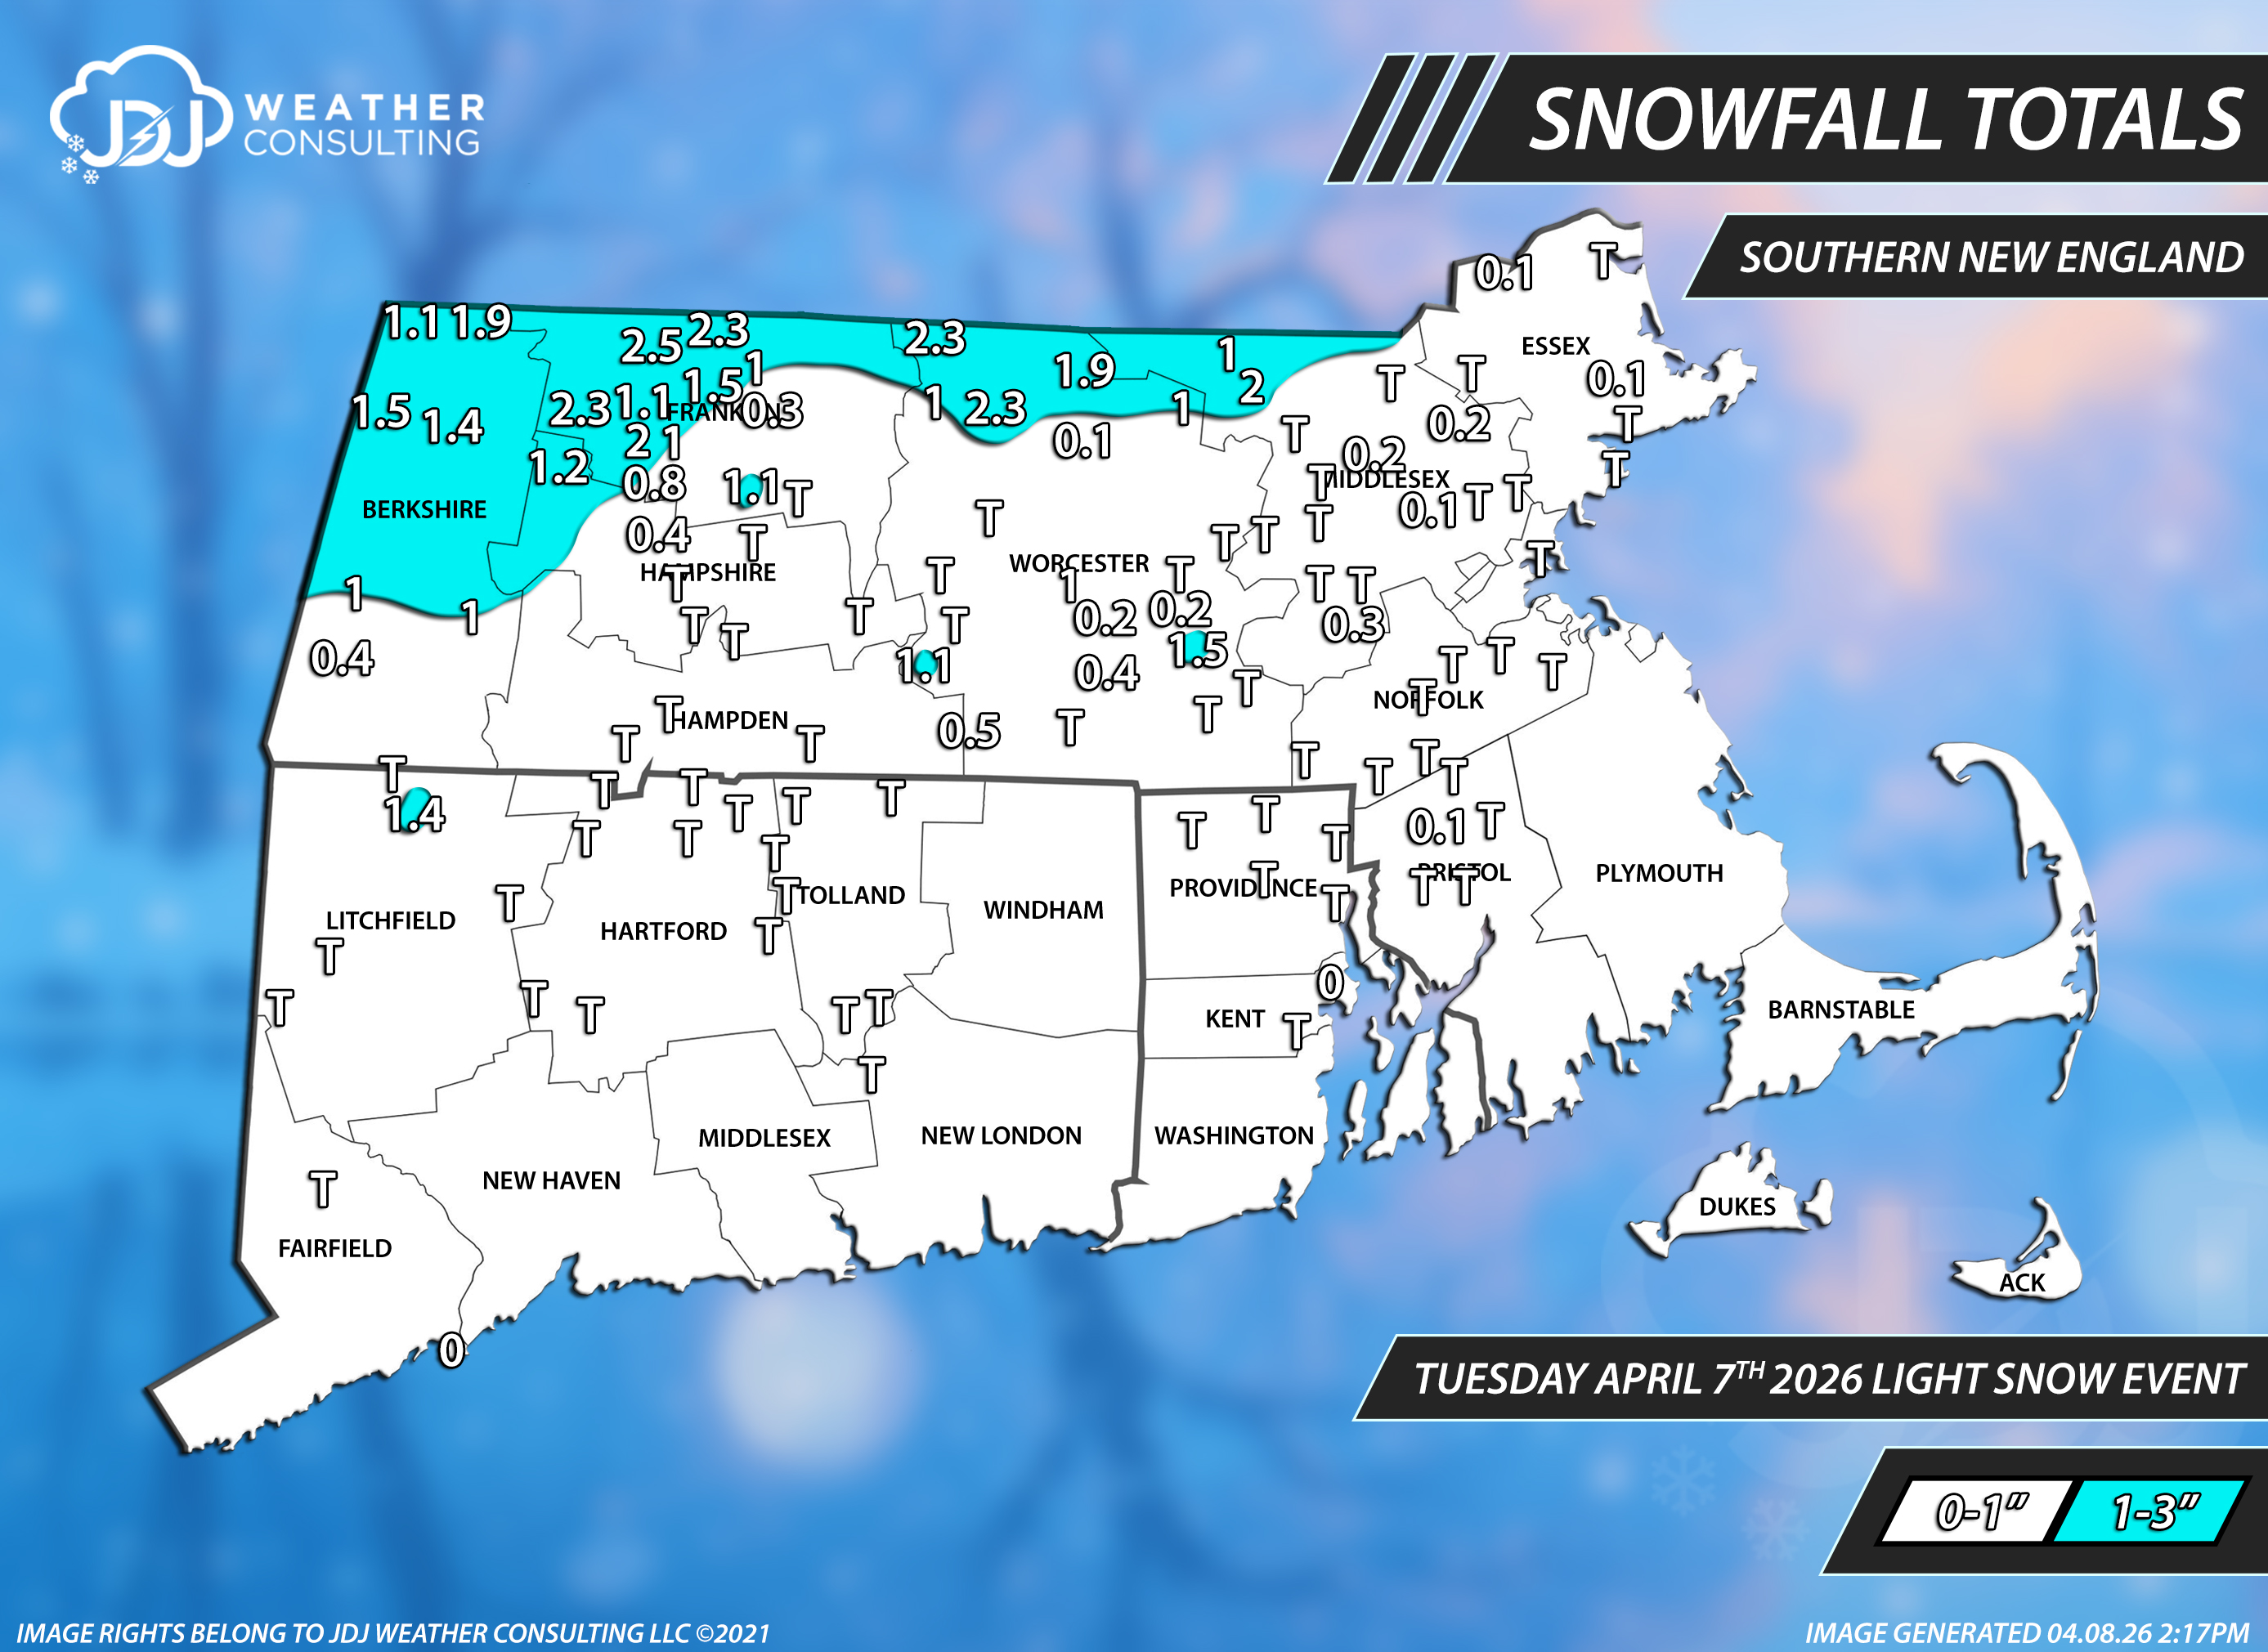
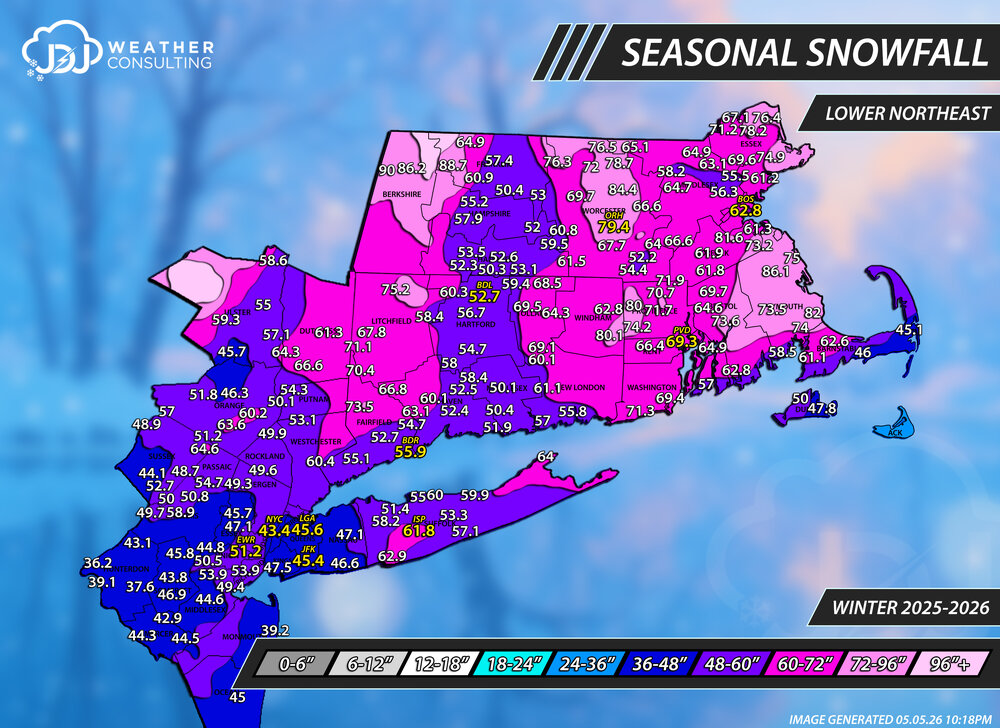
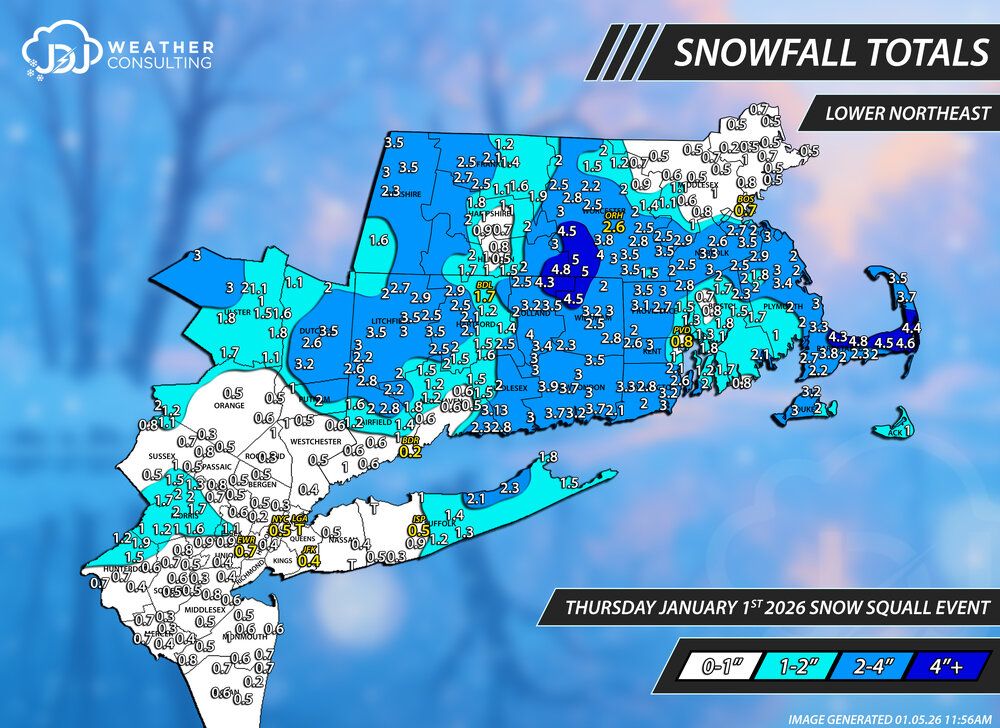
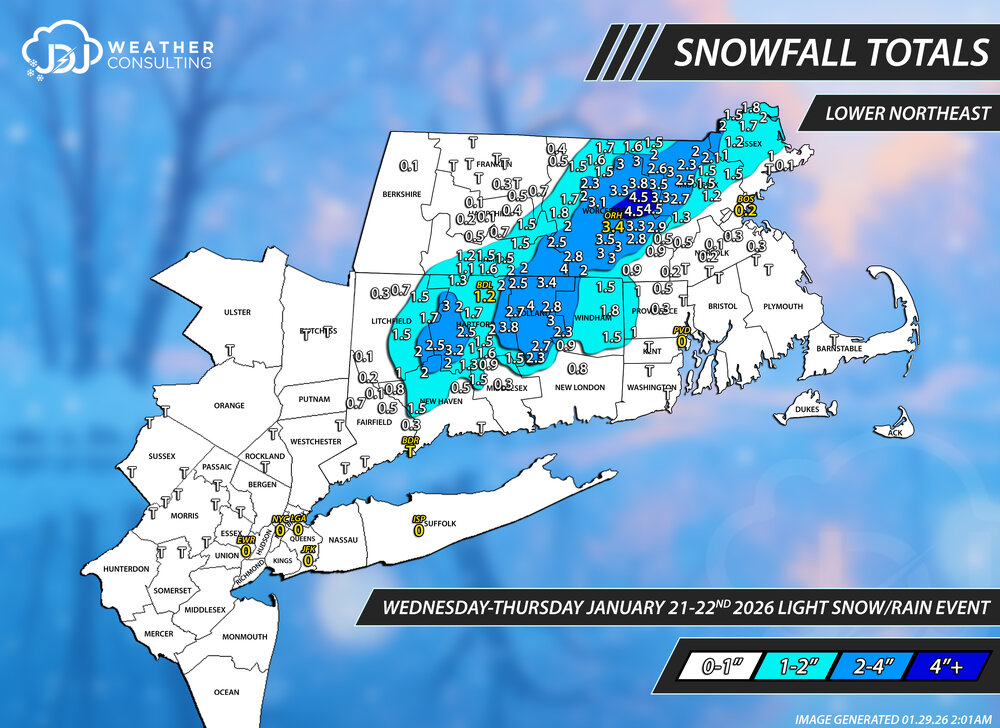
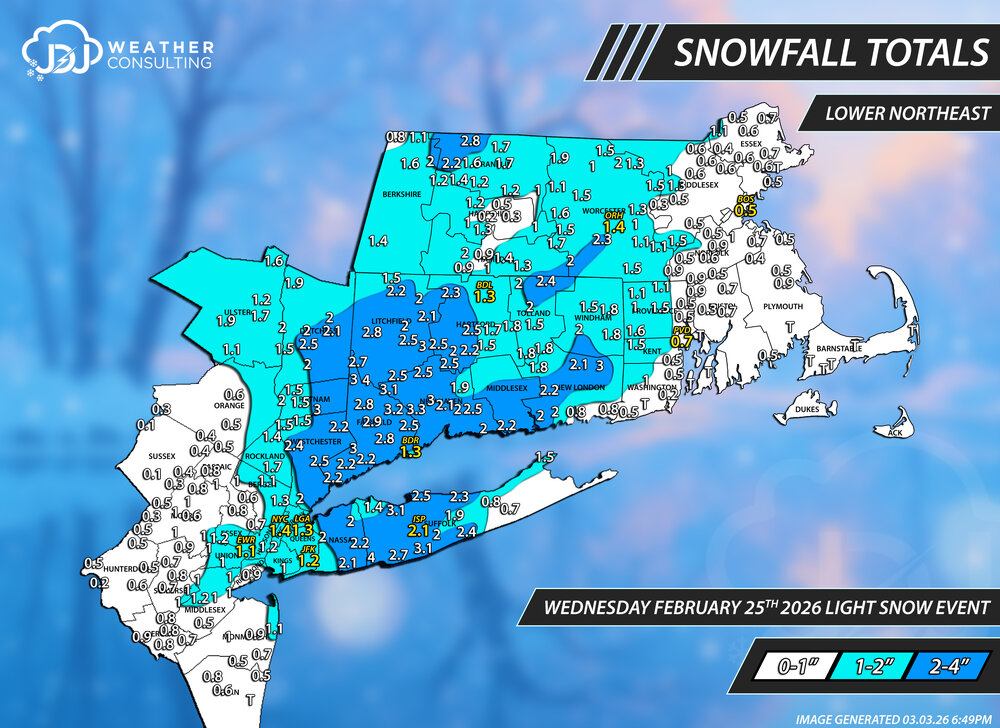
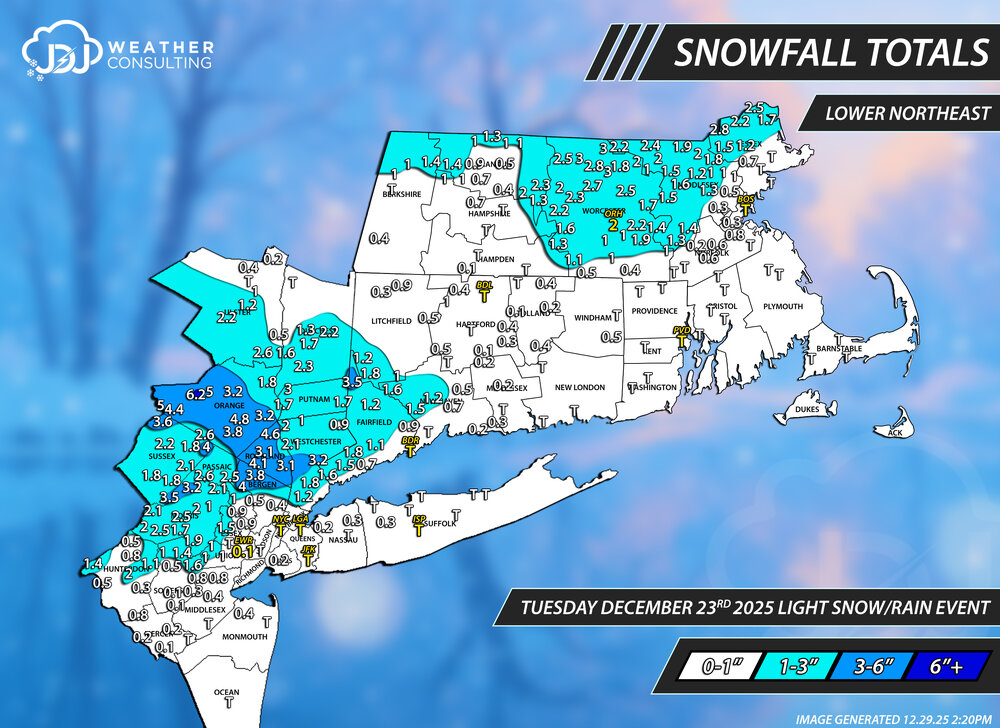
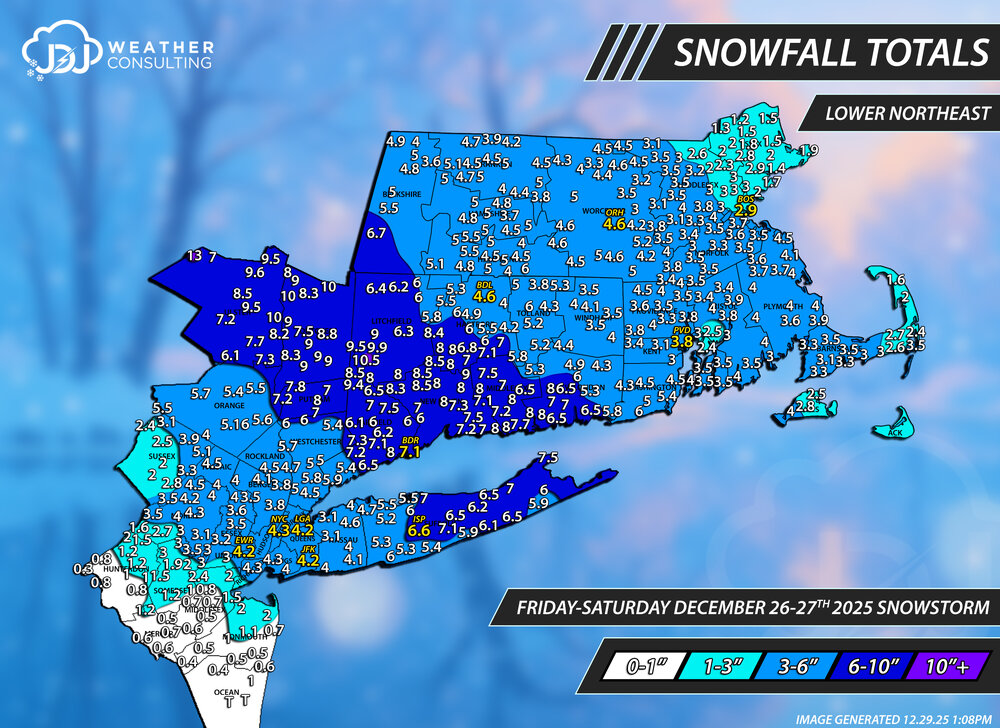
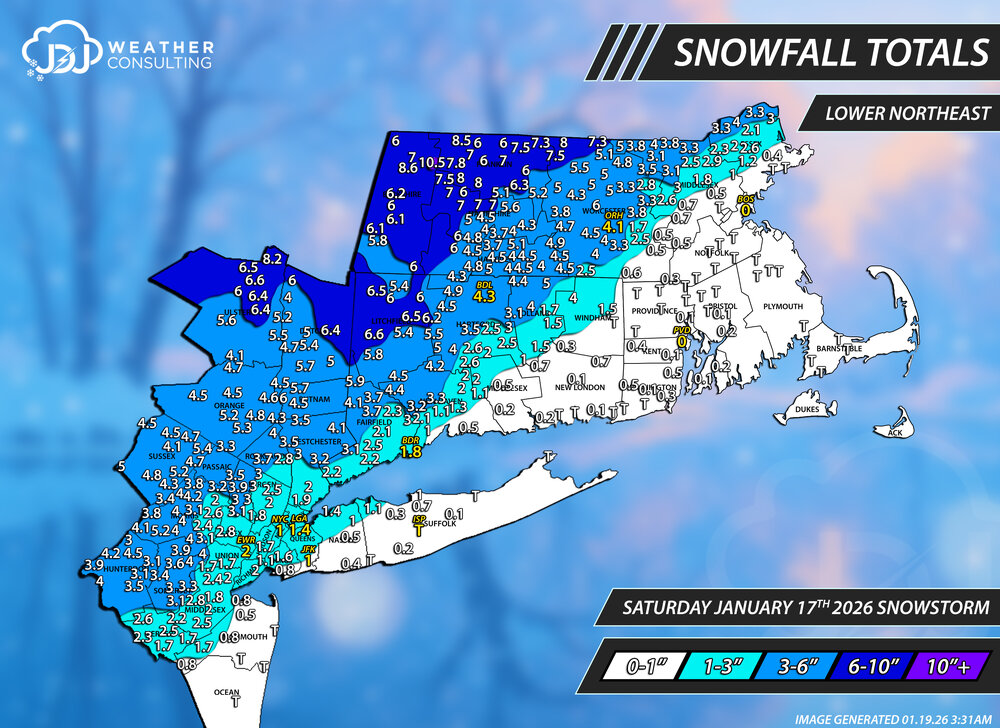
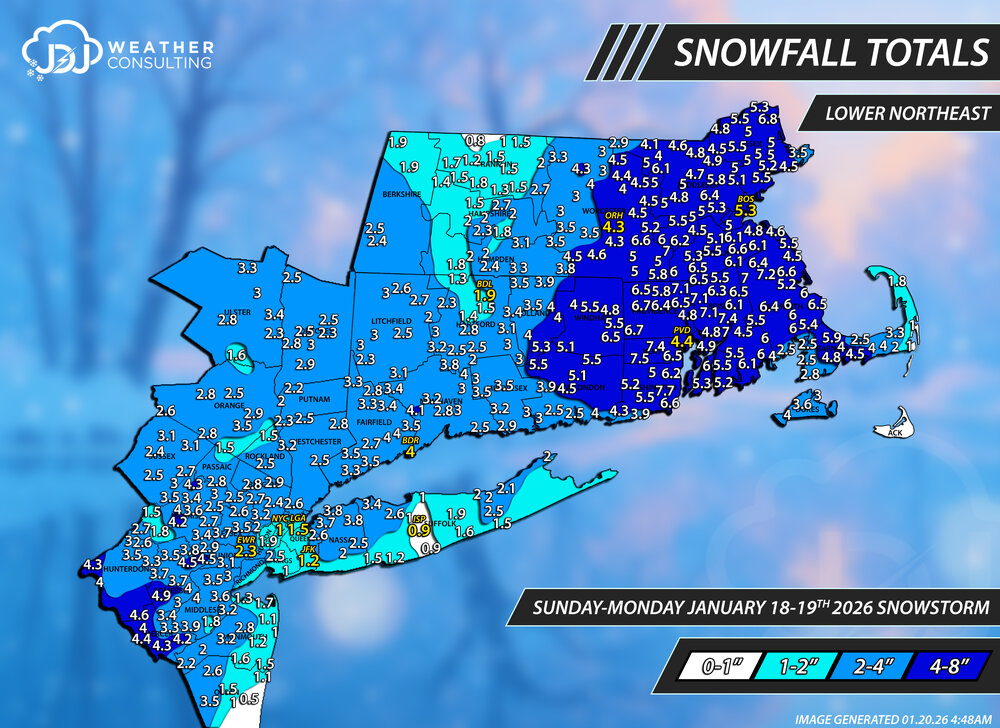
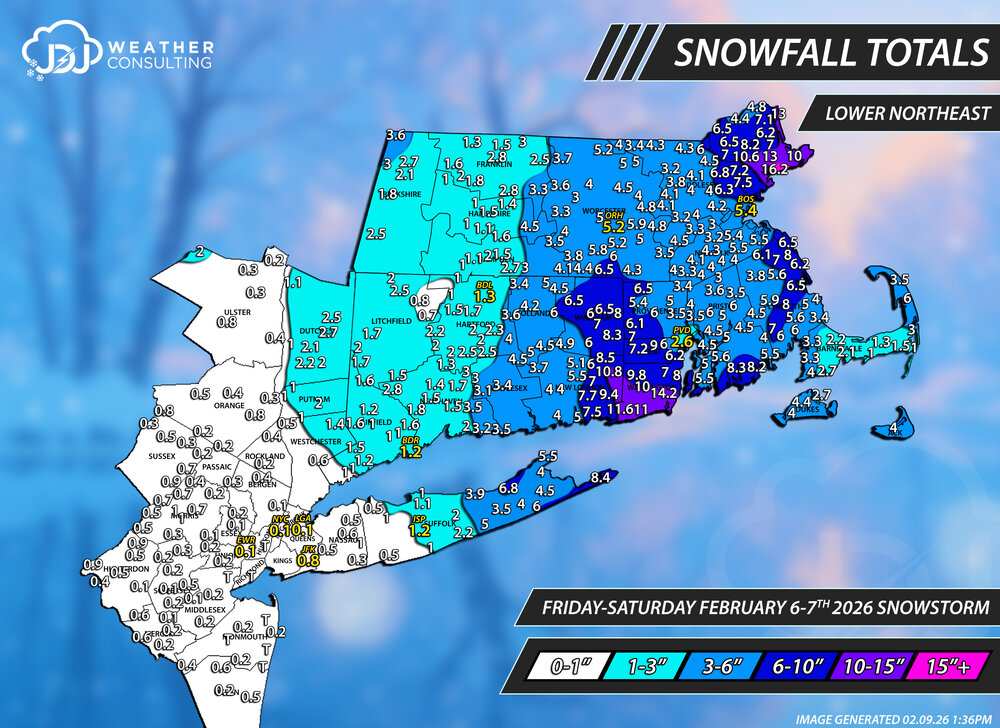
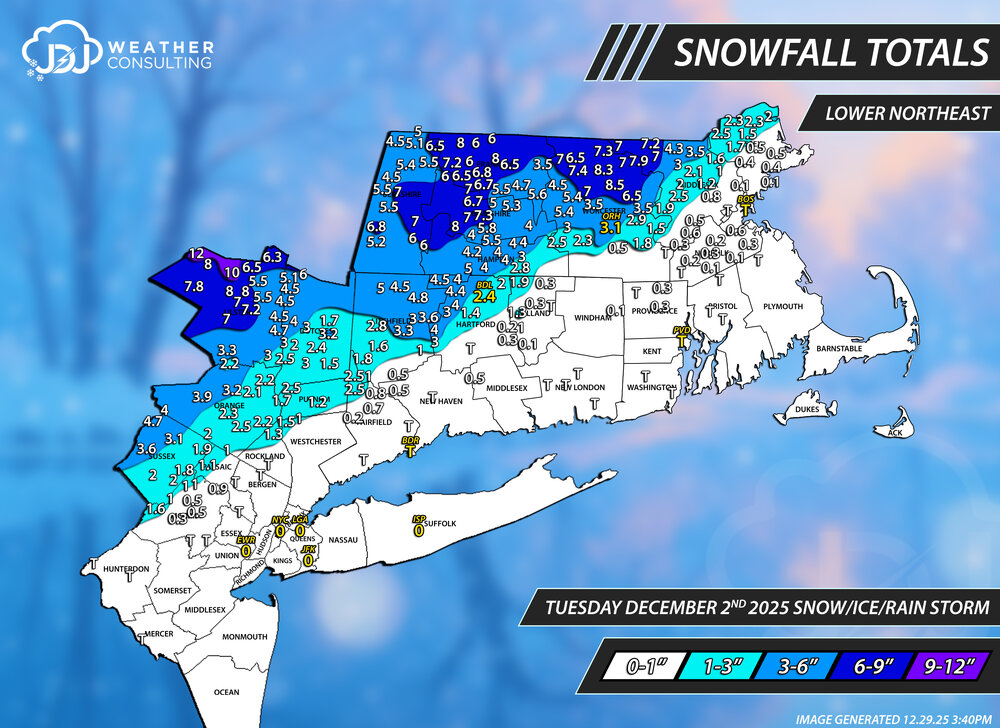
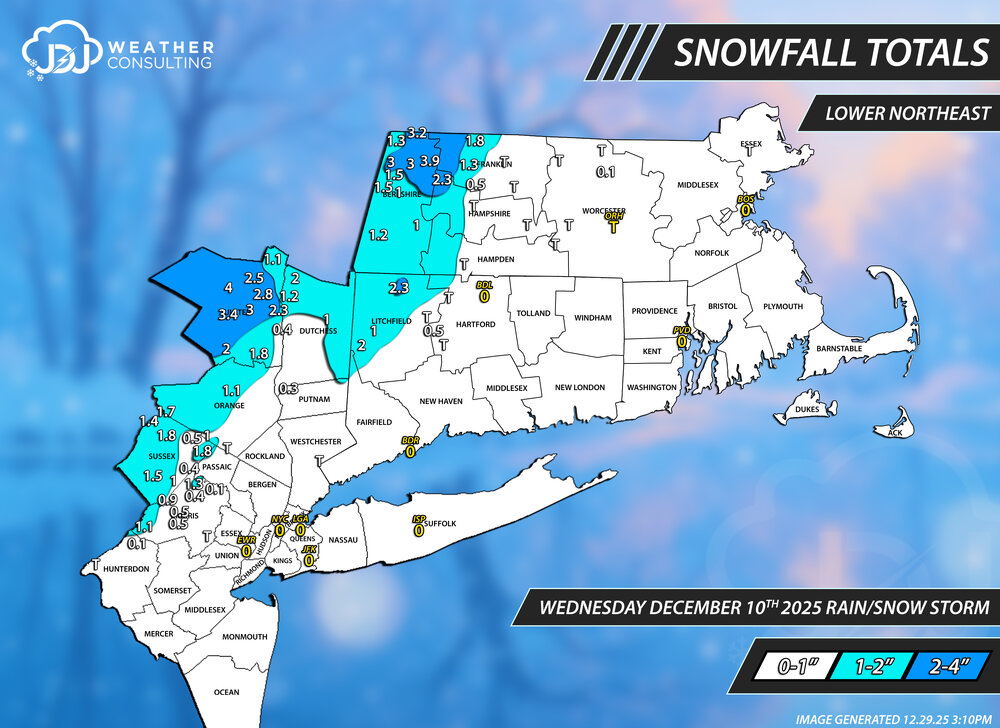
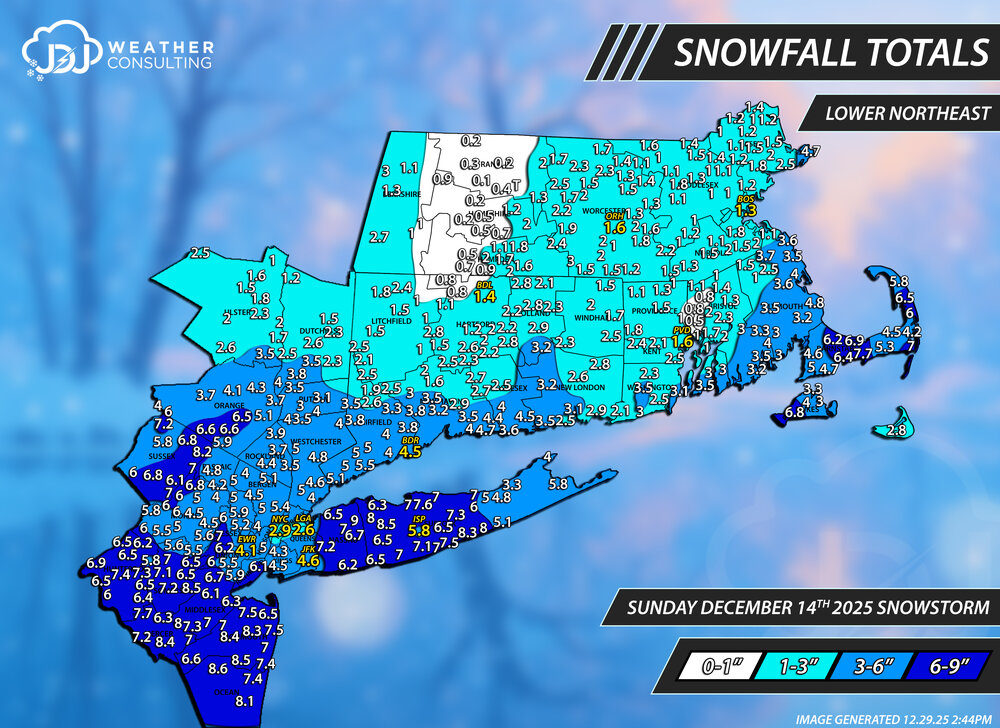
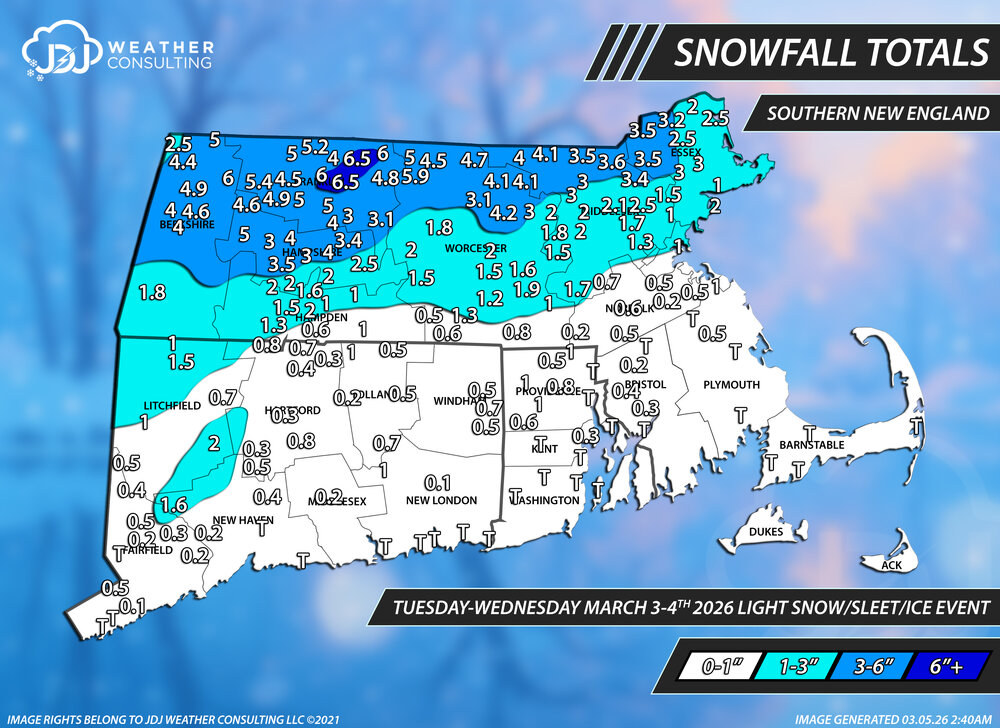
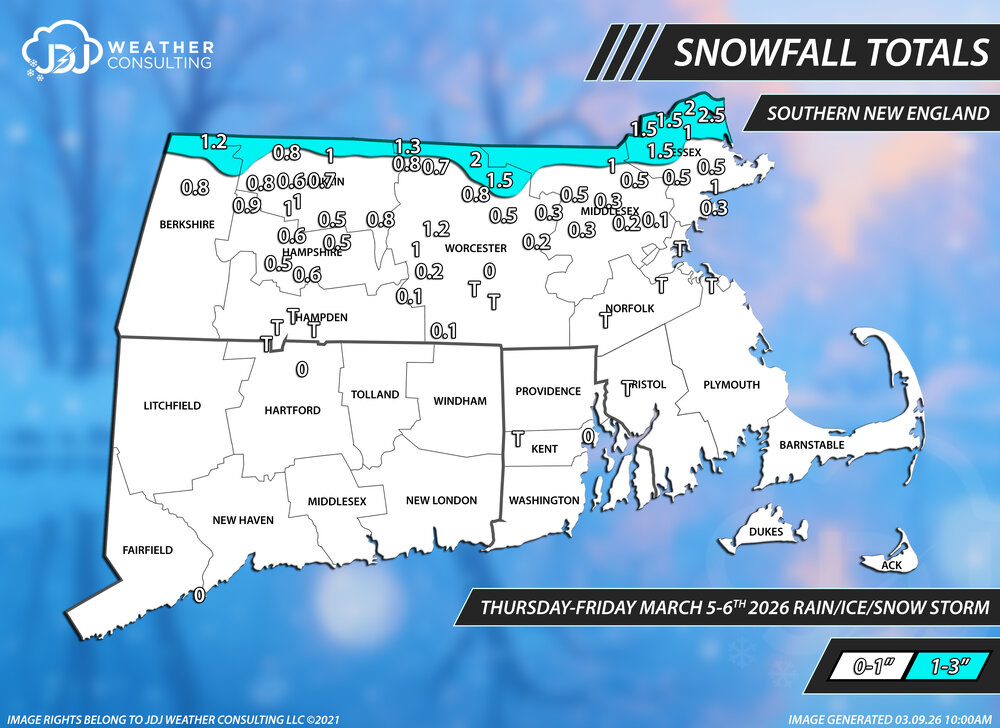
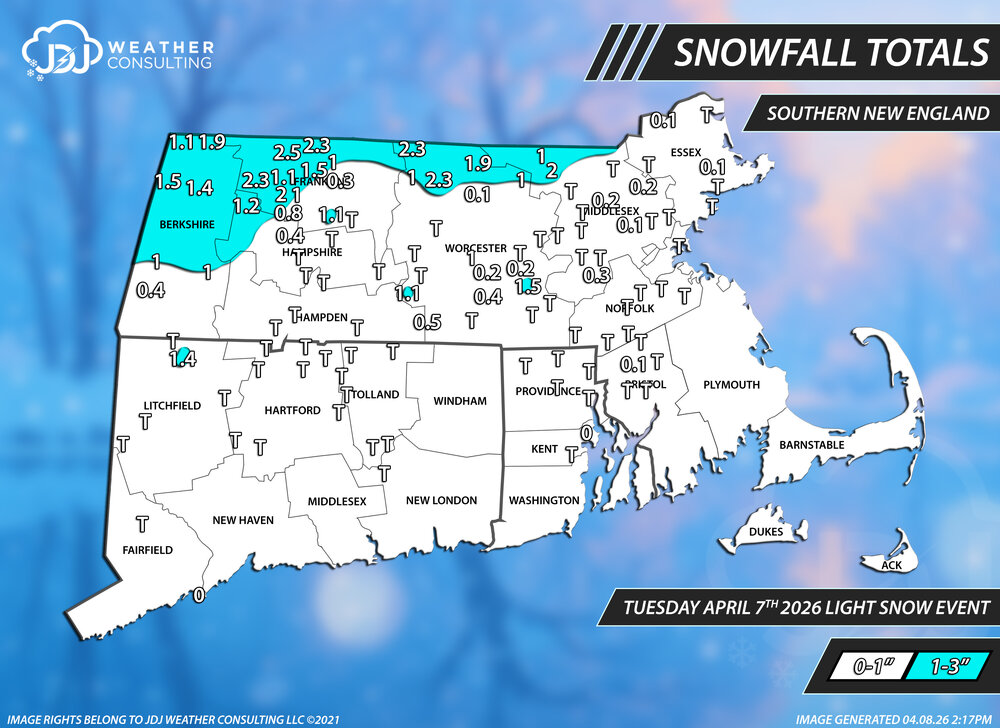
I just finished the final season snowfall maps for the 25-26 season. The past few years i made a thread for all of the snowfall maps for the season, i had some extra storage space so i thought it would be good to do another one with the season total. Thank you to everyone who sent in a report. I tried to include most of them if i could fit them in and jived with the last update on March 2nd. There were no major events since March 2nd but a few minor accumulating systems (March 3-4th, March 5-6th and April 7th). I put out a few calls to send me your final season total but if i didn't hear from you i did my best to add these minor events to the Mar 2nd update or remove the report. The map didn't change too much from the Mar 2nd update except across the northern tier of the region. There are additional seasonal snowfall maps for the area including CT/SNE/Tri-State in the winter 25-26 page. There is also a progression animation image for the season. These are the main storms of the season that featured at least 1" of snowfall across CT, SNE or Tri-State. If you want to see every single event, and there are much more, they are in the winter 25-26 page under Southern New England (25 events). All of these systems below (except for one) are featured in the main archive with radar, surface and upper air maps. Winter 25-26 Season Snowfall Winter 25-26 Progression Winter 25-26 Statistics December 2nd 2025 December 10th 2025 December 14th 2025 December 23rd 2025 December 26-27th 2025 December 31st 2025-January 1st 2026 January 17th 2026 January 18-19th 2026 January 21-22nd 2026 January 25-26th 2026 February 6-7th 2026 February 22-23rd 2026 February 25th 2026


-
I just finished the final season snowfall maps for the 25-26 season. The past few years i made a thread for all of the snowfall maps for the season, i had some extra storage space so i thought it would be good to do another one with the season total. Thank you to everyone who sent in a report. I tried to include most of them if i could fit them in and jived with the last update on March 2nd. There were no major events since March 2nd but a few minor accumulating systems (March 3-4th, March 5-6th and April 7th). I put out a few calls to send me your final season total but if i didn't hear from you i did my best to add these minor events to the Mar 2nd update or remove the report. The map didn't change too much from the Mar 2nd update except across the northern tier of the region. There are additional seasonal snowfall maps for the area including CT/SNE/Tri-State in the winter 25-26 page. There is also a progression animation image for the season. These are the main storms of the season that featured at least 1" of snowfall across CT, SNE or Tri-State. If you want to see every single event they are in the winter 25-26 page under Tri-State Area (14 events). All of these systems below (except for one) are featured in the main archive with radar, surface and upper air maps. Winter 25-26 Season Snowfall Winter 25-26 Progression Winter 25-26 Statistics December 2nd 2025 December 10th 2025 December 14th 2025 December 23rd 2025 December 26-27th 2025 December 31st 2025-January 1st 2026 January 17th 2026 January 18-19th 2026 January 21-22nd 2026 January 25-26th 2026 February 6-7th 2026 February 22-23rd 2026 February 25th 2026


-
that was you, when i did that map on March 2nd. On the March 3-4th storm you tagged me with 0.5" so that should put you at 73.2"
-
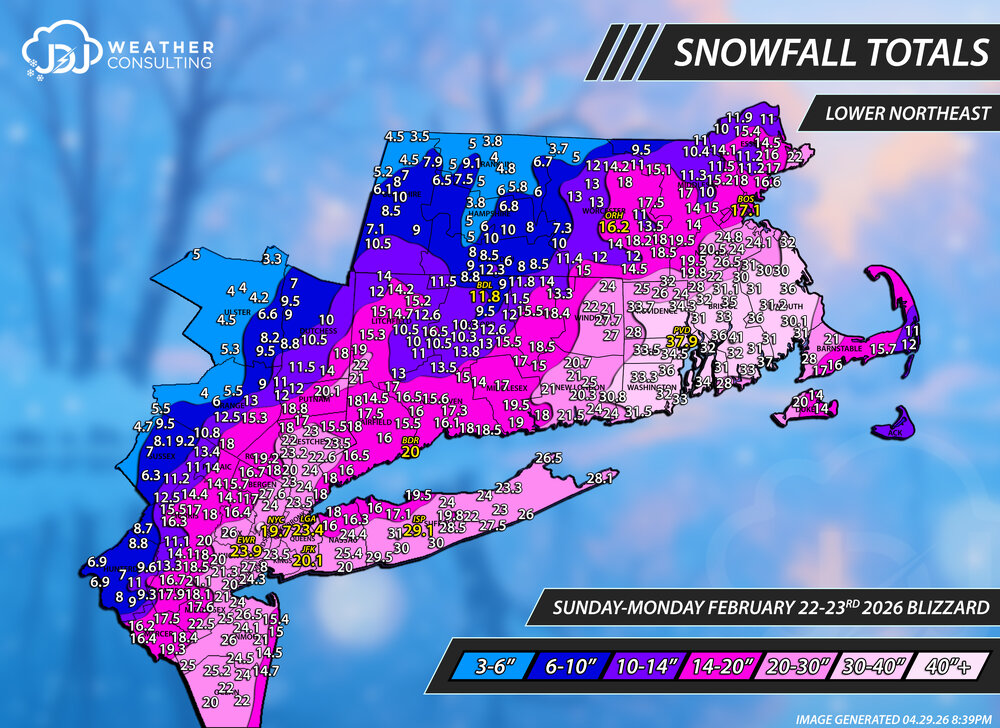
Since Newark was changed to 23.9" i updated all the maps to reflect this. I also wanted to fix Westchester county and lower the amounts there and make some other slight adjustments. https://www.jdjweatherconsulting.com/feb-22-23-2026
-
how does one prepare? is it like going to the store to buy milk and bread
-
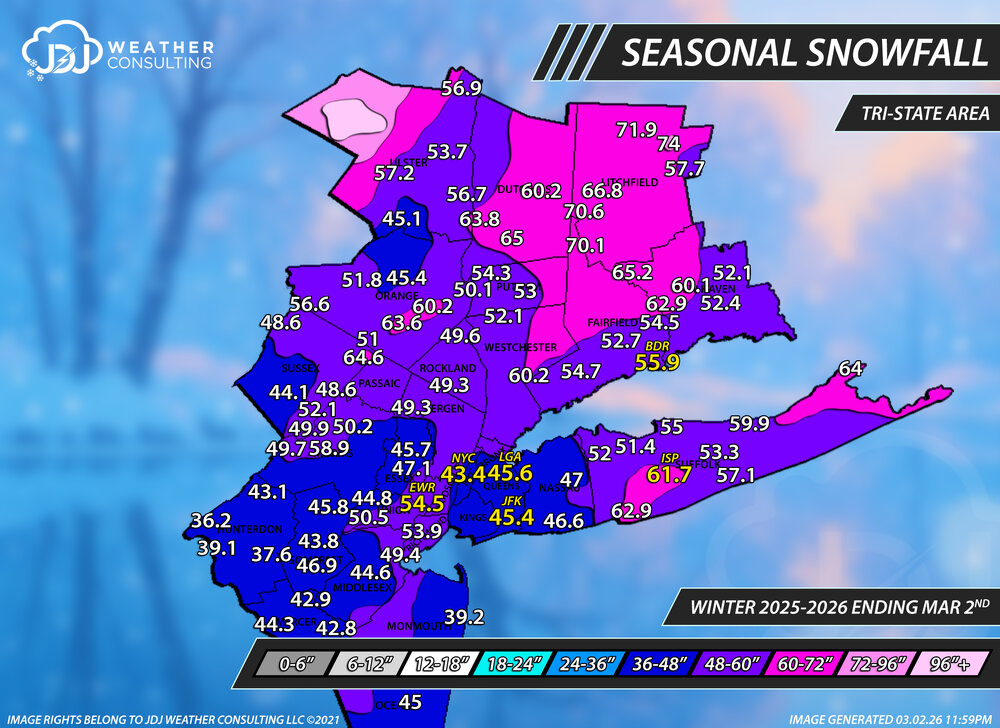
Last call for any final season snowfall reports for Tri-State Area (if you didn't already msg me). I'll have all the final season snowfall maps out this week. If i don't hear from you ill do my best to add the 3 minor events from Mar 3-4, Mar 5-6 and Apr 7 to this map. The numbers on this map were ending on March 2nd (except the climate sites which i already changed).
-
Last call for any final season snowfall reports for SNE (if you didn't already msg me). I'll have all the final season snowfall maps out this week. If i don't hear from you ill do my best to add the 3 minor events from Mar 3-4, Mar 5-6 and Apr 7 to this map. The numbers on this map were ending on March 2nd (except the climate sites which i already changed).
-
so what happens now
-
Newark EWR changed their snowfall from 27.2 to 23.9" for some reason. Not sure if this was mentioned, but i just discovered it. @donsutherland1
-
I'm putting out a call for anyone who has final snowfall totals for the season for their town. There wasn't much after the last update on March 2nd but interior areas may have added a bit to this. Let me know via PM or tag me, thanks! Winter 25-26 snowfall maps
- 970 replies
-
- 4
-

-

-
- april showers bring may..
- rain
- (and 2 more)
-
It's about time to call it for the season. If anyone has any final seasonal snowfall totals for their area let me know either PM or tag me. I'll be putting together a final seasonal map over the next week. There were 3 light events since the last update on March 2nd (and possibly a couple very minor events that didn't require a map). If i don't hear from everyone who replied on March 2nd ill do my best to add them together. You can find all the snowfall maps for all the areas for the 25-26 season here.
-
January 25-26th, 2026 Final Storm Totals
The 4 Seasons replied to The 4 Seasons's topic in New England
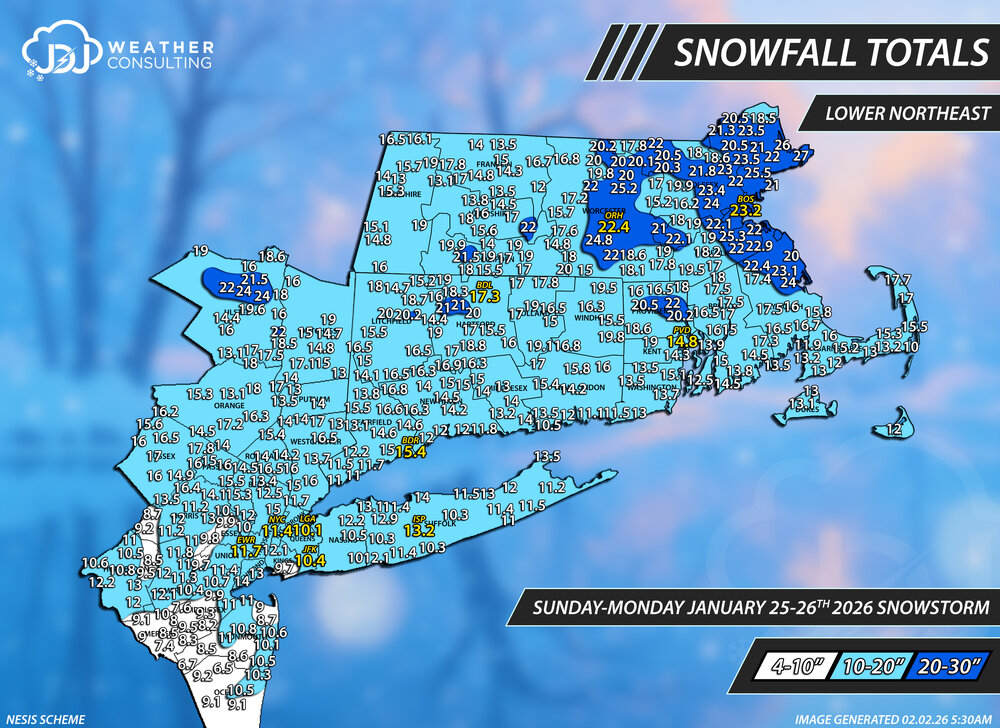
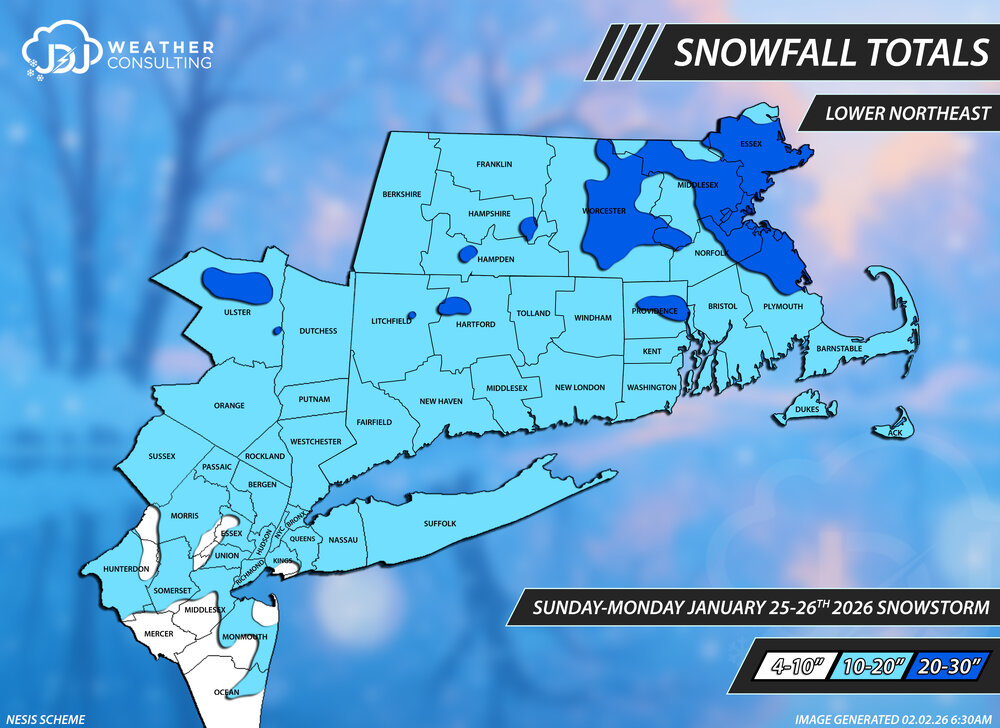
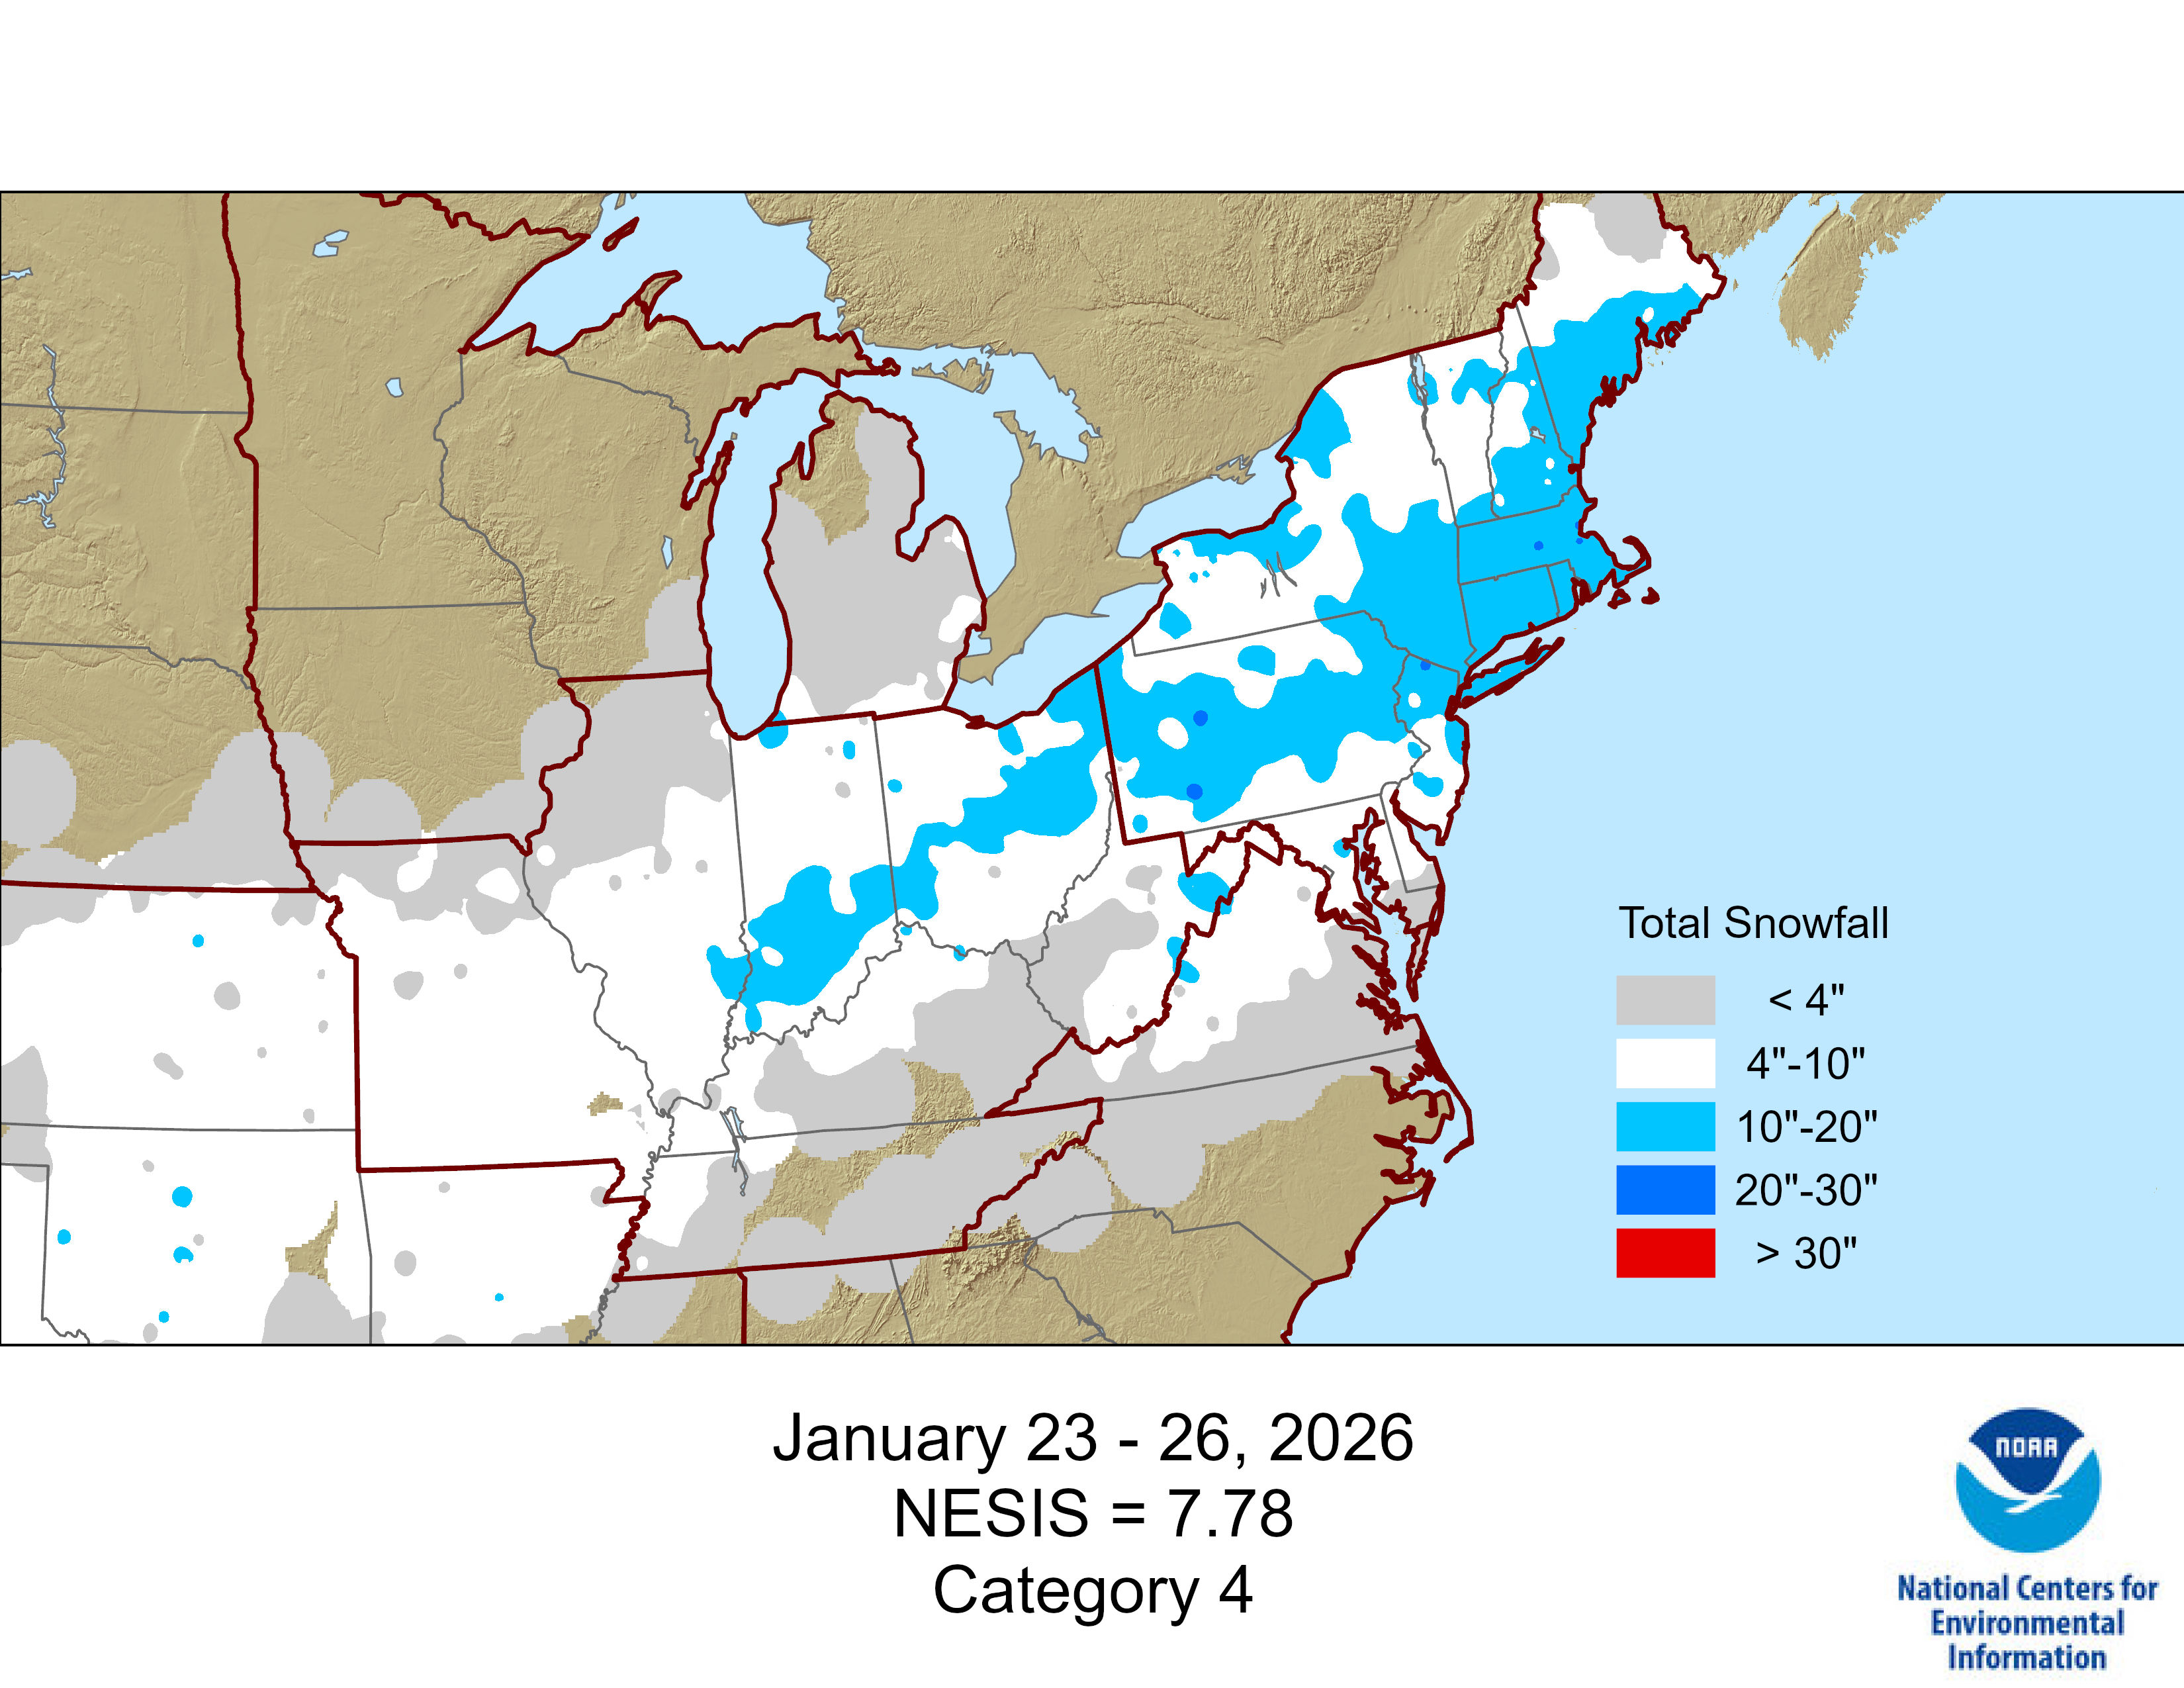
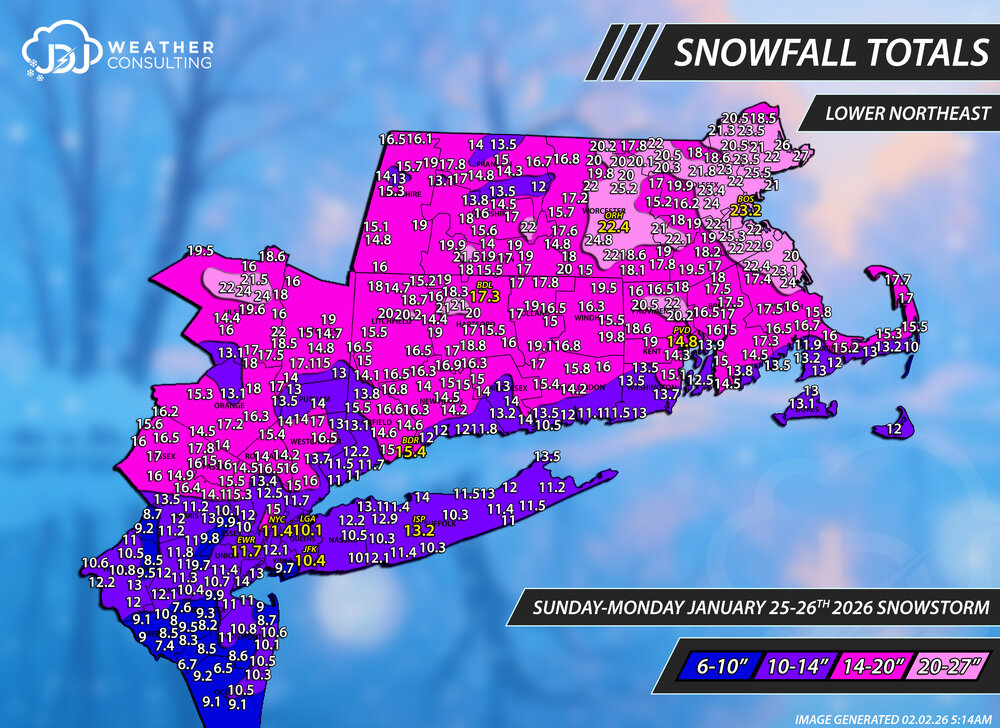
We finally have a NESIS map and ranking for this major storm. #5 all time on NESIS https://www.jdjweatherconsulting.com/jan-25-26-2026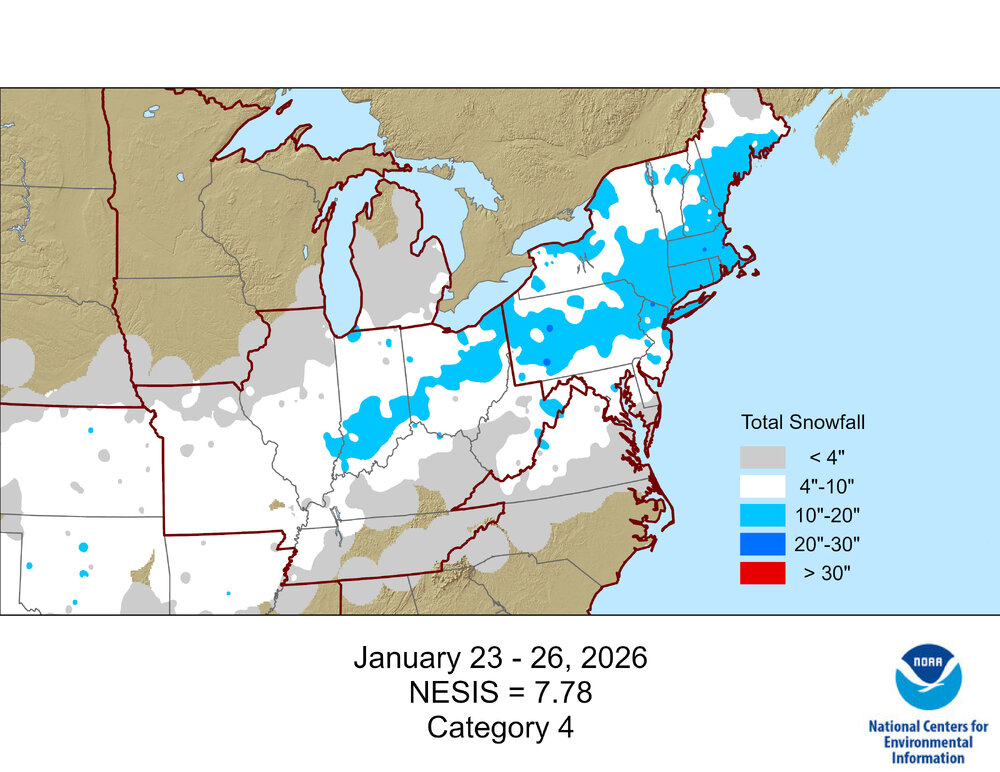
-
Finally! I knew it would likely be a 3, not surprised its actually a 4. That Dec 2022 is strange on that list but if you look at RSI for Northeast it's only a 1 and Mar 1960 is only a 3. https://www.ncei.noaa.gov/maps/rsi/ So weird it took so long and they got the Feb blizzard out in just a couple days. https://www.ncei.noaa.gov/access/monitoring/rsi/nesis No surprise its a bit conservative, especially in MA where there was a large area of 20+ from ORH to BOS. Here's one of the maps i did on top of the regular ones with NESIS color scheme and ranges. https://www.jdjweatherconsulting.com/jan-25-26-2026