The 4 Seasons
-
Posts
7,985 -
Joined
-
Last visited
Content Type
Profiles
Blogs
Forums
American Weather
Media Demo
Store
Gallery
Everything posted by The 4 Seasons
-
whereabouts, you dont have to give me your exact coordinates just north, south, central etc
-
I think coating-2 worked out fine for CT, most were in the C-1 range, but up to 2 covers the 1"+ amounts u have a season total
-
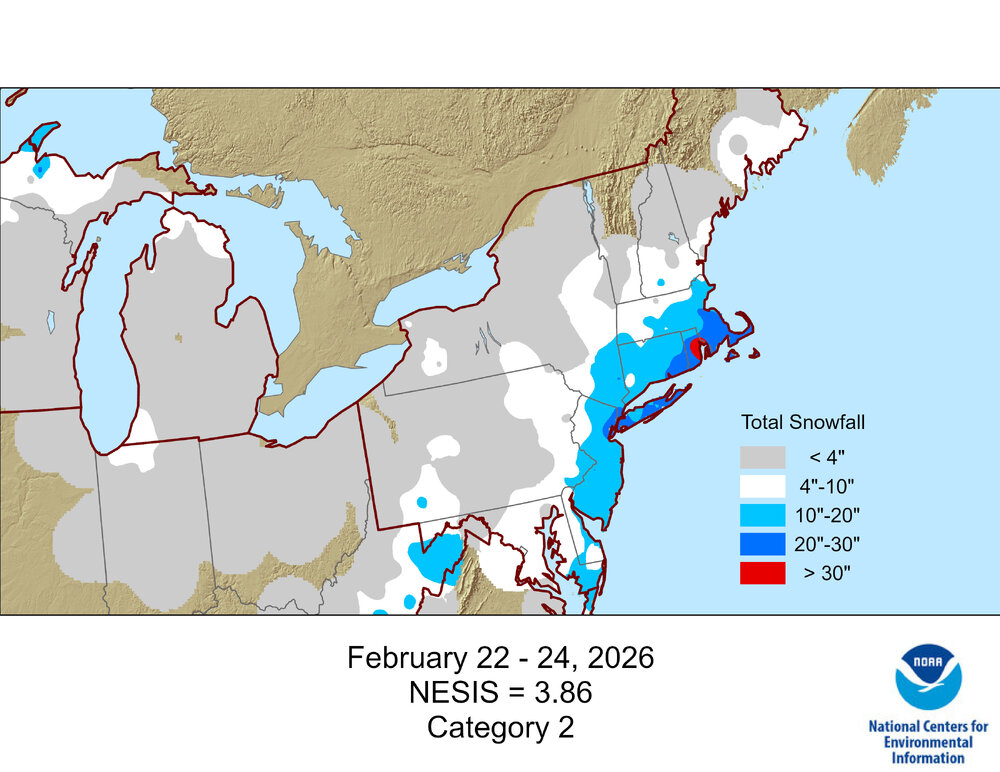
I don't doubt that at all. I plot and do all the contours by hand for every storm. I don't have software to feed in a bunch of data and auto generate a snowfall map from averaged/smoothed data. A lot of the NESIS maps are conservative and in some cases way too conservative like February 2013 where there is no 30"+ area over CT despite a very large area and many many reports of 30-40". @ORH_wxman can attest to that, we were talking about that a few weeks ago. That's just one example. So i knew the NESIS map would be a bit lower/conservative, every map is going to look a bit different. However even with that being said there are some glaringly obvious problems with the current storm. There is a small area of 4-10" near Danbury which i am certain was well over 10" being on the eastern edge of that deformation band. Most of the reports around there are 17-22" and on the low end 12-15" so there's no reason why a hole of sub 10" should be there. Just one example. The area of 20-30" should also be much wider over NJ west and south of NYC, even with smoothing considered, many reports of 20-30" in Monmouth and Ocean counties away from the immediate shore.
-
Hey everyone, i am putting out a call for season-to-date snowfall totals for anyone who has them, including anything that fell today, March 1st. You can DM me or tag me. I'll have that seasonal snowfall map out this week, thanks.
-
Hey everyone, i am putting out a call for season-to-date snowfall totals for anyone who has them, including anything that fell today, March 1st. You can DM me or tag me. I'll have that out this week, thanks.
-
If anyone has totals from this let me know for SNE I have a lot of maps and stuff to catch up on this week including Feb 20th, Feb 25th and Mar 1st and updating the archive Ill also be doing a season-to-date snowfall maps update for tri-state/SNE this week
-
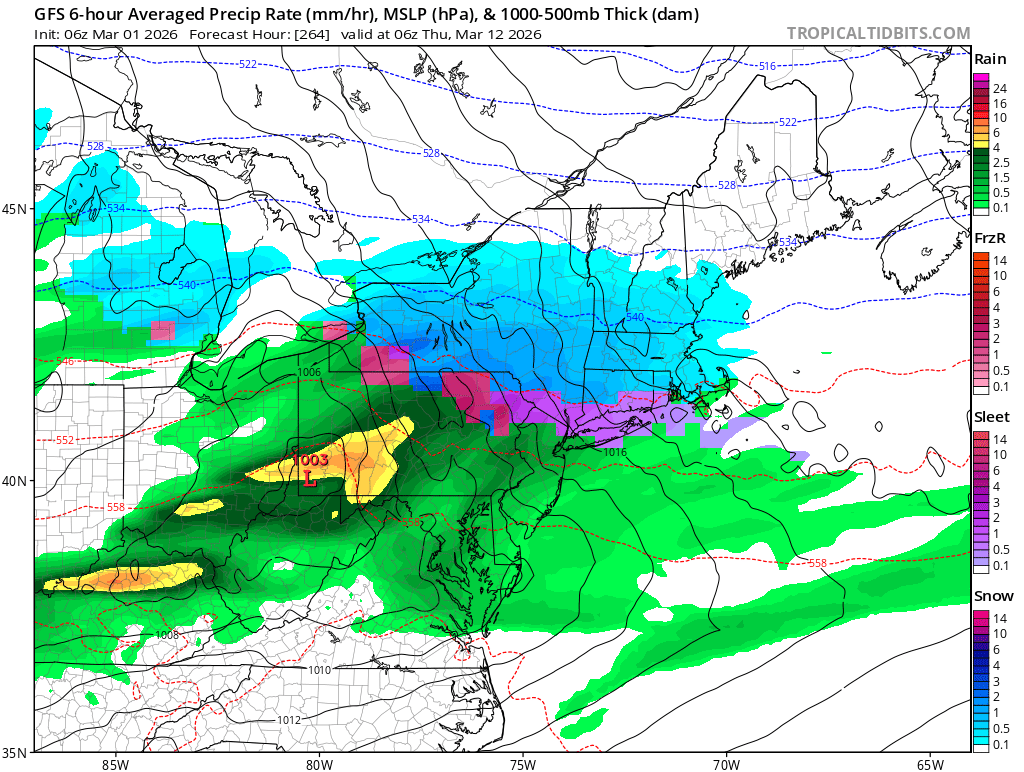
ill have all that up tomorrow with NE sfc map loop and radar loop, as well as a bunch of other images, satellite, H5, snowfall totals etc I'm working on a third, and hopefully final, update to the Blizzard snowfall maps
-
0.5 just what i expected Really gonna blow up
-
i thought the same thing to myself. Reminded me exactly of the way Jan 25-26th started, about the same time, first started off as small dense flakes, roads were cold so the first bit of accumulation started filling up the roads and wisping around not melting at all...then 20 min later the roads were just wet. Bout to come to an end here shortly.
-
interesting, couldnt be more shittier small dense flakes here
-
dense sugary snow, terrible growth but its coming down good. roads completely covered despite the temps around 33, low sun angle this morning and overnight temps in the upper 20s helped with that
-
youll get an inch at least im sure
-
excited for my 0.4
-
March in clown range will do that easily
-
Yep same exact time period, posting op runs 270hrs out just to troll, so I did the same.
-

-
-
Radar looks a lot more beefier and juiced than some of the hi res stuff at this time
-
18"
-
Yeah, one day cocorahs totals for one and that's not the half of it
-
Thanks, figured. Only reason I included it is because it's not that far off from the surrounding 18-19" reports. I'll be doing a third update tomorrow If you have any more you think are sus or missing lmk
-
Thanks. What's your thoughts on that 22.5 in S. Harvard?
-
More food for thought. If that area that was under those extremely heavy returns of 30-40dbz got say 16-24". Then what about all those reports in CT of 16-24" and in Middlesex and Worcester counties up to ORH? Thats basically saying all those reports are too high as well because those areas were well outside the main heavy banding and for far less time, even when they were. Looking back at that radar animation several times, there is no question to me that a large area of 24-40" fell especially when i go back and compare it to something like 2005 or 2015.
-
Gotcha yea there was a pretty extreme gradient from Windham to Tolland this storm there was 13-15s just to the north and west and 22s-27s to the east, so it looked reasonable to me. Impossible for me to know for sure so thats why its in there. And theres a ton of other variables like you said with wind, the way people measure, how often, etc And i see the same cocorahs reports over and over from each storm and Willington is one that never really felt off/slanted in previous storms so i always used them The more reports i get the better than i can cross check but there was like 6 in Tolland and maybe 6 or so in Windham, that were final anyways.
-
doesnt change anything but a deletion of a text box, which i can do Blue Hill seems right on the money for a change