chubbs
-
Posts
4,151 -
Joined
-
Last visited
Content Type
Profiles
Blogs
Forums
American Weather
Media Demo
Store
Gallery
Everything posted by chubbs
-
Chester County PA - Analytical Battle of Actual vs. Altered Climate Data
chubbs replied to ChescoWx's topic in Climate Change
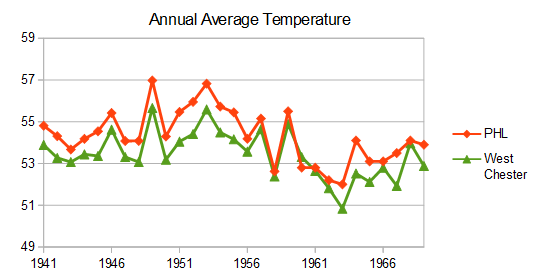
The big difference between the Phila Airport and the Chesco station average occurred in the 1945-1970 period. That's when the Chesco station average cooled significantly relative to other regional stations. Before 1945, Chesco COOPs were as warm as the Philly Airport or the Newark DE Ag station. By 1970, Chesco COOPS were as cool as Allentown. The cooling was mainly due to station moves: Coatesville 1946/47, Phoenixville 1948 and West Chester 1970. A reverse heat island effect for Coatesville and West Chester. Meanwhile the Phila Airport tracked other regional stations and West Chester before the 1970 West Chester move. The raw data is very clear. The Phila Airport is a much more consistent source of climate data than the Chesco COOPs. PHL's consistency advantage grows when non-COOP data is added making the Chesco data even more inconsistent.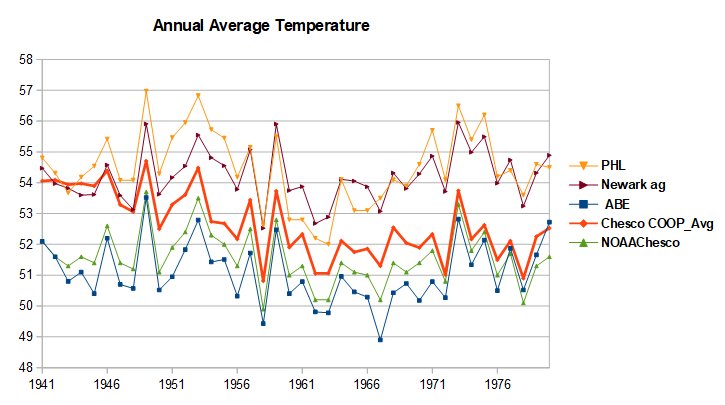
-
Chester County PA - Analytical Battle of Actual vs. Altered Climate Data
chubbs replied to ChescoWx's topic in Climate Change
I don't mind the network, but it is different from our COOP stations, particularly the older ones. Night and day different. By the way, regarding your post of a couple of days ago. Per the last few pages, there are quite a few local sites at 1F/decade in recent decades. Won't change what I wrote previously, but will keep an eye on it. -
Chester County PA - Analytical Battle of Actual vs. Altered Climate Data
chubbs replied to ChescoWx's topic in Climate Change
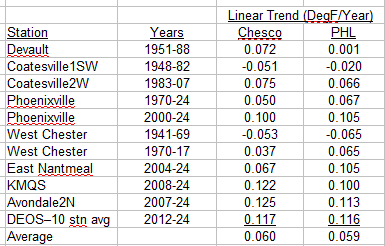
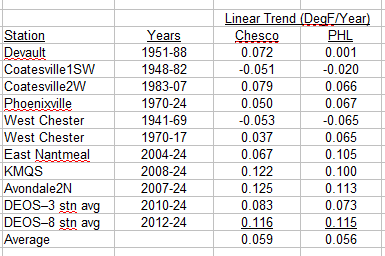
Meh. There isn't a big difference in the 2000-25 warming rate between Philadelphia and Phoenixville: 1.00 deg/decade for Phoenixville and 1.05 deg/decade for PHL. The difference is only 5% of the warming rate and is probably not statistically significant. I updated my table with the new Phoenixville and DEOS trends. No change in the main finding. Some plusses and minuses from station to station but on the whole the airport is warming at the same rate as Chesco stations.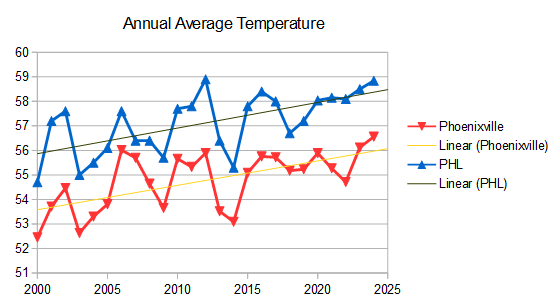
-
Chester County PA - Analytical Battle of Actual vs. Altered Climate Data
chubbs replied to ChescoWx's topic in Climate Change
Nice cherry pick among the DEOS. Per chart below, there is no difference warming between the 11 DEOS stations as a whole and the Philadelphia Airport. Some are warming faster than PHL and some slower. The warming rate for the DEOS stations in the 2012 and 2024 period, when all stations were active, is 1.17F per decade. The rate for the Philadelphia Airport is 1.15F/decade. Note that the airport had a warm sensor issue in 2022, which caused a one year spike in temperatures vs other regional station. That's not a heat island effect, since it disappeared in 2023. In any case the 11 DEOS stations and the Avondale USCRN station show conclusively that Chester County is warming rapidly in recent years, over 1F per decade. Can't blame it on heat island effects either. The stations are all remote.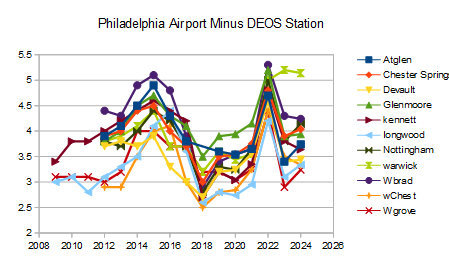
-
Chester County PA - Analytical Battle of Actual vs. Altered Climate Data
chubbs replied to ChescoWx's topic in Climate Change
That's what I had in my table. Phoenixville warming faster than PHL between 1970 and 2024. However per the table the following stations warmed faster than PHL: Devault (1951-88), Coatesville 2W (1983-07). West Chester (phl had more cooling, 1941-69), KMQS (2009-24), Avondale 2N (2007-24), and DEOS 3 stn (2010-24). As I said a mixed bag, but on average no difference.
-
Chester County PA - Analytical Battle of Actual vs. Altered Climate Data
chubbs replied to ChescoWx's topic in Climate Change
This looks OK. My Table had Enantmeal warming at a slower pace. Some stations are warming faster, like Avondale, some slower, like ENantmeal. Overall the warming is the same. -
Chester County PA - Analytical Battle of Actual vs. Altered Climate Data
chubbs replied to ChescoWx's topic in Climate Change
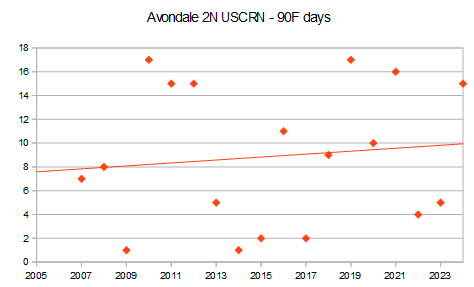
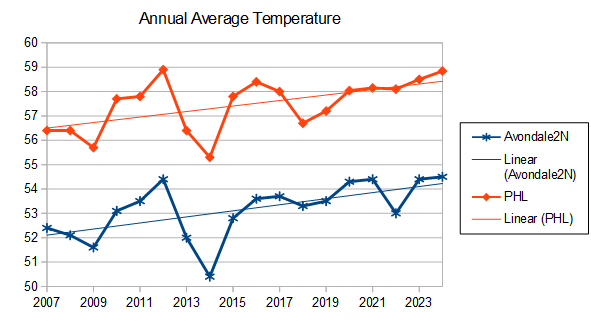
Not sure what you are plotting. The difference between PHl and Avondale in 2007 is 4.0, much larger than the value you have plotted. The difference between PHL and Avondale is nearly constant with time, with a slight decrease in the trend line. i.e. Avondale is warming slightly faster than PHL, though the difference may not be statistically significant. This agrees with the linear trend table I posted above and the chart showing Avondale and Philadelphia. You better check your math.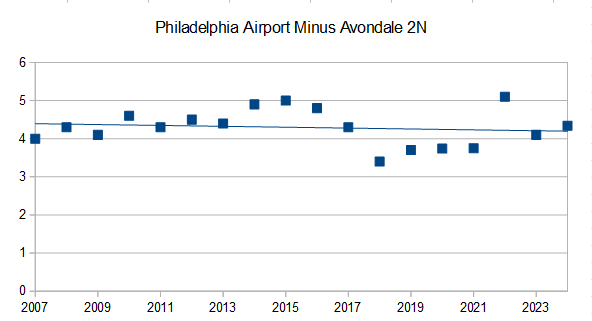
-
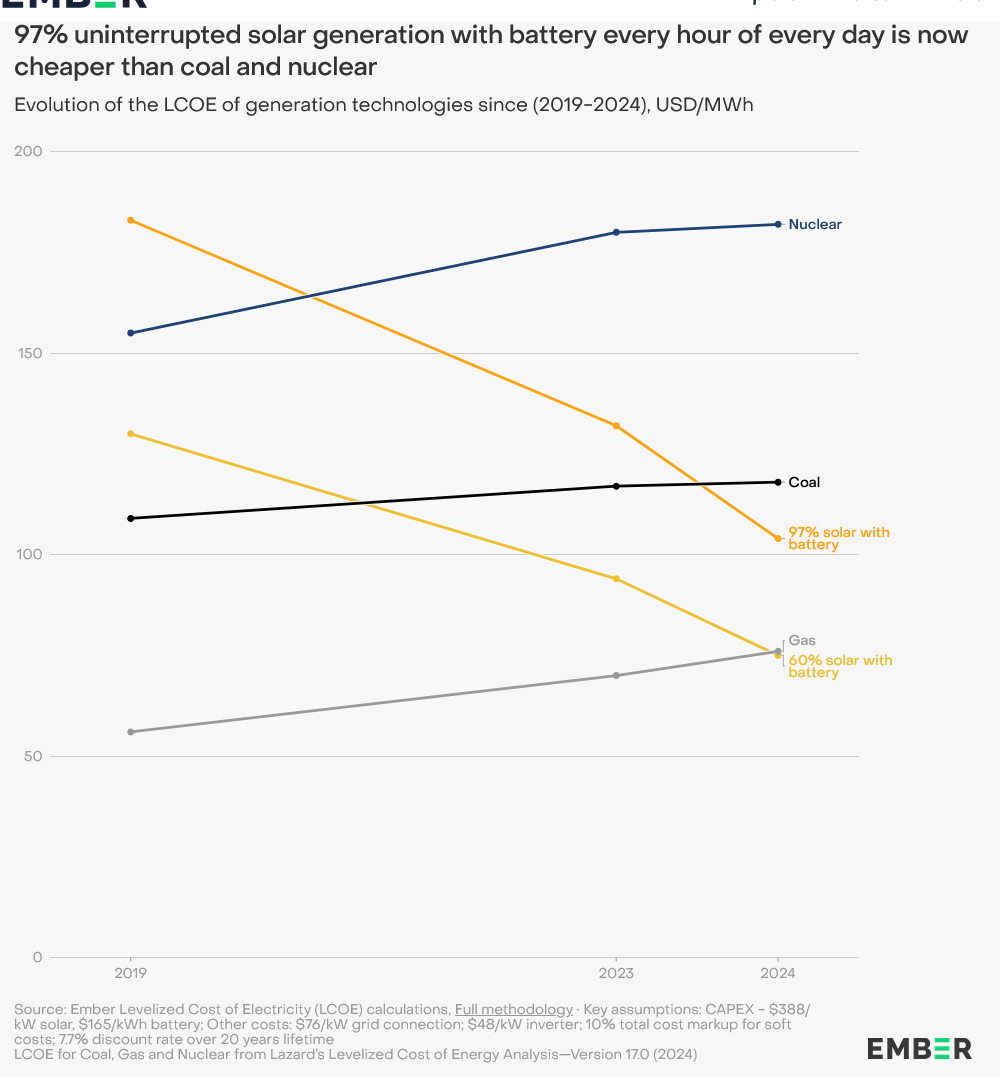
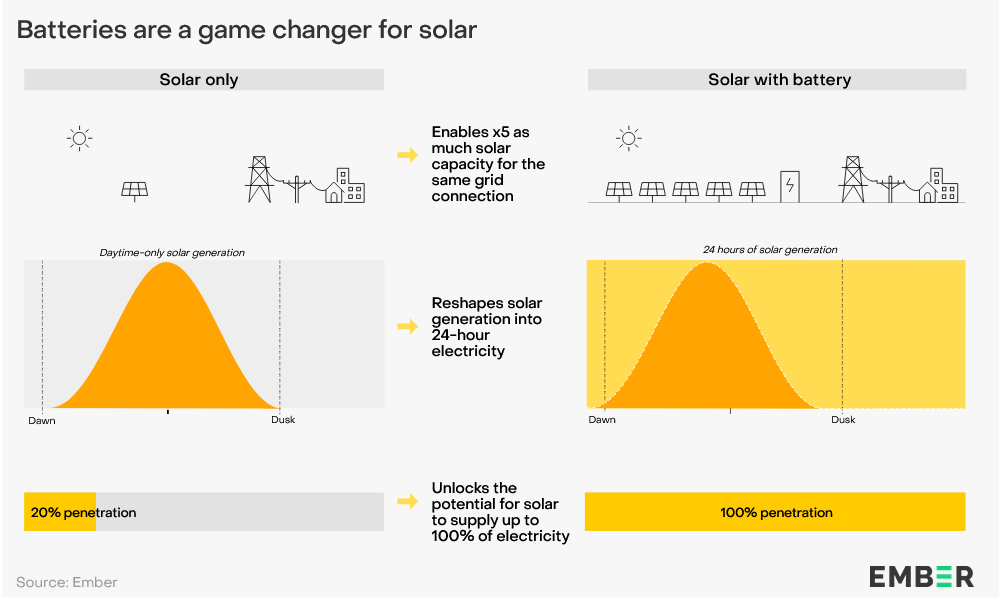
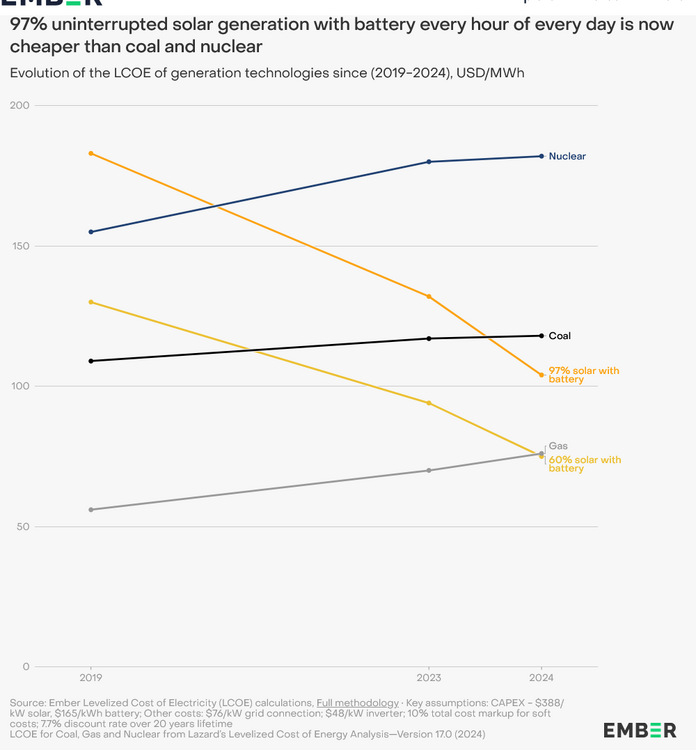
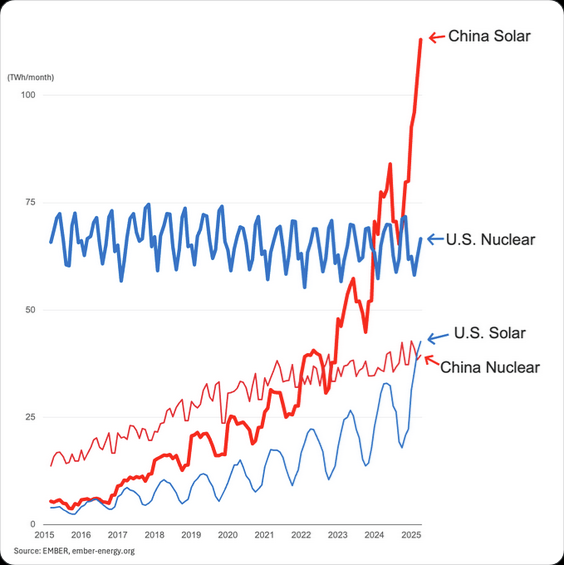
This is an interesting report. With the decrease in battery prices, 24-hour electricity from battery/solar is becoming cost effective in sunny locations. Projects are already being developed around the world and costs are only going to drop in the future. A game changer potentially. https://ember-energy.org/latest-insights/solar-electricity-every-hour-of-every-day-is-here-and-it-changes-everything/
-
Chester County PA - Analytical Battle of Actual vs. Altered Climate Data
chubbs replied to ChescoWx's topic in Climate Change
I was asking for a plot to back-up your cherry picking claim, individual stations that don't look like the Philadelphia Airport. Since you won't provide, I broke down and obtained the DEOS data, 11 stations. Guess what? DEOS looks just like the other data I looked at: Avondale, ENantmeal, KMQS and the Philadelphia Airport. Just as I thought it would. This region experiences the same weather. Unless there is a station change, all the stations move together. I separated the DEOS stations into 2 groups: 3 stations started in 2010 and 8 starting in 2012. Per the updated table, the station slopes for the 2 groups of DEOS stations are a close match to the Philadelphia airport, as close as any of the other stations in the table. Since your County Average has an increasing gap with the Philadelphia Airport, the county average doesn't match the individual Chesco stations. That's why I made the point above: the Philadelphia airport is a better match to the individual Chester County stations than your county average is. So what is the problem? Its not a heat island at the Philadelphia Airport. Its not cherry picking on my part. Has nothing to do with the raw data at all. Its your station averaging method. I've told you many times over the past 18 months: simple averaging of a changing network skews the result. The more the network changes with time, the bigger the skew vs station data. The other problem is cooling station moves at the Chesco Coops: Coatesville 1946/47, Phoenixville 1948, and West Chester 1970. That's why your results don't match the raw data. Very easy to check if I am right or not, just plot a few stations against your "Chesco County Avg".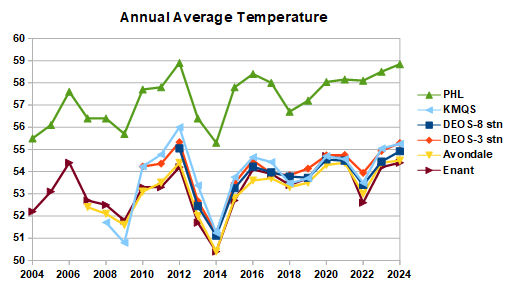
-
Chester County PA - Analytical Battle of Actual vs. Altered Climate Data
chubbs replied to ChescoWx's topic in Climate Change
OK, so you are saying the other stations (mainly DEOS that I don't have) don't agree with the Avondale USCRN station (or KMQS and ENantmeal)? That would be very odd considering the good agreement between the 3 stations (4 including the airport) and the high quality of the USCRN station with 3 thermometers in place. You'll have to show me that in a plot, because I don't believe you. No averaging either to hide the details, single station data only. -
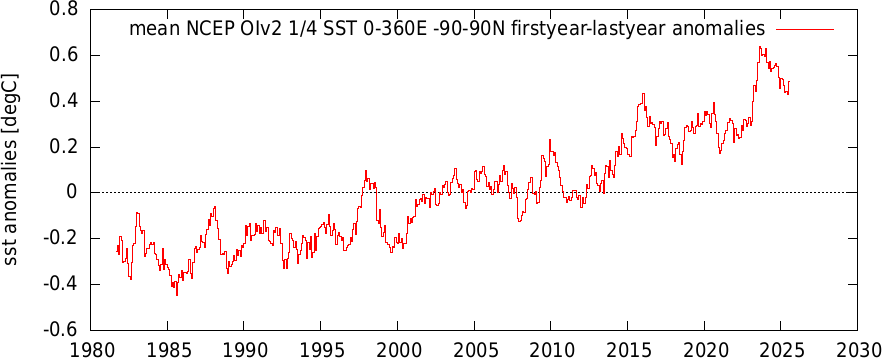
JB is right, July is tracking 0.23C cooler than last year on ERA re-analysis, a decline very similar to June. For the year-to-date, 2025 is running 0.11C cooler than last years record. A fairly typical enso-related decrease. Below is satellite SST including July. Showing how this nino compares to others. The biggest difference is the rapid spike upwards.
-
Chester County PA - Analytical Battle of Actual vs. Altered Climate Data
chubbs replied to ChescoWx's topic in Climate Change
Wow. You don't recognize raw data when you see it. Let me repeat, the table below is based on RAW data, no adjustments. For every Chesco station, the raw data was used to calculate the linear regression slope. The Philadelphia airport slope is taken for the same years as the Chesco station: 2007-24 for Avondale, 2004-24 for East Nantmeal, etc. An apples-to-apples comparison of raw data: Chesco vs Philly Airport. I added West Chester from 1941 to 1969 to the table, avoiding the big West Chester station move in 1970. Also added a chart showing how the year-to-year raw Chesco data matches PHL. The results couldn't be clearer. From 1941 to 2024, airport is a better match to raw data from individual Chesco stations than you are. If you don't think so present a similar comparison. Without station moves of course. Likewise the 90F day data I posted in the table above is raw data, your own numbers mainly. The newer DEOS stations have fewer 90F days than our historic COOPs. Not surprising since the DEOS stations are in cooler locations than COOPs. As I showed with Phoenixville, West Chester and Avondale, you aren't matching the raw 90F day data from individual stations, not even close.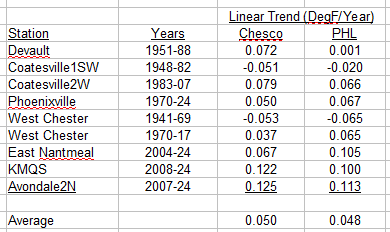
-
Chester County PA - Analytical Battle of Actual vs. Altered Climate Data
chubbs replied to ChescoWx's topic in Climate Change
Nope. No one measures the temperature of Chester County and there is no "actual factual raw data" for Chester County in your chart. Your line is a calculated value and you are making a rookie mistake which distorts the raw data. As I have mentioned before, taking the simple average of changing station network skews the trend. If you have cooler stations at the end vs the beginning you will combine the network and weather changes and bias the results. Easy to demonstrate using the 90F data for Chesco stations that you posted recently. The table below sorts the Chesco stations you are using from high to low 90F days. For stations with a long record only the last 30 years of 90F data are used for a btter comparison to the current stations. Due to location, the older stations tend to be at the top of the 90F list and the newest stations at the bottom. The 90F day plot that you posted recently is skewed by the change in the station network from 1950 to today. That's why your chart doesn't match the raw 90F data from Phoenixville, West Chester or Avondale, which all show an increasing in 90F days, not a decreasing trend. Your 90F result is determined by the stations you have selected not our weather. Same thing happens with temperature. Your county estimate is biased and the bias increases the further back you go as the county network becomes warmer and warmer relative to today's network. The 1940s network is completely different than the one you have put together for today.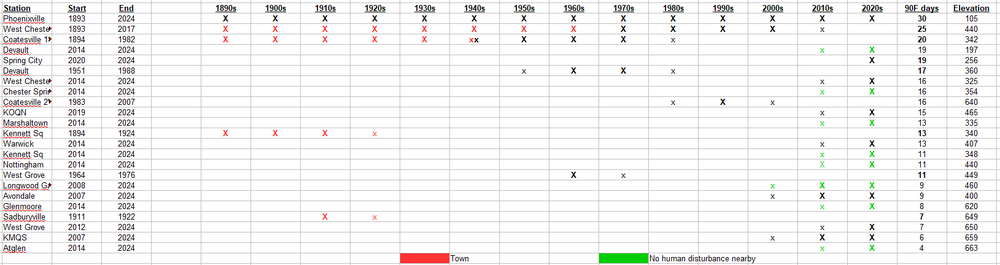
-
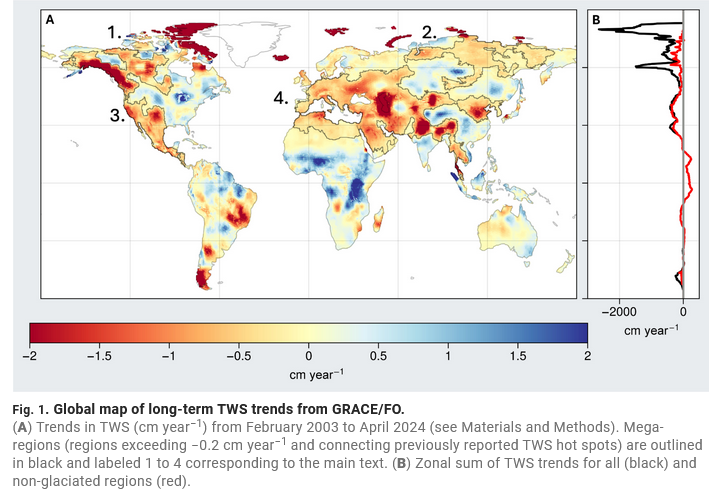
Abstract Changes in terrestrial water storage (TWS) are a critical indicator of freshwater availability. We use NASA GRACE/GRACE-FO data to show that the continents have undergone unprecedented TWS loss since 2002. Areas experiencing drying increased by twice the size of California annually, creating “mega-drying” regions across the Northern Hemisphere. While most of the world’s dry/wet areas continue to get drier/wetter, dry areas are now drying faster than wet areas are wetting. Changes in TWS are driven by high-latitude water losses, intense Central American/European droughts, and groundwater depletion, which accounts for 68% of TWS loss over non-glaciated continental regions. https://www.science.org/doi/10.1126/sciadv.adx0298
-
Looks good. 2012 pulled away for good in early August, when a unusually strong storm broke up the weakened ice pack and promoted mixing of warmer water from below.
-
Chester County PA - Analytical Battle of Actual vs. Altered Climate Data
chubbs replied to ChescoWx's topic in Climate Change
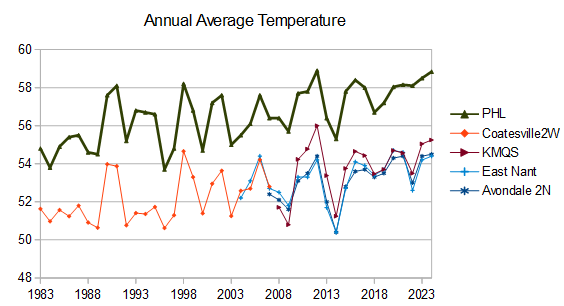
Very easy to check if the Philadelphia Airport is experiencing a worsening urban heat island. Compare it to nearby rural sites without station moves or other changes.. Below is a comparison to the Chesco sites that I have data for. There is no noticeable difference in the warming at these rural Chesco sites and the Philadelphia Airport. Yes the airport is in an urban heat island, but the heat island doesn't change much from year-to-year, or decade-to-decade. No need to hand-wave, guess, or cherry pick, the Chesco and PHL raw data provides the answer. Like I said above the Philly airport does a much better job of matching warming in Chesco station data than you do. Why?? PHL is more consistent from year-to-year and decade-to-decade. Your network of stations changes dramatically with time, with a large reverse heat-island effect. Surprised a heat island expert like yourself can't see the difference between Coatesville City/West Chester Boro and Atglen, Warwick, Avondale 2N, etc.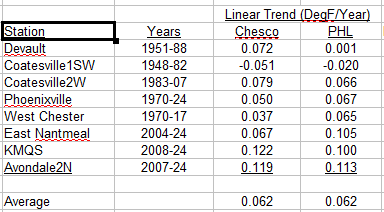
-
Chester County PA - Analytical Battle of Actual vs. Altered Climate Data
chubbs replied to ChescoWx's topic in Climate Change
Can we say UHI contamination? Yes we can. In your own Chesco analysis. Well documented in the previous 8 pages. Your network changes from town to predominantly rural and you don't remove the station changes. You have Chester County as warm as the Philadelphia airport (PHL) in the early 1940s. How ridiculous is that. When you compare the Philadelphia airport to Chesco stations with a consistent set of measurement conditions, the Chesco stations and the airport both show significant warming. Since 1948, Coatesville has warmed by 3.8F vs 4.8F at the Philadelphia airport. Since 2007 both the Avondale USCRN station and the airport have warmed by over 1F per decade. The charts below show that the Philadelphia airport does a much better job of matching individual Chesco station data than you do.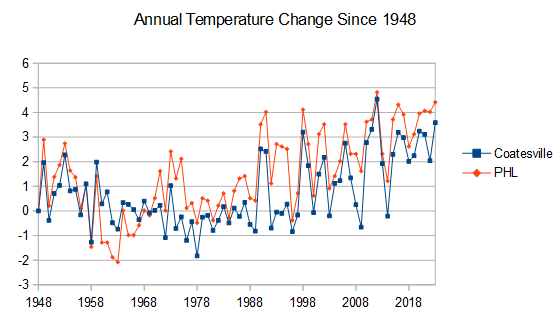
-
I voted warming. You didn't specify the baseline. I answered using today as the baseline with roughly 1.5C warming since 1800. Further warming from here is going to put the climate system way out of equilibrium, tiggering rapid change that would be very difficult to adapt to. Its like pushing a glass of water across the table, the rate of change is tolerable until the edge is reached. Same with climate tipping points: ice sheets, forests, glaciers, permafrost, ocean circulation etc. If you had used pre-industrial as a baseline, I would have picked cooling, but neither option is attractive.
-
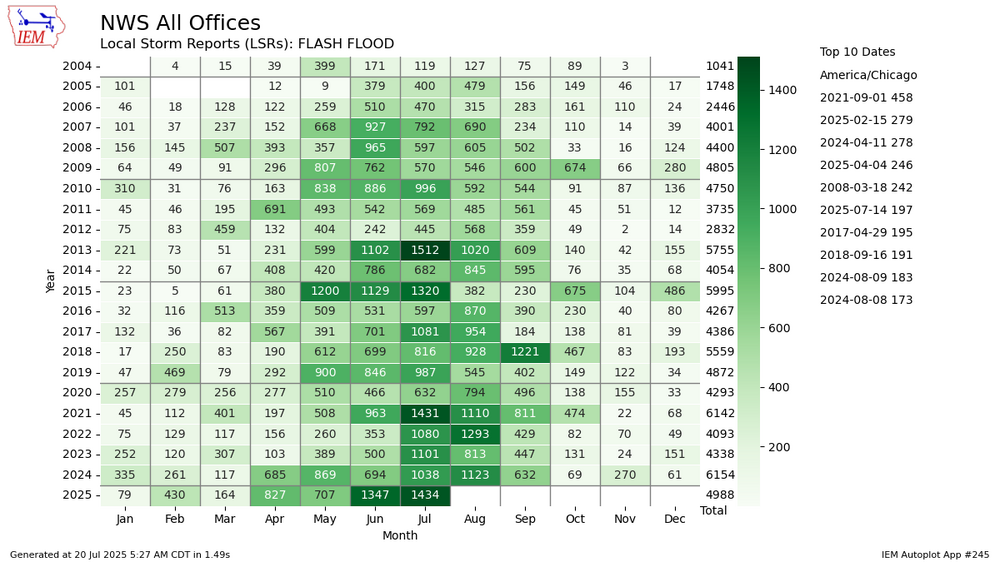
Good comment. Below are flash flood local storm reports (LSR) in the same format. Can only go back to 2004. With reports there may also be non-weather/climate factors that change with time. In any case, this year on a record pace, with February, April and June setting monthly records and July also on a record setting pace.
-
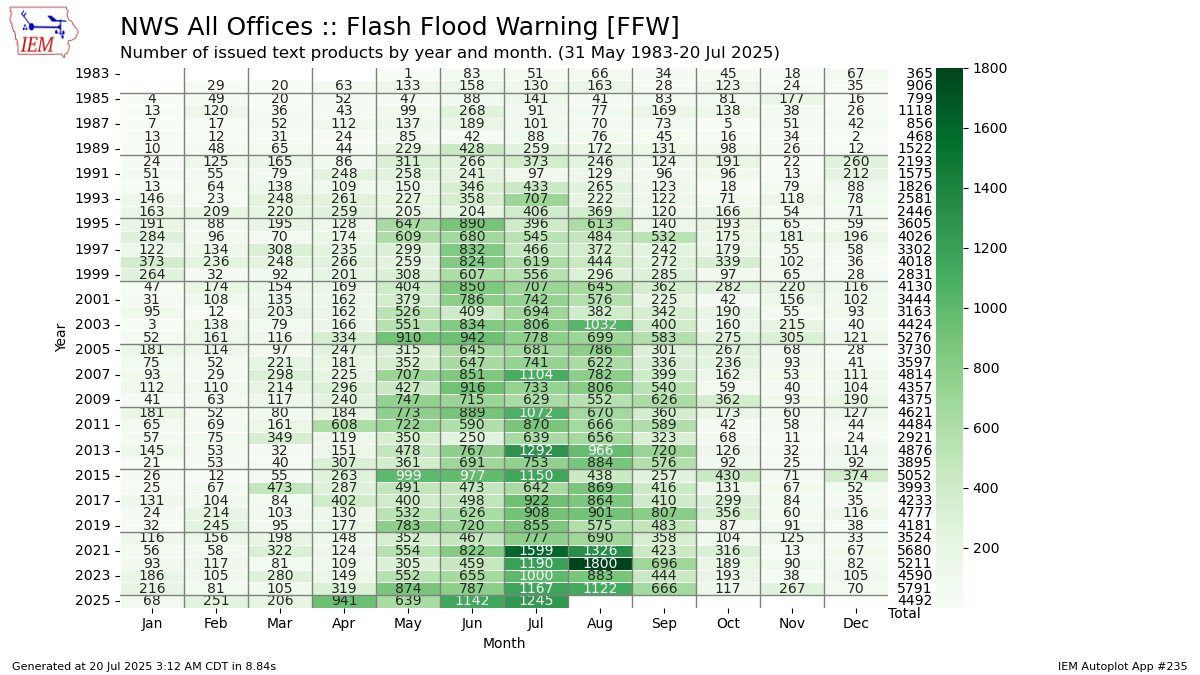
Flash flood warnings are on a record pace this year. Also trending higher with time.

-
Like I said we all have our own perspective. Agree that Michsnow is not Chesco. I try to keep things factual. sorry that you are bothered. Like I said I don't see much evidence for differential winter warming. Happy to consider data showing otherwise.
-
We each have our different perspectives. If you look at Don's charts and compare today vs 100 years ago, there has been 4-5F warming in both the warmest and coldest days; but, the 100-year path is different. The warmest 1% have had fairly steady warming but the coldest days have been a roller coaster. Despite the roller coaster, the coldest days are still warmer vs 100 years ago. What Don's analysis indicates to me is that we have to be careful in picking our start and end dates when looking at winter cold extremes. Metro and City airport have a long overlap period. During that period Metro is roughly 2F colder than the City airport so any analysis that starts with the city airport and ends with Metro will be contain both a station shift and a weather trend. If you don't account for the station change you won't get the correct weather trend. I would need to see more data to be convinced that the midwest winters are warming at a slower rate. I haven't seen that in any study or apples-to-apples data comparison. The only geographic trend I am aware of is somewhat faster warming further north. Canada is warming faster than the US for instance. Found one study when googling midwest winters, which looked at midwest winter storm tracks between 1959 and 2021. The findings aren't surprising. The midwest winter storm track has shifted north and the midwest is getting wetter and warmer storms. Could help explain why some midwest stations are getting more snow. https://agupubs.onlinelibrary.wiley.com/doi/epdf/10.1029/2024GL109890
-
If you want to look at long-term trends, Its important to separate station changes from weather changes. The city to airport transition in Detroit introduces a bias. The City airport is warmer than Metro, particularly for low temperatures. I've looked at Ann Arbor, Pontiac, Detroit City and Detroit metro. Pontiac and Ann Arbor both go back 100+ years. I see a warming of winter extreme temps at each site. Less at the city airport and most at Pontiac. Note that I showed data for daytime highs, because low temperatures are more likely to be impacted by heat island and other local site radiating conditions. One final comment. Decade data can be misleading because 2010-2019 gives a different answer than 2015-24. In the case of extreme winter weather the difference in 10-year snapshots is amplified by large natural variability. We are still going to get cold shots and no question the 2010s had an unusual concentration. Don't see evidence though that Detroit is getting the same degree of extreme cold that it did in the past.
-
If your goal is energy abundance nothing can scale like solar. Not even close. Our solar resource (sunshine) is much better than China's.
-
Chester County PA - Analytical Battle of Actual vs. Altered Climate Data
chubbs replied to ChescoWx's topic in Climate Change
The Avondale USCRN station which started in 2007 shows a slight upward trend. KMQS starting in 2008 is also increasing slowly. Given the noise in the 90F data these short-term trends may not be significant. Most of the other stations that are collecting data today started in 2012 or later, not 2010. Starting a 90F trendline in hot year like 2010 is misleading. Bottom-line - Considering how noisy the 90F data is there isn't much evidence that the long-term increasing trend established by Phoenixville and West Chester has changed.