chubbs
-
Posts
4,167 -
Joined
-
Last visited
Content Type
Profiles
Blogs
Forums
American Weather
Media Demo
Store
Gallery
Everything posted by chubbs
-
I don't think the problem is technology. Solar has outperformed expectations for decades. Same for batteries. China has shown that solar can be deployed much faster than any competing energy technology. We could easily match as our solar resource is better than China's. No its the power of the incumbent, misinformation/denial, lack of vision, and geopolitics and others, that are allowing fossil-fuels to linger. https://x.com/JessePeltan/status/1988427201772245459
-
Yes, China's nuclear generation is increasing rapidly. They are also adding large amounts of hydro and wind. However their biggest source of their new non-fossil power is solar. The solar they are installing this year is roughly equivalent to the entire US nuclear fleet.

-
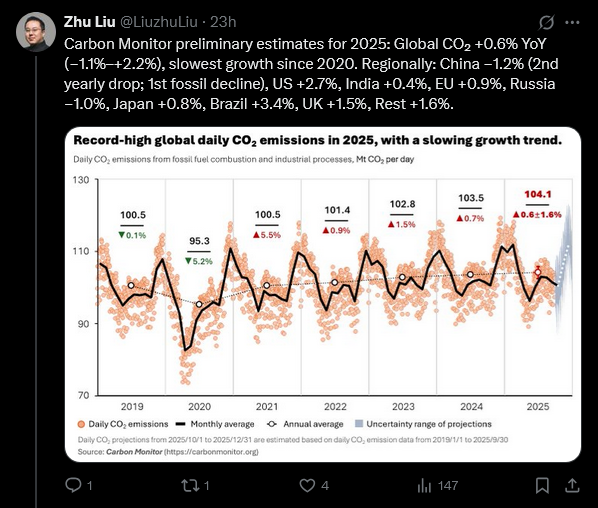
Preliminary data for this year, shows global CO2 emissions continue to plateau as clean energy technologies take most of the growth in global energy demand. However to solve climate change, need to see a drop in CO2 emissions, the faster the better. In other words progress on clean energy isn't fast enough as fossil incumbents resist change. This years data also shows a reversal in the CO2 growth trajectories of the two biggest emitters, US and China. China is embracing clean energy technologies while the US doubles down on fossil fuels.
-
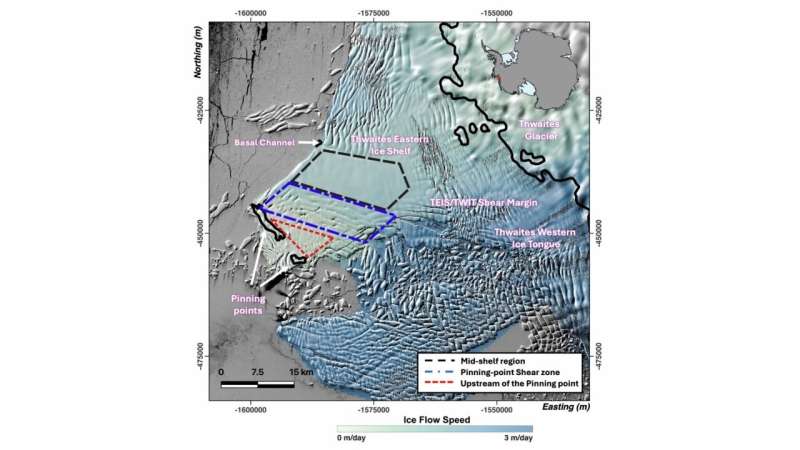
Yes, there are a couple of underwater hills that pin the tip of the ice shelf in place (see chart) Per the article, the pinning points have transitioned from a stabilizing to a de-stabilizing force over the past 20 years.
-
New paper on the de-stabilization of the Thwaites ice shelf over the past 20 years. Video, linked below, provides a good overview of the changes to the ice shelf over the past 10 years. Other papers have projected the ice shelf's complete collapse by 2030. https://agupubs.onlinelibrary.wiley.com/doi/10.1029/2025JF008352 https://phys.org/news/2025-11-antarctic-doomsday-glacier-ice-shelf.html 10-year video https://scx2.b-cdn.net/gfx/video/2025/cracking-the-code-of-t.mp4
-
This board has taught me never to underestimate the power of confirmation bias.
-
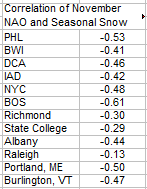
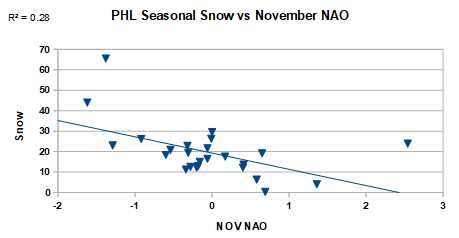
The recent flip to NAO- in modeling is positive for this winters snowfall in the northeast. Below is the correlation of November NAO with total winter snow for the La Ninas since 1950. During La Nina, there's a negative correlation of November NAO with total winter snow in the northeast; i.e, negative Nov NAO tends to produce more snow. Also included a plot for Philly to illustrate.
-
Chester County PA - Analytical Battle of Actual vs. Altered Climate Data
chubbs replied to ChescoWx's topic in Climate Change
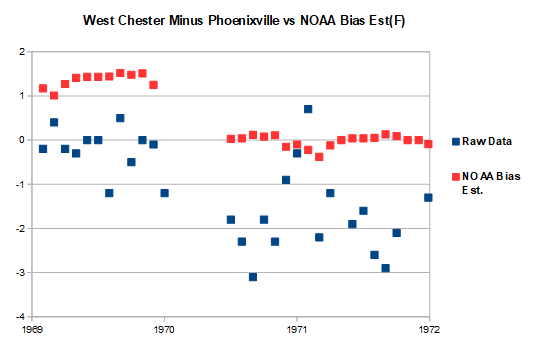
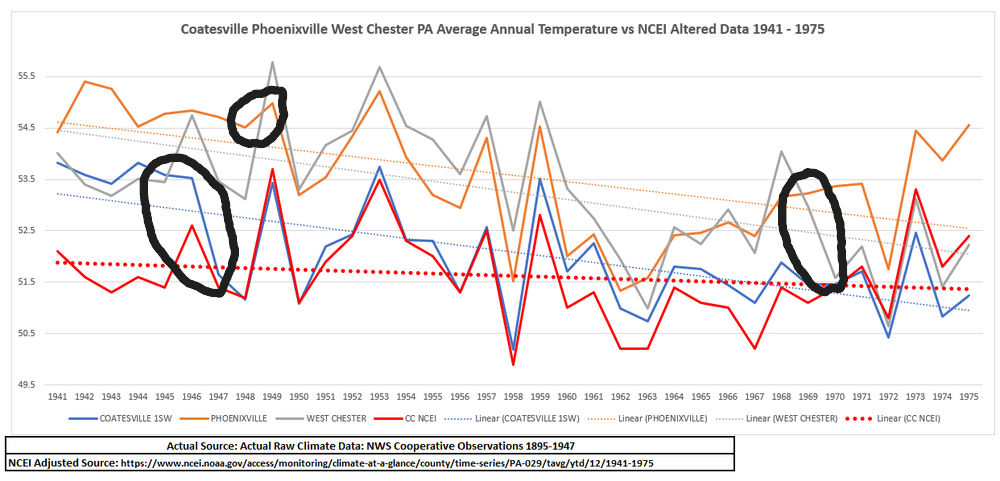
The Chester County COOP stations have had numerous moves and station changes over the years. Fortunately, the changes are easy to spot by comparing against other COOP stations. The 1970 West Chester move is a good example. The top plot shows the monthly temperature difference between West Chester and Coatesville. Before the move, West Chester was roughly 1.5F warmer than Coatesville. When the station re-opened in May 1970 after the move, West Chester was roughly the same temperature as Coatesville. The difference between West Chester and Phoenixville changed in exactly the same way as a result of the move (second plot). Before the move, West Chester and Phoenixville had similar temperatures. After the move West Chester was cooler than Phoenixville. The cooling nature of the move is easily spotted by inter-comparing the three stations. West Chester experienced a permanent change in temperature that wasn't weather related. The NOAA bias adjustment captures the West Chester move perfectly. Before 1970, the West Chester data is biased warm because the data was collected at a warmer site. This simple example shows how NOAA uses science to get the correct information from the raw data, what the raw data really saw about our climate. Bias adjustment is critical in Chester County because all the Chesco stations operating in 1945 experienced cooling moves between 1946 and 1970: Coatesville in 1946 and 1948, Phoenixville in 1949 and West Chester in 1970. You won't get the right answer in Chester County without bias adjustment.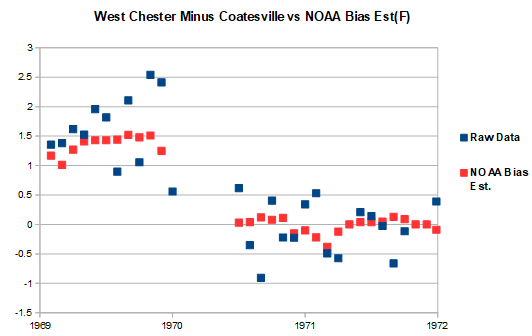
-
Article on disaster recovery industry in the US, not the growth industry that we want. No paywall. https://www.bloomberg.com/features/2025-disaster-industrial-complex-us-economy/?accessToken=eyJhbGciOiJIUzI1NiIsInR5cCI6IkpXVCJ9.eyJzb3VyY2UiOiJTdWJzY3JpYmVyR2lmdGVkQXJ0aWNsZSIsImlhdCI6MTc2MTUyMDQyNywiZXhwIjoxNzYyMTI1MjI3LCJhcnRpY2xlSWQiOiJUNEkyRTBHUFdDSUowMCIsImJjb25uZWN0SWQiOiJEQ0NGODY3Qzk2ODk0MzJDQjRBMEMwM0FENDNGNTJENyJ9.6iPDZtLjiXpOkigBvxm123_KbyMeWuSopTRZeGoG36E&leadSource=uverify wall

-
Correlation of extreme hurricanes, AGW, and solar cycles
chubbs replied to WolfStock1's topic in Climate Change
Here's a 1987 start.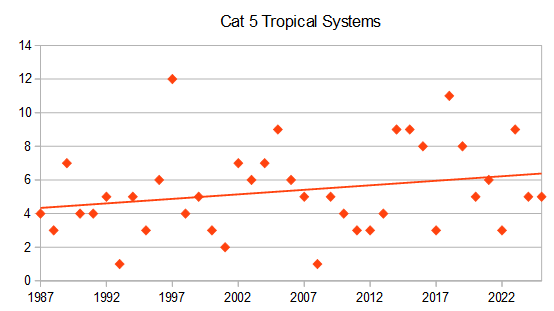
-
China, India and Indonesia are shifting increasingly to solar and other renewables which should peak their CO2 emissions by 2030. These countries are the largest growth market for coal since the Paris Agreement. https://bsky.app/profile/creacleanair.bsky.social/post/3m46yyz2dor2a
-
Correlation of extreme hurricanes, AGW, and solar cycles
chubbs replied to WolfStock1's topic in Climate Change
Global Cat 5 in satellite era of good detection. ( Jeff Master's blog article on Melissa) https://yaleclimateconnections.org/2025/10/jamaica-braces-for-cat-5-hurricane-melissa-earths-strongest-storm-of-2025/ -
Here are a couple of blog articles with links to scientific assessments on the volcano and an explanation for why the impact is small. https://www.theclimatebrink.com/p/the-climate-impact-of-the-hunga-tonga https://www.theclimatebrink.com/p/the-real-lesson-of-the-hunga-tonga
-
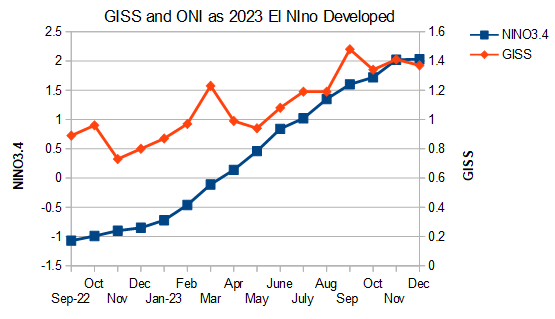
Below are monthly NINO3.4 and GISS stating in October 2022 and running through 2023. I don't see anything here to indicate that el nino wasn't the trigger. NINO3.4 started rising rapidly early in 2023 and GISS followed with a slight lag. The nino doesn't explain monthly spikes in March and September; but, Hungo Tonga doesn't explain the monthly spikes either as the eruption occurred in 2022.
-
Per link below the 2023 warming has been attributed to El Nino. The article does say that the warming came on more suddenly and lasted longer than a typical nino. But that is probably due the increasingly positive radiation balance due to cloud feedback and air pollution control. I haven't seen the Hunga Tonga volcano linked to significant warming in a scientific paper. https://www.science.org/doi/10.1126/science.adt7207
-
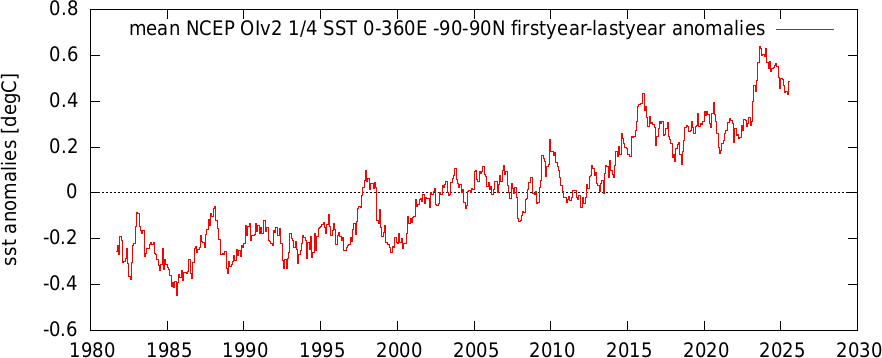
Satellite SST estimates show that the 23/24 nino cycle had a similar warming effect on global SST as the 2015/16 nino. Together these two nino's have triggered roughly 0.4C of global SST warming.
-
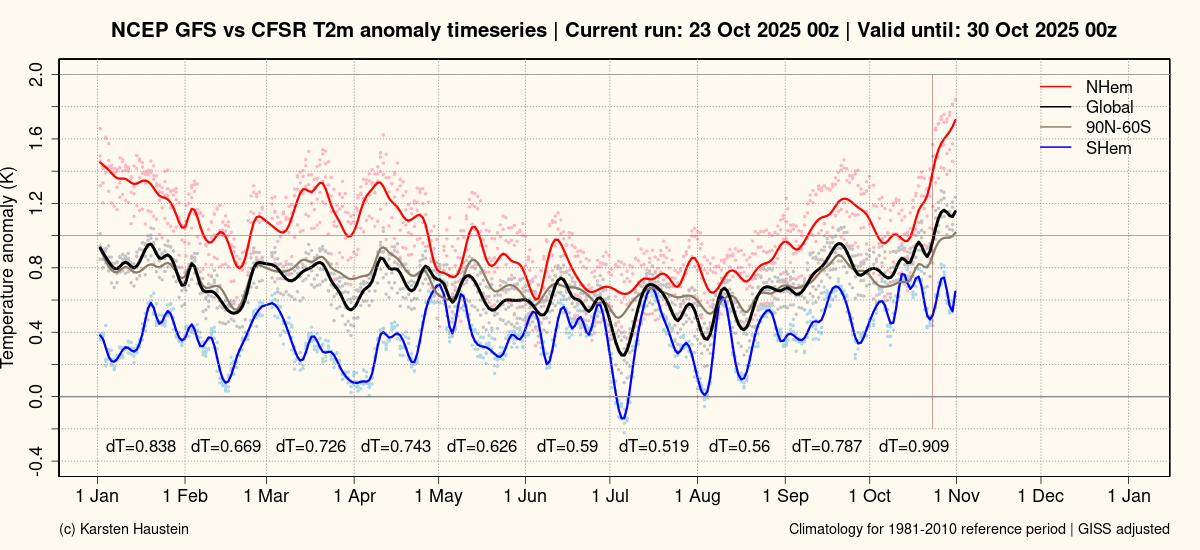
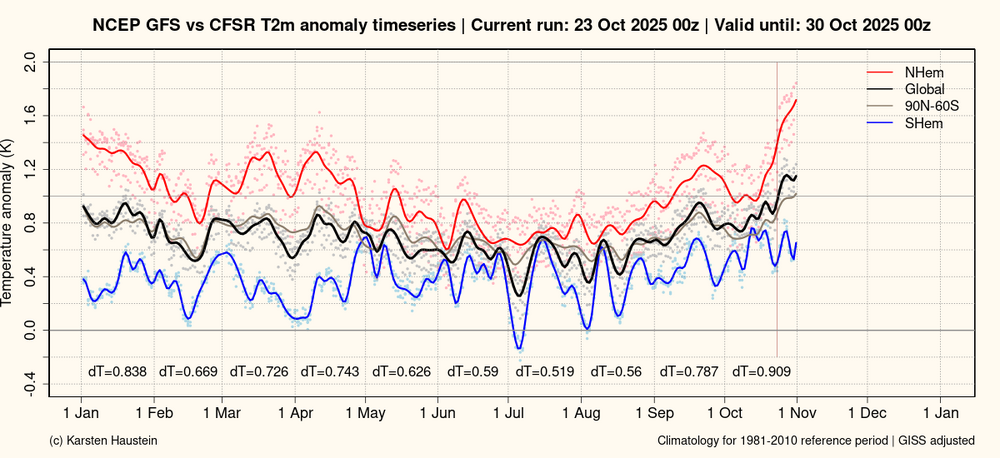
Per gfs, the end of October is going to be warm. The highest global anomalies so far this year.
-
A bit of a hyprocrite aren't you? You are cluttering up this thread with Chester County charts. Are you saying that your arguments are poorly constructed because the Chester County data is independent of the rest of the world? You can't have your cake and eat it too. If Chester County is relevant to the rest of the world; Philadelphia, Allentown and Newark Ag station are relevant to Chester County. In any case the science is clear on this point, weather data is correlated for hundreds of miles. Chester County doesn't cool when the surrounding stations don't. In fact, as I showed in the Chester County thread, there is a very good match in the warming rate at the airport and individual Chesco stations. Finally we don't need any data outside of Chester County to know that Coatesville cooled significantly after the war. The tables posted above show that Coatesville cooled relative to Phoenixville and West Chester after 1945 and Phoenixville cooled relative to West Chester and Coatesville between 1948 and 1949. The data from outside Chester County merely confirms what the Chester County data is already showing.
-
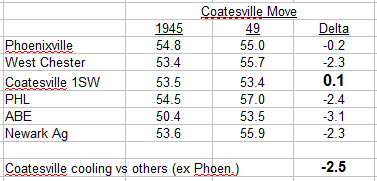
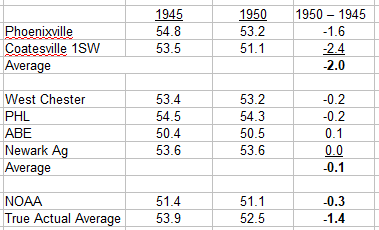
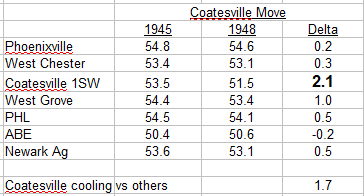
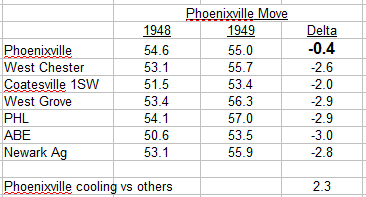
The mistake you are making, is thinking that the move date is important. Coatesville cooled by roughly 2F relative to the other local stations after World War II, indicating a major station change. I substituted 1949 for 1948 in the Coatesville move table. The change increased the move-related cooling at Coatesville to 2.5F. The Coatesville move is complex: a big move in 1946 and a smaller one in early 1948. You only see a small part of the move by comparing 1948 to 1949. Note that Phoenixville also moved to a cooler location in 1949. So can't be used to estimate Coatesville station changes between 1945 and 1949. Since you have provided your “True Actual Average “ for the 1945 to 1950 period. Lets see how well you and NOAA match the station data for that period. I have separated stations into two groups, stations with moves and the stable stations without moves. The stations without moves show that there wasn't any significant local temperature change between 1945 and 1950. Those stations are only 0.1F cooler on average in 1950. In contrast, the 2 stations with moves, Phoenixville and Coatesville, cooled by 2F on average. Cooling at these stations is spurious, caused by station changes not weather. NOAA captures our local weather well, matching the stable stations, with a modest 0.3F cooling between 1945 and 1950. In contrast your “True Actual Average” cooled by 1.4F, much larger than the weather-related temperature change captured the stations without moves. Station changes at 2 of the 3 Chesco stations active in this period contaminate your results. For all your complaints about NOAA, you are the guy who is altering our past weather. Introducing a phantom, move-related, "cooling cycle" to the 1945-50 period. The difference between your results and NOAA's highlights the importance of bias adjustments in Chester County. Our COOPs experienced one change after the other. Finally why is NOAA warmer than the 1940s coop station population? Easy, the 1940s stations are warmer than the county as a whole due to their location in built up towns. When they moved out of towns they cooled. Your "True Actual Average" is almost as warm as Philadelphia in 1945. Notice that Coatesville matches NOAA exactly in 1950. Makes sense, unlike Coatesville City, the new rural Coatesville location is representative of the county as a whole. NOAA isn't fooled by station moves, that's a rookie mistake.
-
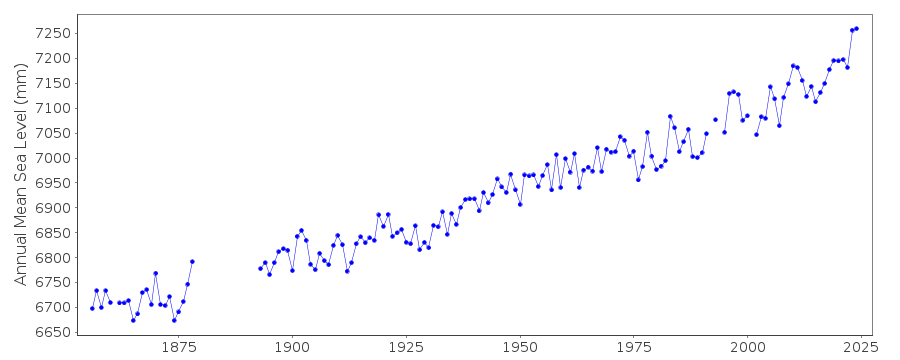
Here's sea level data for the Battery, in New York. Sea-level rise has accelerated this century along the US east and gulf coast. https://psmsl.org/data/obtaining/
-
Your table shows the 2F cooling associated with the Phoenixville move, but you need to go back to 1945 to capture the Coatesville move. Here are two data tables which isolate the moves more clearly. Roughly 2F cooling according to the raw data. Regarding the site photos which you complained about. Coatesville's housing stock is almost entirely pre-1920, the city's population peaked in 1930, so todays photos provide useful information about conditions in 1945.
-
Suggest you look more carefully at the data I am presenting without dismissing it out of hand.
-
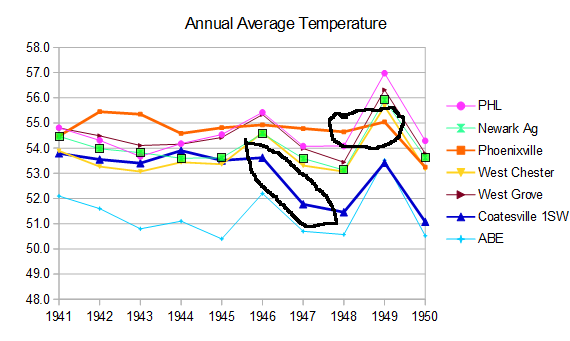
I circled the station moves: Coatesville 1946 and 47, Phoenixville 1949 and West Chester 1970. Each move caused roughly 2F cooling. Easy to spot the station changes as the year-to-year temperature change at the station that moved differed from the other two stations. As I have shown previously, take out the station moves by plotting before and after move data separately and NOAA is a close match to the raw data.
-
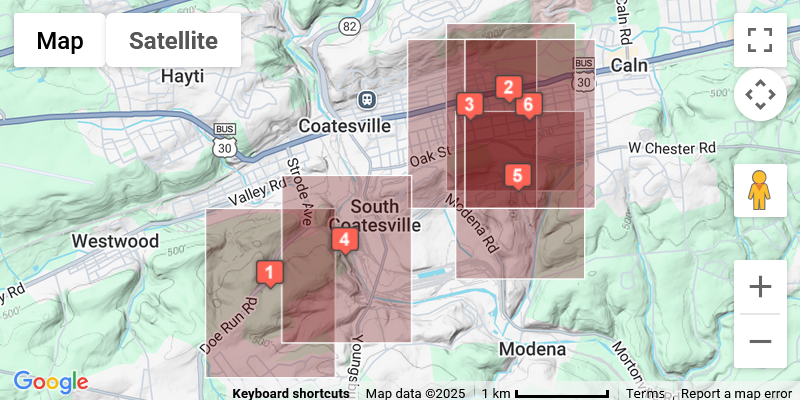
Yes, data adjustment is needed and successful. Here is a map of Coatesville 1SW COOP station locations from NCDC, illustrating the large range in station local site conditions for this one COOP station. The COOP data was collected by volunteers whose lives changed with time, resulting in station changes. Also attached a satellite views showing the complexity of local land use. Coatesville is a steel town. The link below provides information on the steel mill. When the Coatesville Coop first collected data in 1894 the steel mill was the largest in the US. The mill reached its largest size during WWII with over 6000 employees. The Coatesville 1SW COOP station was active from 1894 to 1982. The stations are numbered starting with site #1, the most recent which was active from 1948 to 1982. Site #6 is the oldest. Pictures of sites 1 and 2 are shown a couple of posts above. You aren't going to get an accurate picture of Chester County's climate if you assume that all of these stations are exactly the same. Fortunately we have thousands of weather stations in the US. Which makes it easy to separate weather and station moves using well established procedures. https://en.wikipedia.org/wiki/Lukens_Steel_Company
-
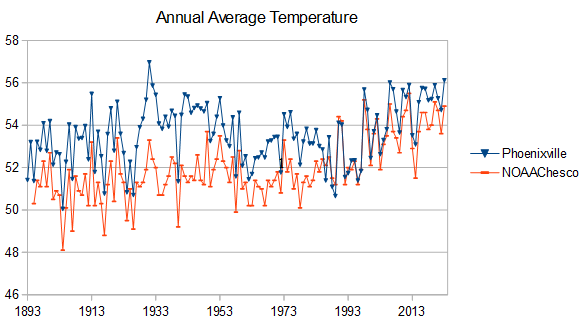
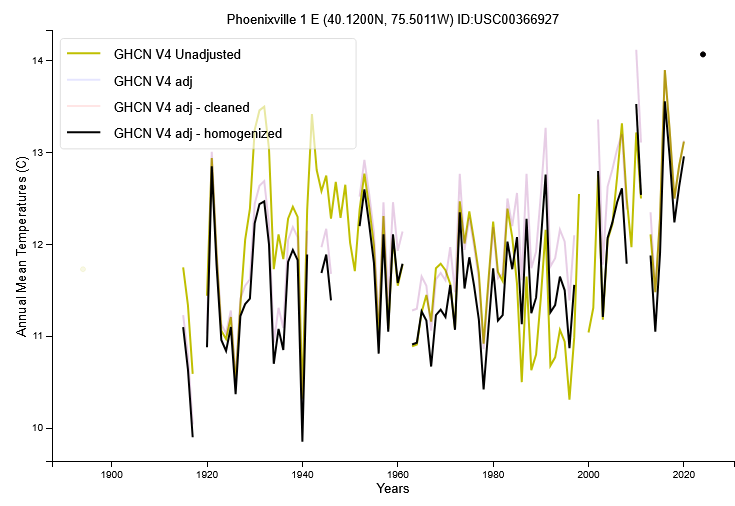
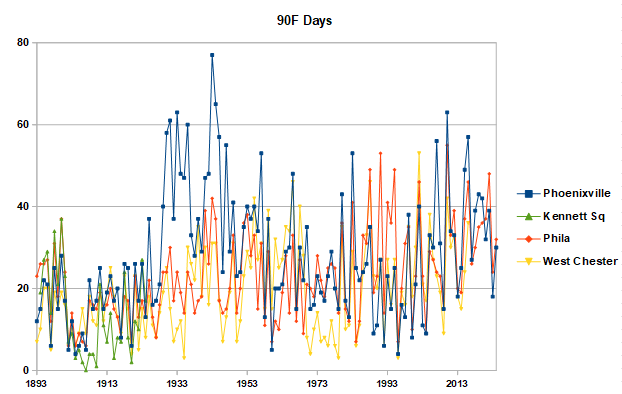
We don't have any Chesco stations that haven't had major changes. But one station, Phoenixville, provides consistent data for 1890-1926 vs present. Phoenixville has had moves and station changes, but has remained on the local water property site since 1893. This site, with a small reservoir, has not seen any significant development during the period of station operation. There have been major station changes at Phoenixville however, which we have documented previously on this site. The station ran spuriously warm between 1927 and 1949, particularly on summer afternoons; and, ran cool in the 1990s. There is also a fair bit of missing data Charts below: 1) Phoenixville and NOAA Chesco showing good agreement on the roughly 4F Chesco temperature rise between the 1890s and present. 2) Adjusted and unadjusted temperatures for Phoenixville showing the roughly 4F warming in both the adjusted and unadjusted data, but with large adjustments for 1927-49 and the 1990s as discussed above, and 3) Annual 90F days for Phoenixville and other stations showing a large spurious spike at Phoenixville in the 1927-48 period, illustrating the station warmth during this period. We've been going over the Chester County data in detail for over a year. Well documented in the Chester County thread. I would be glad to answer any questions if you are interested. The raw data in Chester County paints a very consistent picture of warming that is captured accurately by NOAA. The fact that Paul (Chescowx) can't find warming tells us more about himself than Chester County's weather.