chubbs
Members-
Posts
4,061 -
Joined
-
Last visited
Content Type
Profiles
Blogs
Forums
American Weather
Media Demo
Store
Gallery
Everything posted by chubbs
-
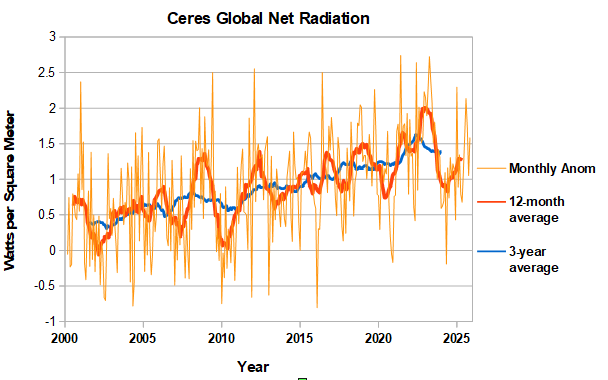
CERES net radiation continues to increase off the El Nino bottom set in late summer 2024. The last net radiation peak occurred in January 2023, as the 3-year nina came to an end. With growing signs of a shift from nina to nino conditions another peak is probably developing this winter. If so the next net radiation peak will be well below Jan 2023 levels and more in-line with winter of 21/22 and other recent nina peaks since 2008. Indicates that a portion of the unusually high peak in winter2022/2023 was enso-related. In-any-case the current radiation imbalance would support a rise in global temperatures to record levels if moderate/strong nino conditions develop as forecast.
-
"There was a watershed moment for Australian energy transition this week as the Australian Energy Market Operator released its energy dynamics report for the December quarter of 2025: Renewables comprised more than half of energy supply in the quarter, driving down wholesale electricity prices by nearly half. Coal-fired generation was down 4.6% year on year, falling to an all-time quarterly low. Gas-fired generation plunged 27% to its lowest level for 25 years." https://www.pv-magazine-australia.com/2026/01/29/turning-point-renewables-surge-to-50-of-supply-wholesale-power-prices-plunge-grid-resilient-to-heatwaves/
-
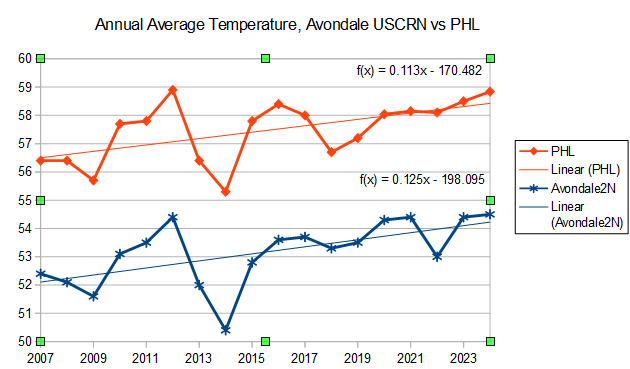
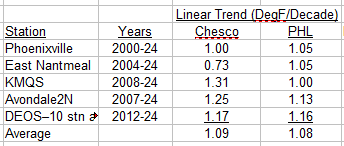
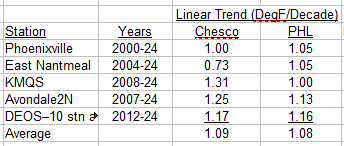
You are either ignoring the evidence I posted or don't understand it. Lets make it simple. Here is the Avondale USCRN station, carefully chosen with 3 identical thermometers. Since its start-up in 2007, Avondale has warmed at .125F per year or 1.25F per decade. Over the same period, PHL has warmed by .113F per year or 1.13 per decade. The same numbers are in the table I posted. The table shows similar results for the 12 DEOS stations, KMQS, Phoenixville, etc. All warming at a similar rate as PHL. Clear and overwhelming evidence that Chester county is warming at the same rate as the Philadelphia Airport. The raw data doesn't support the point you are making.
-
Why are the cooling rates in your chart different? Your own faulty analysis. Comparing the raw data at individual Chester County sites to the Philadelphia Airport shows very good agreement in warming rates; i.e, the Philadelphia airport is warming at the same rate as Chester County. Well known that averaging over a changing network skews the data. If the station network cools with time then a simple average of the changing network will underestimate warming. That's exactly what is happening in your charts.
-
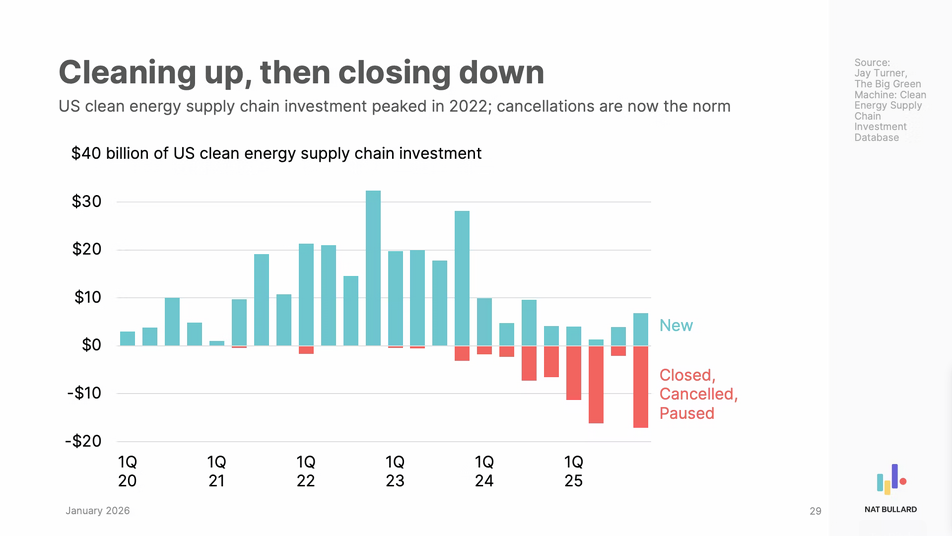
We aren't helping ourselves by adopting anti-renewable/EV policies. These technologies are still coming to the US, but at a slower pace than they would have.
-
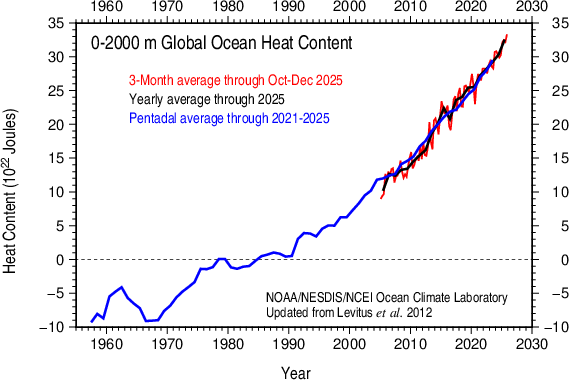
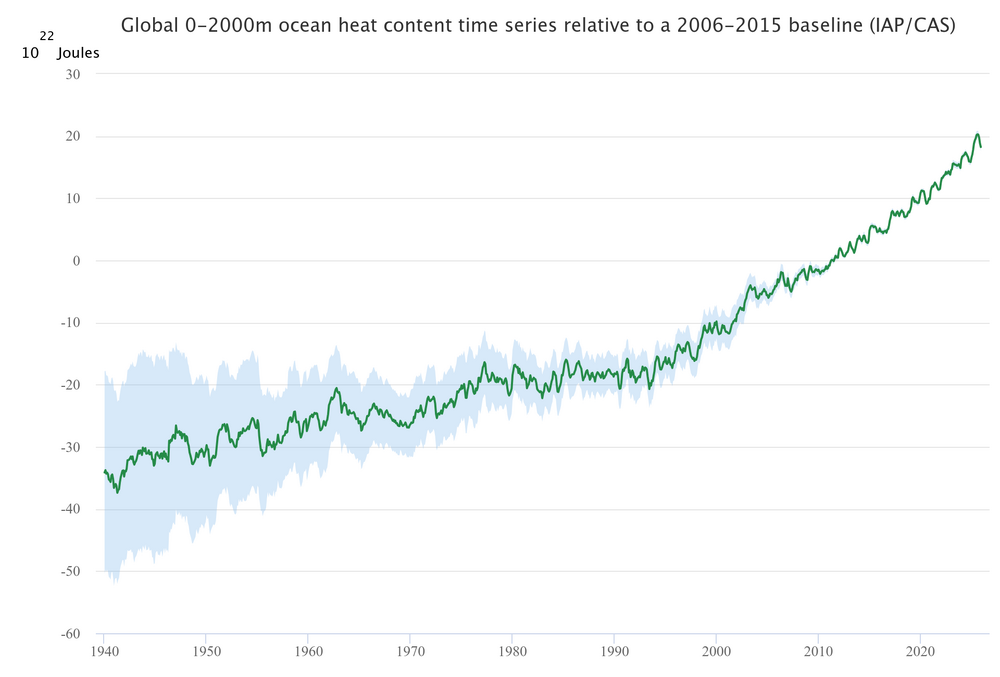
NOAA ocean heat content surged last year. Agrees with other ocean heat datasets for 2025 posted above. Another sign of accelerating warming since the hiatus ended.
-
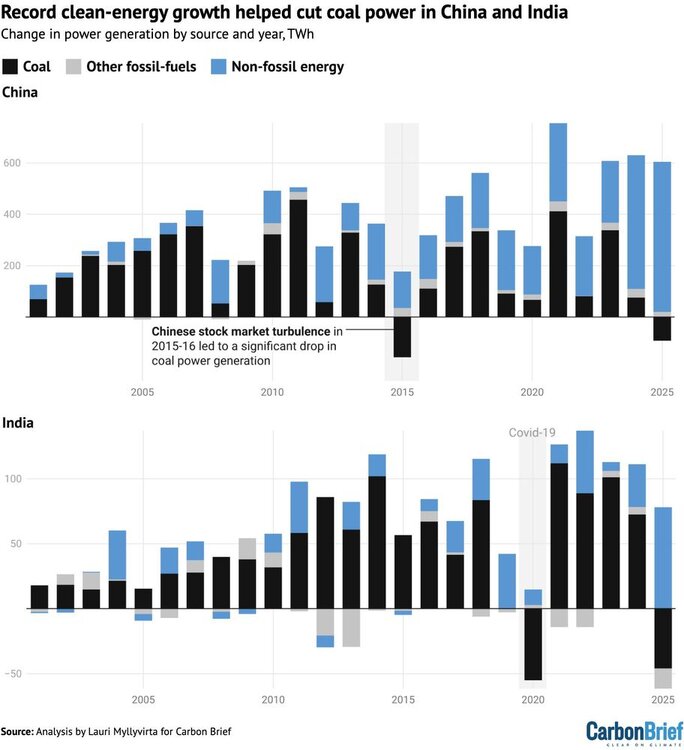
You aren't looking at the whole energy picture. China's use of existing coal plants is dropping. The next few years will tell the tale. Which will slow first in China, new coal or renewable construction? In any case China's energy strategy is much more realistic than ours. They have less fossil fuel and renewable resources than we do, yet their energy is abundant and cheap. We are in energy denial, betting on a horse that is falling further and further behind every day. https://www.carbonbrief.org/analysis-coal-power-drops-in-china-and-india-for-first-time-in-52-years-after-clean-energy-records/
-
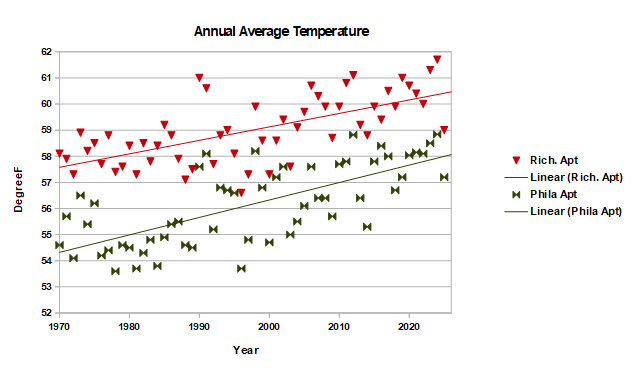
Here's a comparison for the east coast, Philadelphia and Richmond, roughly the same distance and direction as Detroit/Dayton. Using the regression line, the Philly Airport is as warm today as the Richmond Airport was in the late 1970s, 58F. I like using the regression line because that is the best estimate of the temperature one would expect in any year based on past temperatures.
-
Here's a study from a few years back with a similar goal. How far will my climate shift in the future? https://www.sciencedaily.com/releases/2019/02/190212120044.htm https://www.umces.edu/futureurbanclimates
-
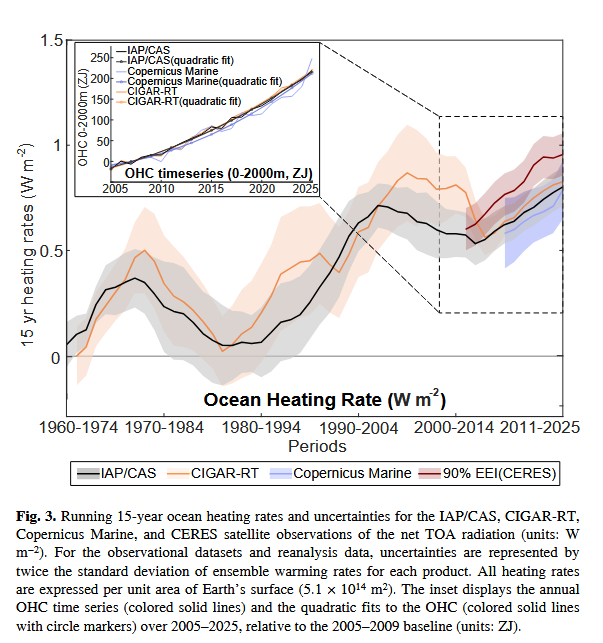
A chart from the technical paper shows that the rate of ocean warming is increasing. Note that data is from a number of sources including satellite net radiation measurements. https://link.springer.com/article/10.1007/s00376-026-5876-0
-
Sea level rise is accelerating along the Gulf and Atlantic coasts. Here are Savannah and Cape May for instance. Data available at link below. https://psmsl.org/data/obtaining/stations/395.php Savannah Cape May
-
http://www.ocean.iap.ac.cn/pages/dataService/dataService.html?languageType=en&navAnchor=dataService
-
Large increase in 0-2000m ocean heat content last year. NOAA data through mid-year also shows a large increase.
-
-
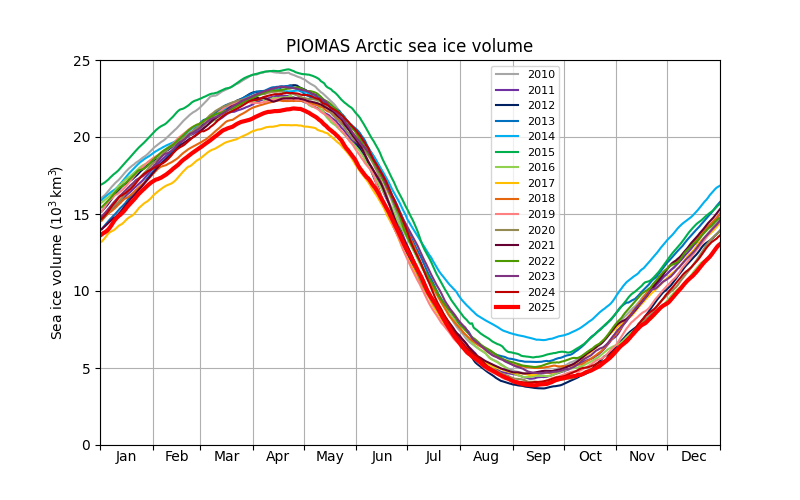
PIOMASS volume growth has been slow this freezing season, ending 2025 at record low levels. The second low is 12/31/2016, which is hidden under the 2025 line.
-
Yes I know what performance is. All the things you mention and more will improve significantly with solid state batteries. The US market doesn't tell you much about EV performance because the best EVs come from China, not the US, and those vehicles are excluded from the US market. However this new announcement may allow other countries to catch-up or even leapfrog China. We will see.
-
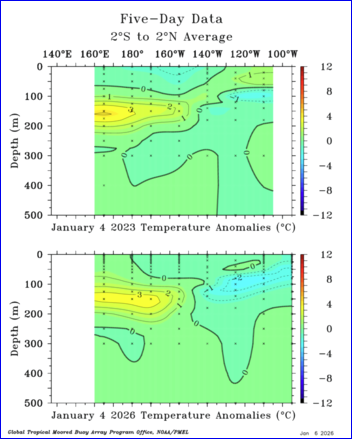
The subsurface temperature distribution in the Pacific is similar to 2023, but the surface is different. Relative warmth is more west-based this year.
-
A Finnish start-up has introduced the first commercial solid-state battery: light-weight, durable, fast charging, and inexpensive. If product claims pan out, EV performance, which is already matching combustion vehicles, will improve dramatically. https://insideevs.com/news/783380/first-production-ready-all-solid-state-battery-official-specs/
-
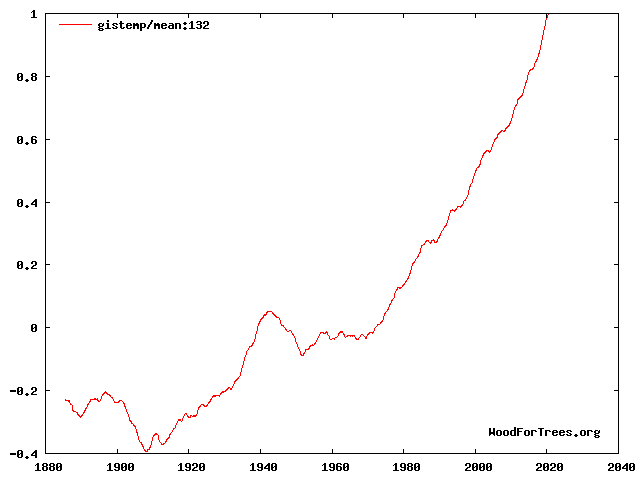
Agree. A global temperature average with an 11-year running mean takes out almost all the variability due to: weather, enso, solar, and volcanoes.
-
Hunga Tonga volcano assessment report is out. Large effect on stratosphere but relatively small effect at surface: Professor Maycock said, "The Report shows that although water vapor is a greenhouse gas, Hunga had a net cooling effect overall and did not cause the record level of global warming observed in 2023 and 2024. This is a very important finding as understanding what caused the recent surge in global warming is a priority for the climate science community." https://phys.org/news/2025-12-international-reveals-atmospheric-impact-hunga.html https://juser.fz-juelich.de/record/1049154/files/Hunga_APARC_Report_full.pdf?version=1
-
Pacific upwelling much faster at the equator than scientists thought “It turns out that equatorial upwelling in the Pacific is about 10 times faster than we previously thought,” Karnauskas said. “And this could be really important because that water rising toward the surface in the Pacific covers a huge fraction of the ocean surface, and it affects things like temperature and nutrients needed for photosynthesis.” His work, published today in the Journal of Climate, reveals the faster rate of upwelling and determines why older estimates were off. Karnauskas combed through old observations and analyzed vast amounts of new data from state-of-the-art measurement tools to get a more accurate estimate. The findings point to a key discrepancy in global climate models, which currently predict significant warming along the equator in the Pacific. This new rate may help researchers understand why they have struggled to capture key climate trends in the region. https://cires.colorado.edu/news/pacific-upwelling-much-faster-equator-scientists-thought https://journals.ametsoc.org/view/journals/clim/38/16/JCLI-D-24-0704.1.xml
-
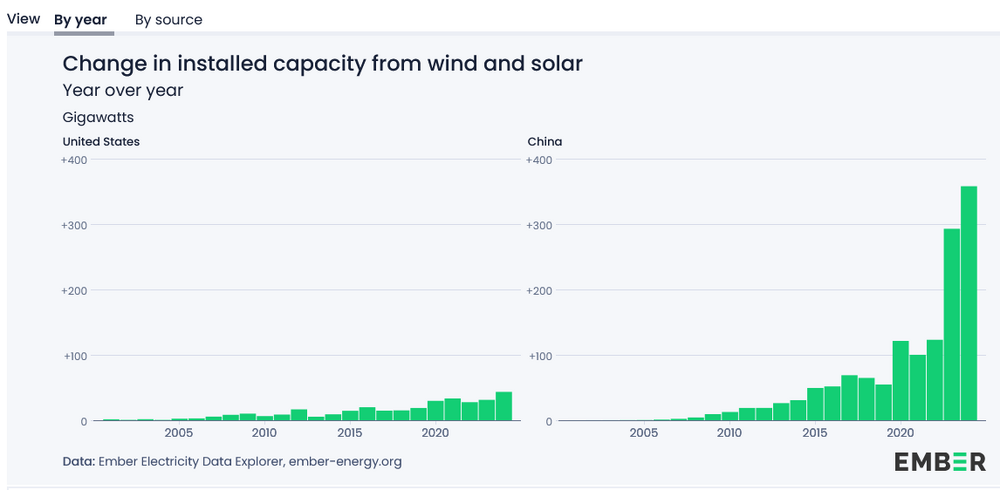
China has shown that it is possible to ramp solar very quickly. The main constraint is factories not resources in the ground like fossil fuels. With batteries dropping rapidly in cost, the addressable market for solar has expanded significantly. The ability to cost-effectively replace fossil fuels at scale has suddenly developed.
-
Below are a press release and a Q+A on the retracted paper. The problems with the original paper have been addressed and a new paper has been submitted. How do the results in the corrected version compare to the original: "The revisions did not significantly alter the central estimates, but did increase the uncertainty range they sat within. Correcting the underlying data for Uzbekistan and introducing additional controls to make the model more robust to outlier data and anomalies resulting from the transition between data sources changed the global median income loss from 19% (18.8%) to 17% (17.4%). Accounting for spatial correlation using ‘Conley standard errors’ did not affect the median, but did increase the uncertainty ranges, with the likely range of damages by mid-century increasing from 11-29% to 6-31%." https://www.pik-potsdam.de/en/news/latest-news/authors-retract-nature-study-on-economic-damages-from-climate-change-will-resubmit-for-peer-review https://www.pik-potsdam.de/en/news/latest-news/questions-and-answers-nature-study
-
Northern Hemi snow has also been running low for most of the cold season, record low at times. This can shift quickly. Currently Eurasia is very low, while N America is above average with recent snow advance.
-
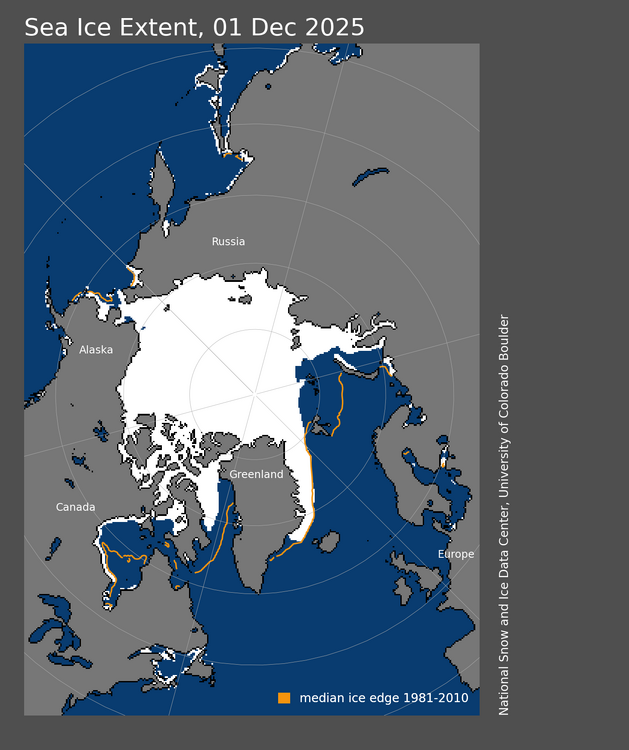
Sea ice is close to normal on the Pacific side; but well below normal on the Atlantic side and Canada.

