chubbs
-
Posts
4,173 -
Joined
-
Last visited
Content Type
Profiles
Blogs
Forums
American Weather
Media Demo
Store
Gallery
Everything posted by chubbs
-
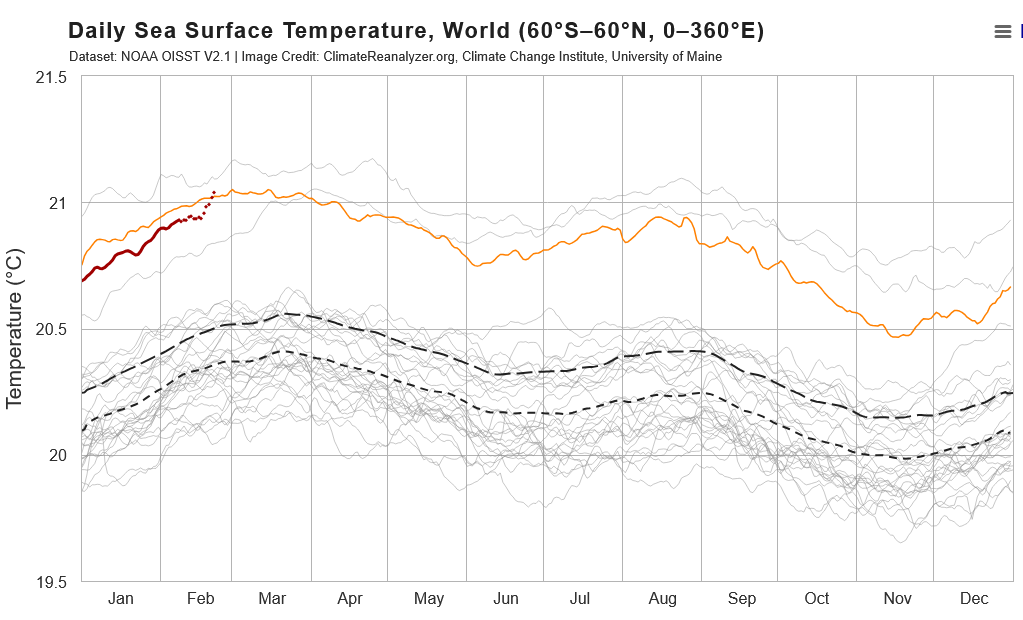
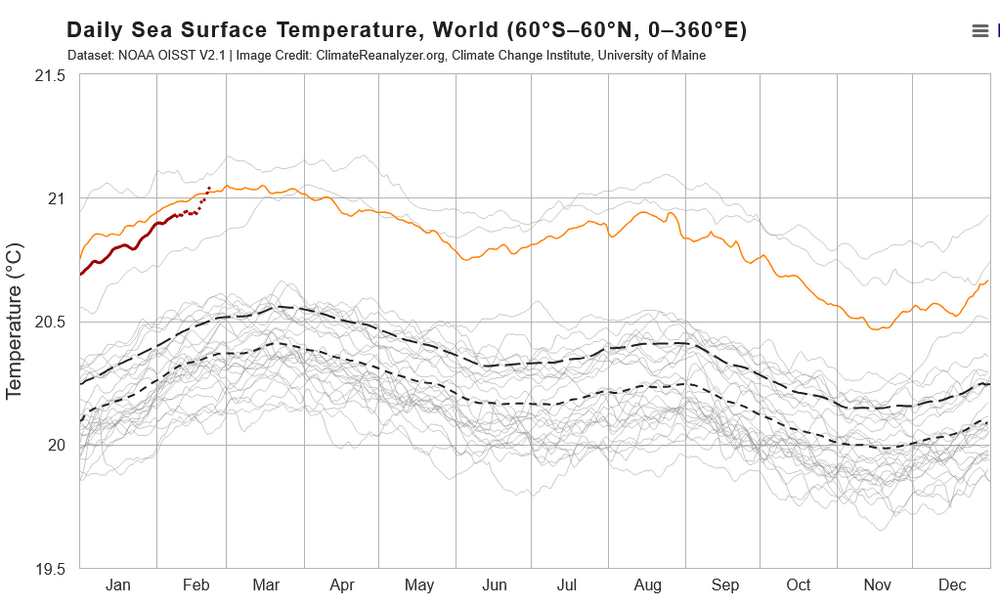
SST trend so far this year is consistent with a nino spike to record temperatures, with the caveat that it is early in the nino cycle. I took years between 2010 and 2022 off the chart to better isolate 2023 and later at the top of the chart. On the chart, 2023 is the coldest of the 4 recent Jan and Feb, red is this year and orange 2025. So far this year SST are tracking 2023, but roughly 0.15C higher. The recent spike in SST has brought 2026 above 2025, approaching record SST in 2024. 2023 moved into record SST territory in mid-March. This year is on a similar pace.
-
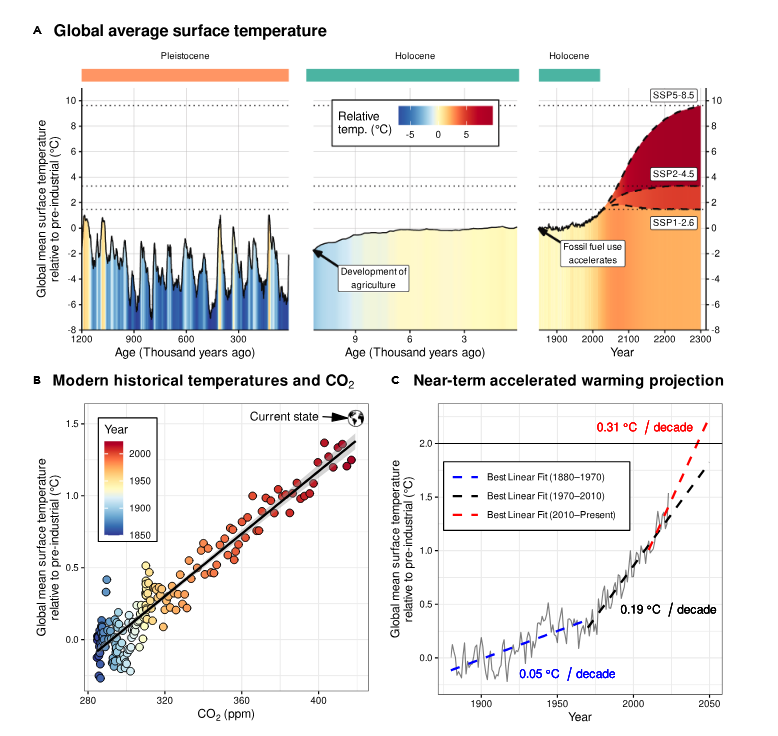
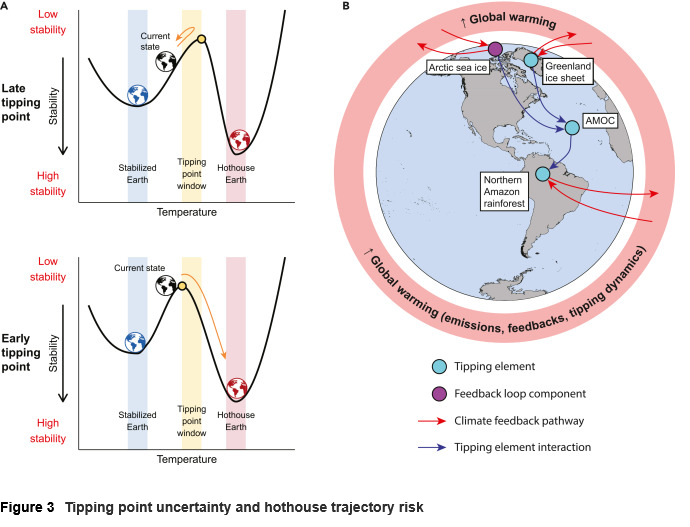
Recent paper on tipping points has good discussion on: our climate trajectory, the tipping point concept, how close we are getting to tipping, and the scientific uncertainty. https://www.cell.com/one-earth/fulltext/S2590-3322(25)00391-4
-
Agree with Don's comment. My problem isn't the facts he is citing, its the things he is leaving out or not aware of. I agree that CO2 is critical for plant growth and that fossil fuel reserves are finite. However, you need to look at all of the effects of CO2 not just the beneficial ones. Crop yield is one of the most well studied areas of human activity. Its just as easy to perform a controlled experiment on temperature, water, seed variety, fertilizer, etc as CO2. There is also a large amount of real world data on crop yield. To say that we only understand CO2 impacts on agriculture and can't quantify non-CO2 impact indicates a lack of knowledge on his part. The same thing can be said about climate science in general, he doesn't seem aware of the large body of scientific work on CO2 and climate change. The beneficial and harmful impacts of CO2 are well known; as is the balance between harmful and beneficial. There is also the tone of the response. He has proved his points with "indisputable science" while my response is "predictable" or "fake climate crisis RELIGION". Doesn't make me look forward to future exchanges.
-
Per Wikipedia the CO2 Coalition is a climate denial organization funded by fossil fuel interests. The CEO is a former head of the American Petroleum Institute. Sure plant life thrived when CO2 was higher but natural temperatures change occurred slowly which allowed accommodation through evolution. The idea that CO2 is plant food is climate denial myth. High temperature and intensification of precipitation counteract CO2 benefits on plant growth. The plants that thrived under higher CO2 were not the same plants in the same locations as today. For instance, If warming continues the Amazon rain forest and Boreal forests will transition to grasslands releasing large amounts of CO2. The same with animals, cold-blooded reptiles were favored in warmer times. Mammals were all small to shed heat. The bottom 2 links cover past mass extinction events. Notice how many where caused by episodes of volcanic activity that released CO2 and other greenhouse gases. https://www.theclimatebrink.com/p/is-co2-plant-food-why-are-we-still https://www.sciencenewstoday.org/10-mass-extinction-events-and-what-caused-them https://www.livescience.com/planet-earth/climate-change/19-mass-extinctions-had-co2-levels-were-now-veering-towards-study-warns
-
Let me rephrase. Of course we will continue to solve problems. The ones that will be difficult to solve will: be complex, need a political solution, have vested interests that hinder a solution, and which are beyond the experience or understanding of most people, i.e., subject to misinformation.
-
Yes, climate change is an amplifying factor. Its not a root cause, but makes problematic weather or problems in society worse. Likewise its emblematic of our ability to address complex problems. If we can't address climate change we won't solve other problems either.
-
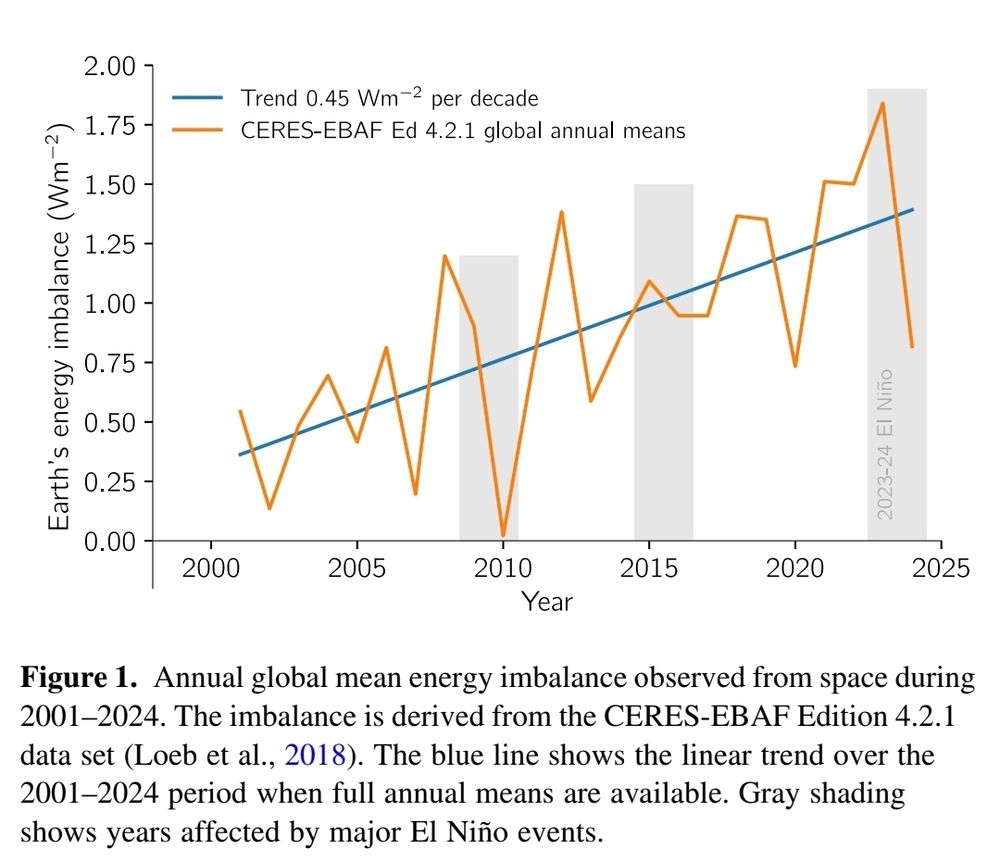
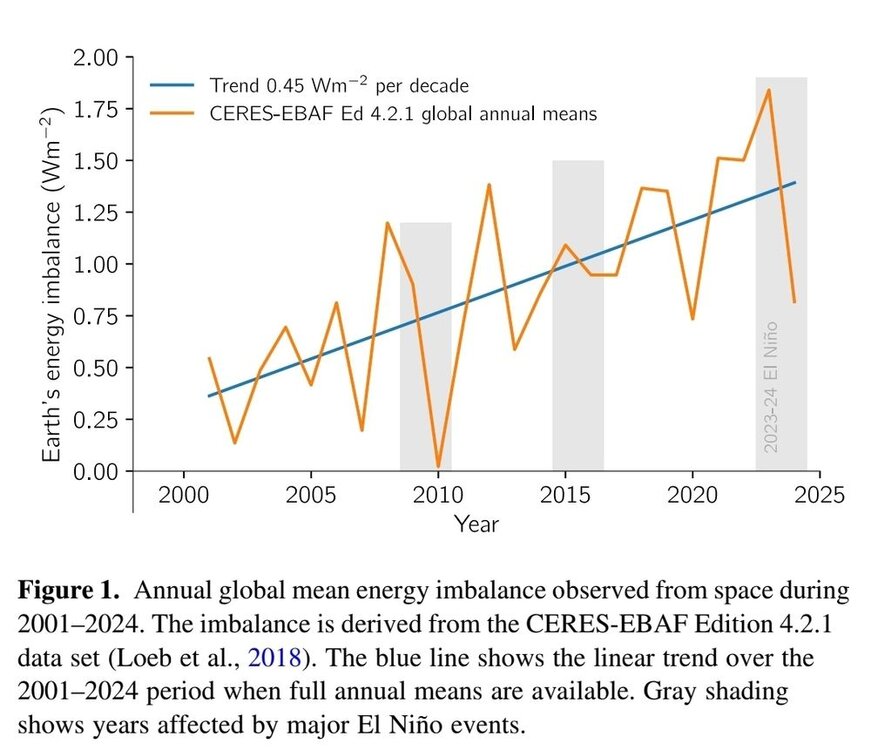
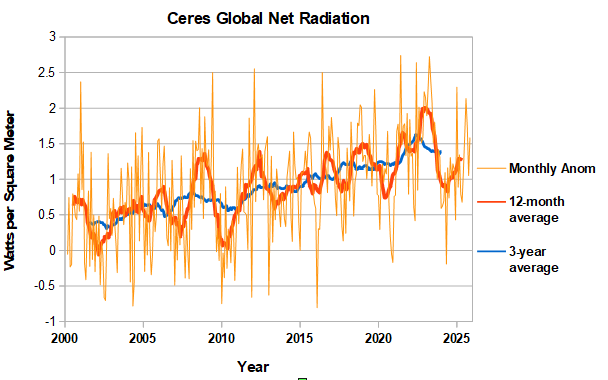
This chart shows the enso effect more clearly. Big dips in net radiation due to radiation to space occurred in 2010 and 2024 ninos. The correlation isn't perfect because there are other factors as well. Cloud cover for instance impacts the amount of sunlight that gets reflected back to space. Less clouds is contributing to the current increasing rate of heat build-up in the climate system. Reduced cloud cover is a positive feedback to warming temperatures. In-any-case the climate system isn't constant. As I pointed above, averaging over 11 years cancels out the short term variation.
-
I'd be cautious without a peer reviewed paper. There is a lot of misinformation on climate out there. We see it here all the time. Most of the published studies I've seen show a negative effect. One that will increase in the future. Warmth is a benefit in northern areas, but a negative further south. Here are a couple of links. https://www.nature.com/articles/s43017-023-00491-0 https://sustainability.stanford.edu/news/climate-change-cuts-global-crop-yields-even-when-farmers-adapt
-
Do you have a reference for climate change improving crop yield? Most studies I have seen show that adverse temperature and precipitation effects cancel any benefit from CO2 fertilization. As you note yields have increased by improvements in seed varieties, fertilizers, pesticides, irrigation, and better farming practices. The chart below shows how different yields would be in a world without climate change compared to our current one; a “decline” in this case means that in such a world yield growth would have been even higher. Climate effects have been small with more negative than positive effects on major crops. https://ourworldindata.org/crop-yields-climate-impact

-
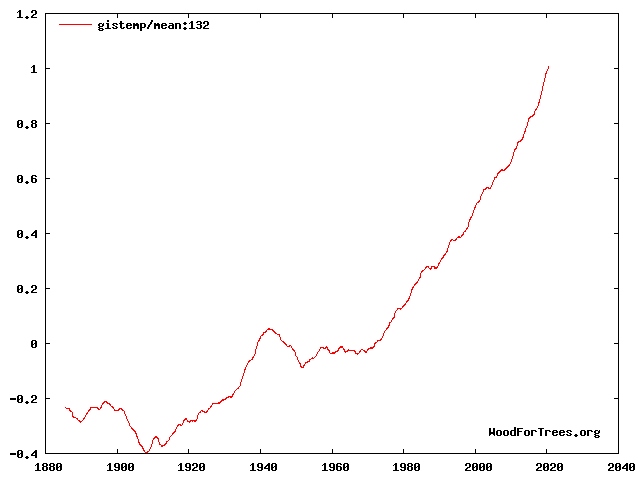
The earth's output is not constant. Instead It is modulated by ENSO. More radiation out during El Nino when the atmosphere is relatively warm and less during La Nina when the atmosphere is cool. Similarly the global surface temperature is modulated by ENSO, the earth's surface is warmer during el nino. Note that the climate system is dominated by the ocean and the rise in ocean temperature is steadier than the global surface temperature. There is also some variation in solar output over the 11-year solar cycle. If you take an 11-year average of global surface temperatures (below) most of the enso and solar variability is removed. Leaving mainly man-made forcing and a small volcano contribution.
-
CERES net radiation continues to increase off the El Nino bottom set in late summer 2024. The last net radiation peak occurred in January 2023, as the 3-year nina came to an end. With growing signs of a shift from nina to nino conditions another peak is probably developing this winter. If so the next net radiation peak will be well below Jan 2023 levels and more in-line with winter of 21/22 and other recent nina peaks since 2008. Indicates that a portion of the unusually high peak in winter2022/2023 was enso-related. In-any-case the current radiation imbalance would support a rise in global temperatures to record levels if moderate/strong nino conditions develop as forecast.
-
"There was a watershed moment for Australian energy transition this week as the Australian Energy Market Operator released its energy dynamics report for the December quarter of 2025: Renewables comprised more than half of energy supply in the quarter, driving down wholesale electricity prices by nearly half. Coal-fired generation was down 4.6% year on year, falling to an all-time quarterly low. Gas-fired generation plunged 27% to its lowest level for 25 years." https://www.pv-magazine-australia.com/2026/01/29/turning-point-renewables-surge-to-50-of-supply-wholesale-power-prices-plunge-grid-resilient-to-heatwaves/
-
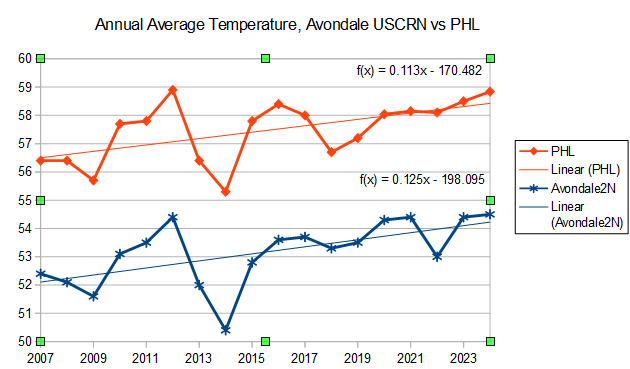
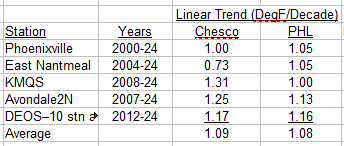
You are either ignoring the evidence I posted or don't understand it. Lets make it simple. Here is the Avondale USCRN station, carefully chosen with 3 identical thermometers. Since its start-up in 2007, Avondale has warmed at .125F per year or 1.25F per decade. Over the same period, PHL has warmed by .113F per year or 1.13 per decade. The same numbers are in the table I posted. The table shows similar results for the 12 DEOS stations, KMQS, Phoenixville, etc. All warming at a similar rate as PHL. Clear and overwhelming evidence that Chester county is warming at the same rate as the Philadelphia Airport. The raw data doesn't support the point you are making.

-
Why are the cooling rates in your chart different? Your own faulty analysis. Comparing the raw data at individual Chester County sites to the Philadelphia Airport shows very good agreement in warming rates; i.e, the Philadelphia airport is warming at the same rate as Chester County. Well known that averaging over a changing network skews the data. If the station network cools with time then a simple average of the changing network will underestimate warming. That's exactly what is happening in your charts.
-
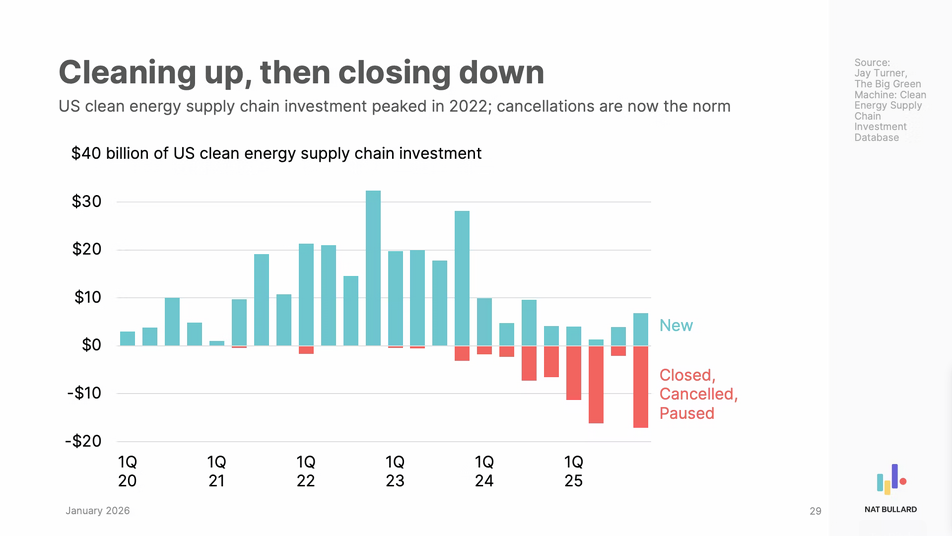
We aren't helping ourselves by adopting anti-renewable/EV policies. These technologies are still coming to the US, but at a slower pace than they would have.
-
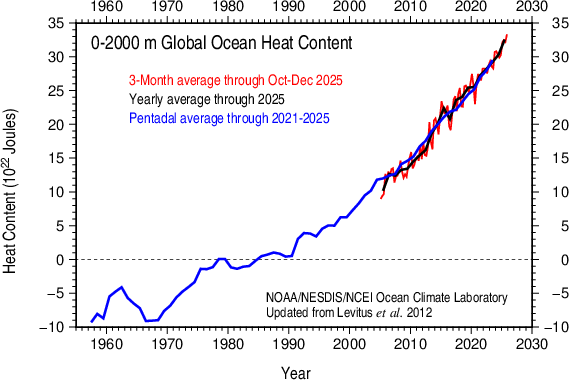
NOAA ocean heat content surged last year. Agrees with other ocean heat datasets for 2025 posted above. Another sign of accelerating warming since the hiatus ended.
-
You aren't looking at the whole energy picture. China's use of existing coal plants is dropping. The next few years will tell the tale. Which will slow first in China, new coal or renewable construction? In any case China's energy strategy is much more realistic than ours. They have less fossil fuel and renewable resources than we do, yet their energy is abundant and cheap. We are in energy denial, betting on a horse that is falling further and further behind every day. https://www.carbonbrief.org/analysis-coal-power-drops-in-china-and-india-for-first-time-in-52-years-after-clean-energy-records/

-
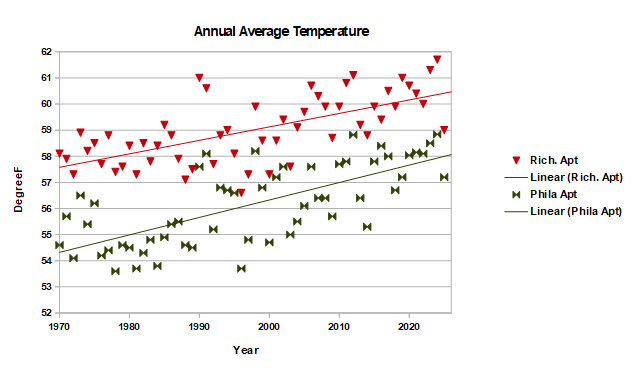
Here's a comparison for the east coast, Philadelphia and Richmond, roughly the same distance and direction as Detroit/Dayton. Using the regression line, the Philly Airport is as warm today as the Richmond Airport was in the late 1970s, 58F. I like using the regression line because that is the best estimate of the temperature one would expect in any year based on past temperatures.
-
Here's a study from a few years back with a similar goal. How far will my climate shift in the future? https://www.sciencedaily.com/releases/2019/02/190212120044.htm https://www.umces.edu/futureurbanclimates
-
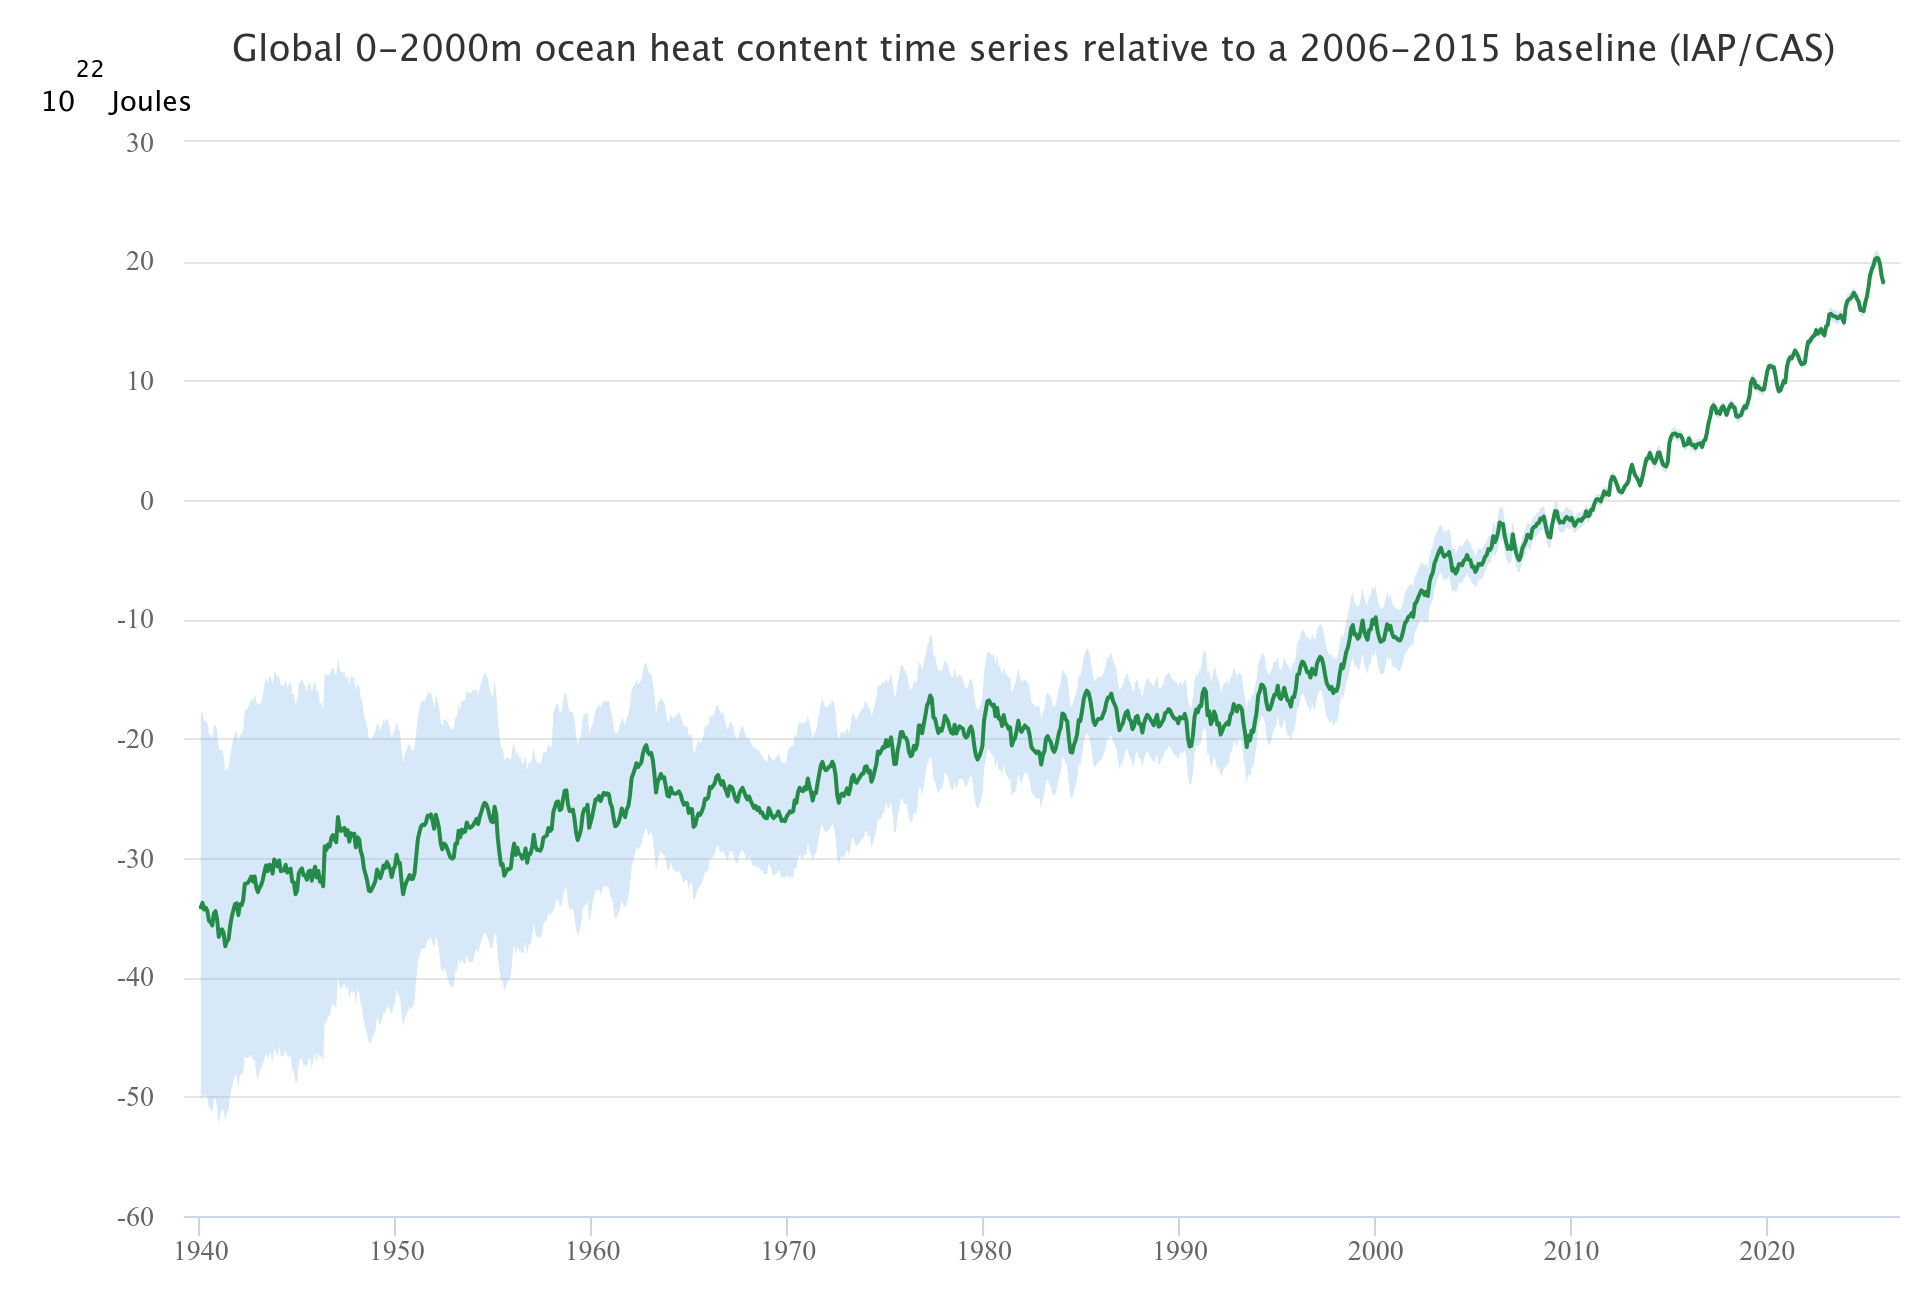
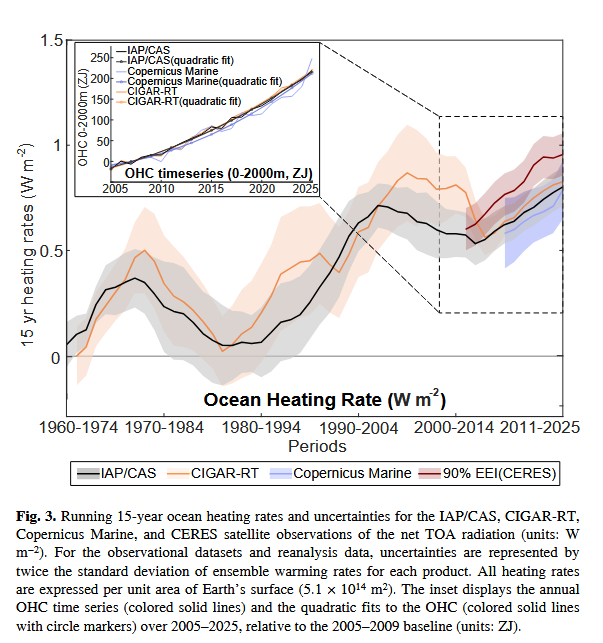
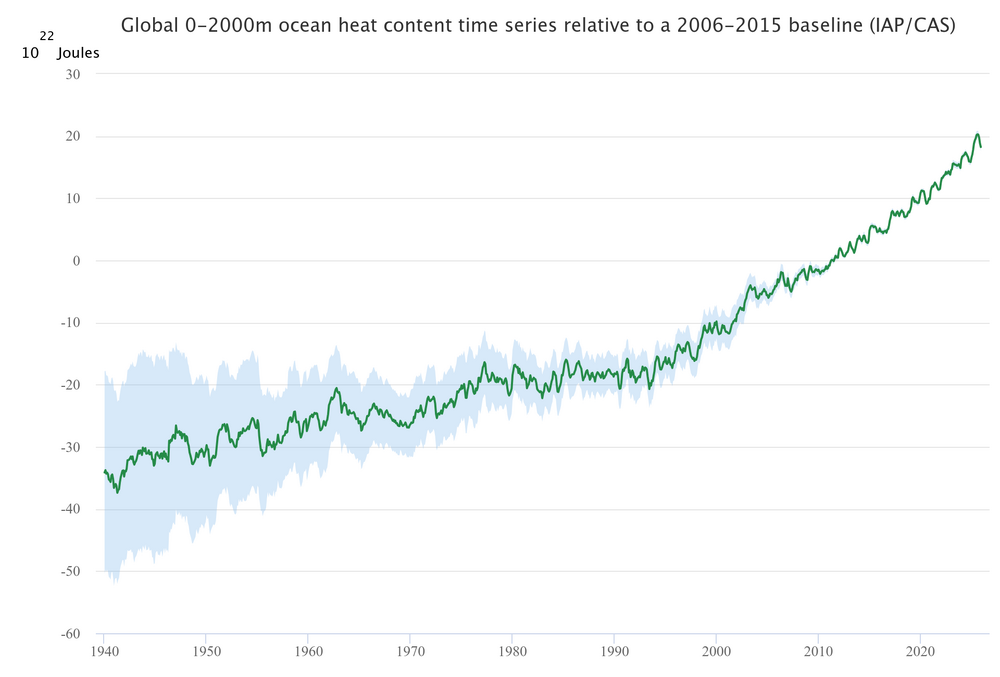
A chart from the technical paper shows that the rate of ocean warming is increasing. Note that data is from a number of sources including satellite net radiation measurements. https://link.springer.com/article/10.1007/s00376-026-5876-0
-
Sea level rise is accelerating along the Gulf and Atlantic coasts. Here are Savannah and Cape May for instance. Data available at link below. https://psmsl.org/data/obtaining/stations/395.php Savannah Cape May


-
http://www.ocean.iap.ac.cn/pages/dataService/dataService.html?languageType=en&navAnchor=dataService
-
Large increase in 0-2000m ocean heat content last year. NOAA data through mid-year also shows a large increase.
-
Yes impressive cold in Alaska and Yukon. Cool here in Philly also. Our coolest December since 2010.
-
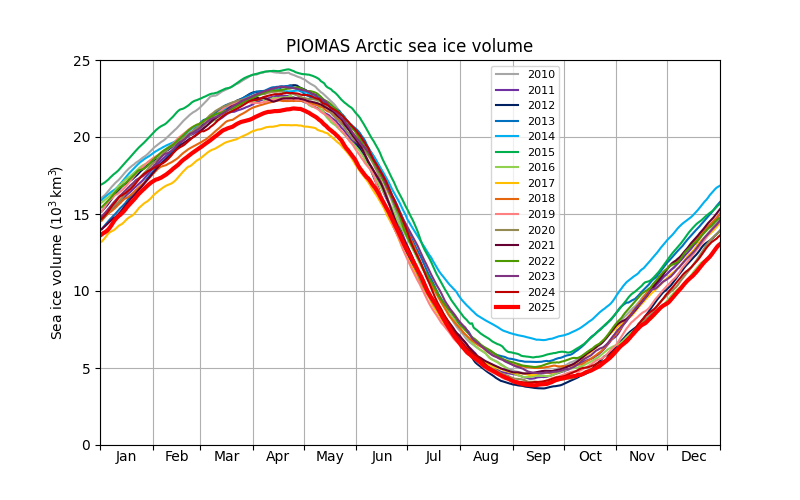
PIOMASS volume growth has been slow this freezing season, ending 2025 at record low levels. The second low is 12/31/2016, which is hidden under the 2025 line.