chubbs
-
Posts
4,119 -
Joined
-
Last visited
Content Type
Profiles
Blogs
Forums
American Weather
Media Demo
Store
Gallery
Everything posted by chubbs
-
Chester County PA - Analytical Battle of Actual vs. Altered Climate Data
chubbs replied to ChescoWx's topic in Climate Change
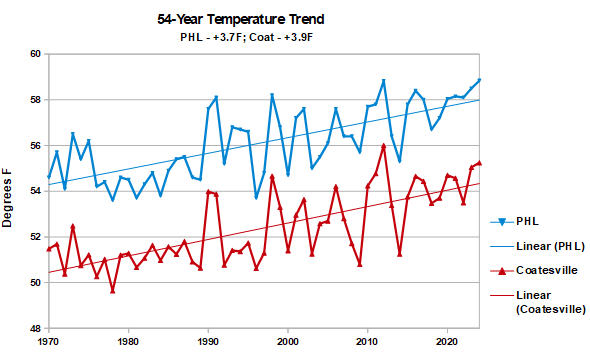
Very important to remove the station changes in Chester county. The county stations moved frequently and bigger changes were cooling. The station population has cooled with time mainly due a shift from towns to more rural sites. Our older stations are warmer than the county as a whole, particularly in the 1930-48 period when Phoenixville was much warmer than other local stations on summer afternoons; and, West Chester and Coatesville were in built-up towns. I can match NCEI perfectly by; 1) excluding the 3 big station moves: Coatesville in 1946+48, Phoenixville in 1948 and West Chester in 1970; and, by removing the temperature difference between stations by taking station anomalies to a common period. Raw data without the contamination of station changes. The chart below shows that NCEI has met their objective of taking out station changes to reveal the weather and climate signal in the raw data. Of course, if you leave in all the station changes you won't match NCEI or any other scientific analysis. This thread is a strawman based on bad analysis and confirmation bias.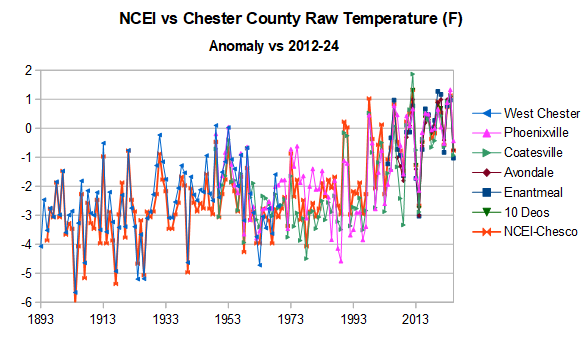
-
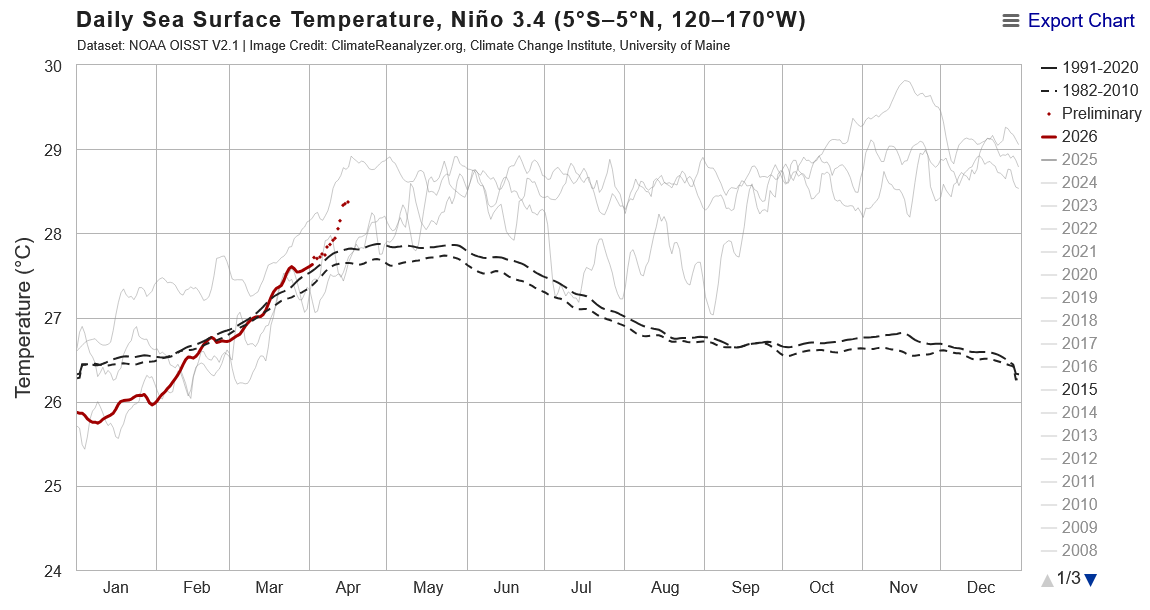
April RONI - 1982 - 0.48 and 1997 - 0.49. Closer to ONI as expected since tropics were cooler
-
Recent rise in Nino 3.4 SST is similar in timing and magnitude to last 3 super ninos. Chart below shows 1982, 1997 and 2015 along with this year.

-
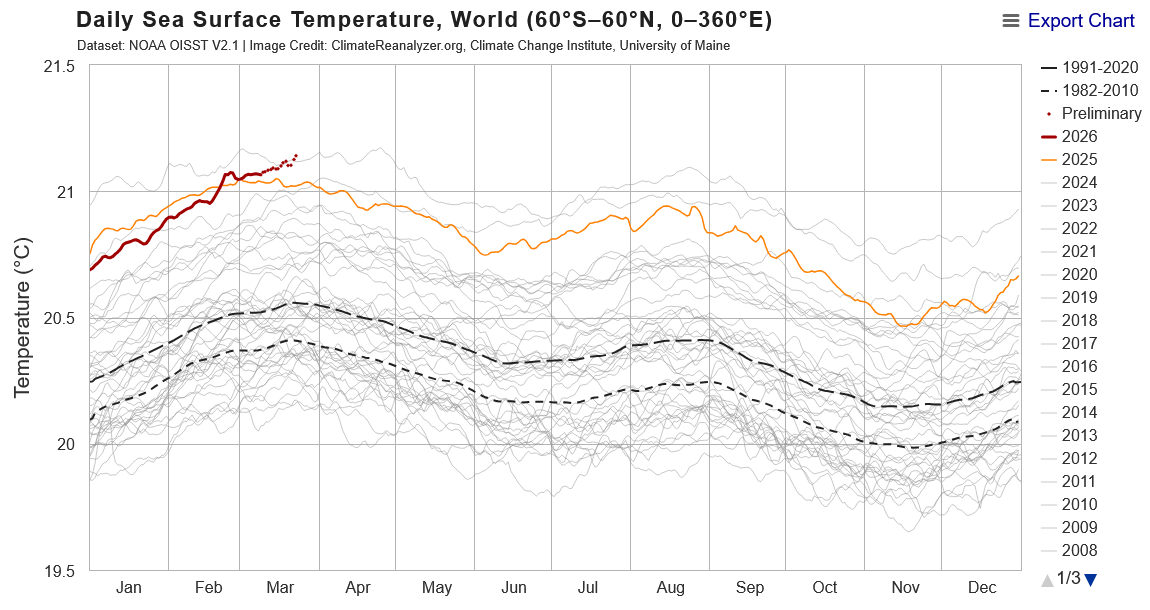
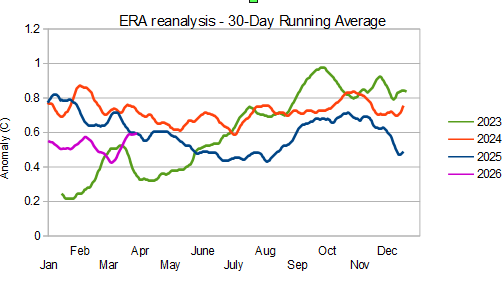
So far 2026 has been running cooler globally than 2024 and 2025, but warmer than 2023. If 2026 warms as much in the remainder of the year as 2023, then a yearly global record is likely. However, warming in 2023 was unusually large for an el nino onset year. We will need to see monthly records begin to be broken in the summer to have a chance of breaking a yearly record. Will be a good test of whether the unusual warmth in 2023 was anomalous or caused by the large earth energy imbalance.
-
Chester County PA - Analytical Battle of Actual vs. Altered Climate Data
chubbs replied to ChescoWx's topic in Climate Change
Raw data determines whether there was a station change not NCDC documentation, which can be incomplete. The 2F cooling of Morgantown relative to Coatesville is clearly a station change of some kind. The Morgantown site was didn't operate for 5 months in the summer of 1966, station changes in Chester County that I have investigated usually coincided with station shutdowns.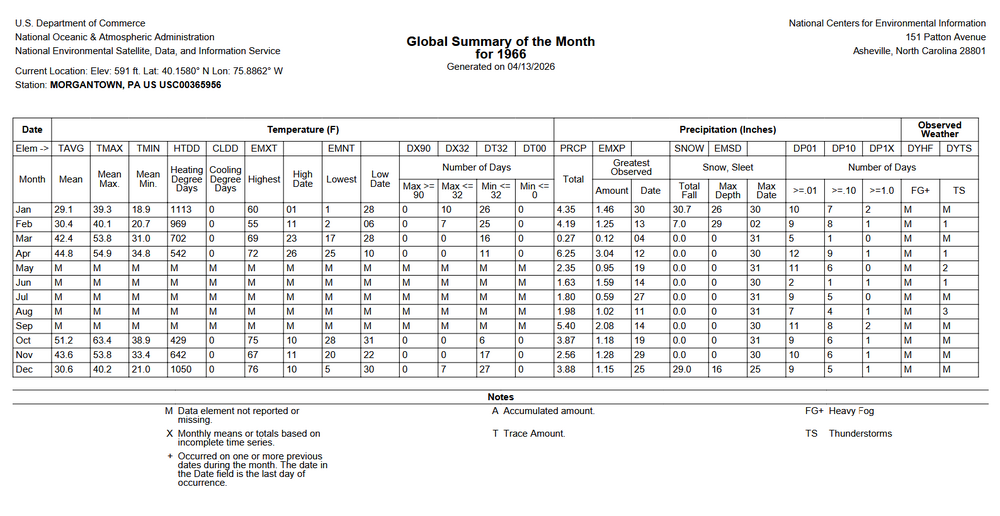
-
Chester County PA - Analytical Battle of Actual vs. Altered Climate Data
chubbs replied to ChescoWx's topic in Climate Change
First of all no data is altered. That is a false, misleading claim on your part. The adjustments are merely a step in the climate data analysis process. They are never purported to be actual measurements. Second the adjustments make sense if you know how they are calculated and used. Plotting the data in your table shows that Coatesville and Morgantown do not agree at times on the year-to-year temperature changes. The largest discrepancy, roughly 2F, is between 1966 and 67. That is a clear sign of a major station change, probably at Morgantown. Congratulations you've identified another major COOP station change , The station change doesn't mean that the data is bad. Only that station change needs to be accounted for when estimating long-term temperature trends. Otherwise roughly 2F of bias will be introduced. Also note that a change between 1966 and 67 would trigger station adjustments in all the prior years. That's why you find so many large positive adjustments in the older West Chester, Phoenixville and Coatesville data. All of the stations experienced moves from warmer to cooler sites between 1946 and 1970.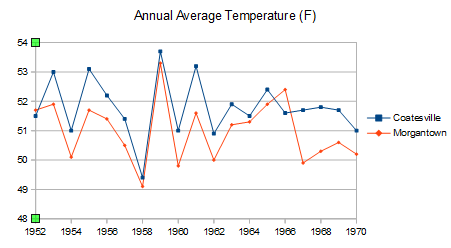
-
Chester County PA - Analytical Battle of Actual vs. Altered Climate Data
chubbs replied to ChescoWx's topic in Climate Change
The exact stations are immaterial. Very easy to spot the large station moves using the Chester County stations. The proof is in the pudding. NOAA matches the raw Chesco data once the big moves are removed, particularly the overall warming in the past 130 years.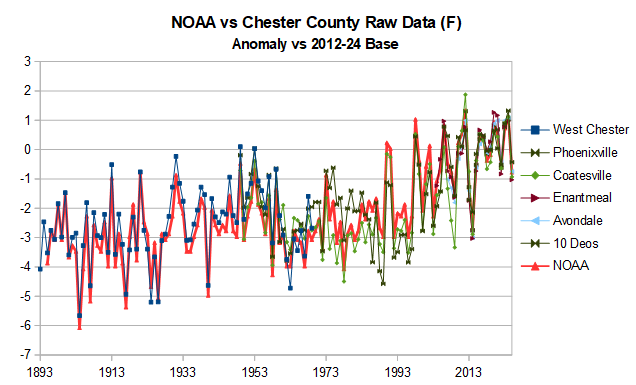
-
Chester County PA - Analytical Battle of Actual vs. Altered Climate Data
chubbs replied to ChescoWx's topic in Climate Change
I don't know which stations were used. However the number is more than adequate. There is a dense network of stations in this area. Below is a comparison of raw data to NOAA. The raw data is the same chart that was posted above; but, with Avondale, 10 DEOS stations and E Nantmeal added. As described above, I've taken out the important post -war station moves: Coatesville (46+48), Phoenixville (48), and West Chester (70). I've also removed the temperature difference between stations by taking an anomaly. The anomaly period has been shifted to 2012-24 since all stations except West Chester pre-1970 operated in this period. Anomalies for West Chester are obtained using the 2.1F difference between 2012-24 and 1949-69 from the Phoenixville and Coatesville records. Removing the large post-war station moves and the differences between stations is sufficient to bring the raw data and NOAA into very good alignment for the long-term climate trend.. Not surprisingly, there are short-term differences between between the raw data and NOAA, mainly Phoenixville and Coatesville, between 1960 and 1990, when these stations had periodic adjustments. This shows that for the big picture long-term trend, most of the NOAA adjustments don't move the needle. Only the big moves, with roughly 2F cooling, obscure the warming. NOAA's goal is to remove station changes from the raw data leaving only weather and climate. This comparison shows that NOAA has met their objective in Chester County. If you aren't matching NOAA, you aren't getting the county climate right.
-
Chester County PA - Analytical Battle of Actual vs. Altered Climate Data
chubbs replied to ChescoWx's topic in Climate Change
No I can follow your argument. You are making an argument of incredularity, a common logical fallacy. You can't believe that NCEI could be right. The problem is you don't understand how adjustments are estimated. There is an easy explanation for your list of #. The 1946 and 48 moves are not the only station change at Coatesville. Other station changes occurred before 1948. Adjustments start at the present and work backwards. The most recent Coatesville 1SW data is from 1982. You have to start in 1982 and work back in time. To evaluate the adjustments you have to compare Coatesville to raw data from other stations. Station changes are identified when Coatesville doesn't match other regional stations. Coatesville results by themselves, as you have listed, don't provide any evidence about station adjustments. -
Chester County PA - Analytical Battle of Actual vs. Altered Climate Data
chubbs replied to ChescoWx's topic in Climate Change
You don't understand how adjustments work. A single station move triggers adjustments for every year before the move. The City of Coatesville was warmer than Doe Run Road in 1946, 1945 , 1944, 1943 and so on. Clearly seen from the chart. That's how we know the cooling was move-related. The effect is persistent.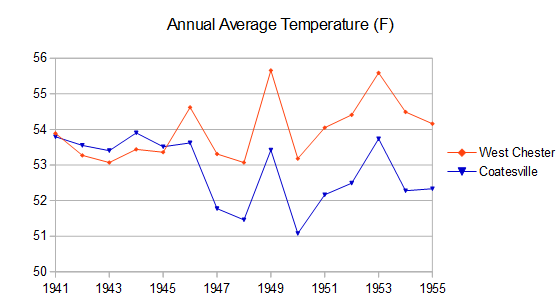
-
Chester County PA - Analytical Battle of Actual vs. Altered Climate Data
chubbs replied to ChescoWx's topic in Climate Change
NCEI uses a proven scientific procedure to find inconsistencies between stations in the raw data. All the adjustments come directly from the raw data. There is no human intervention during the adjustment process. As an example, easy to see the impact of the two Coatesville moves in 1946 and 1948. Easy for most people that is. These charts are all posted upthread. 1945 site 1948 and later site
-
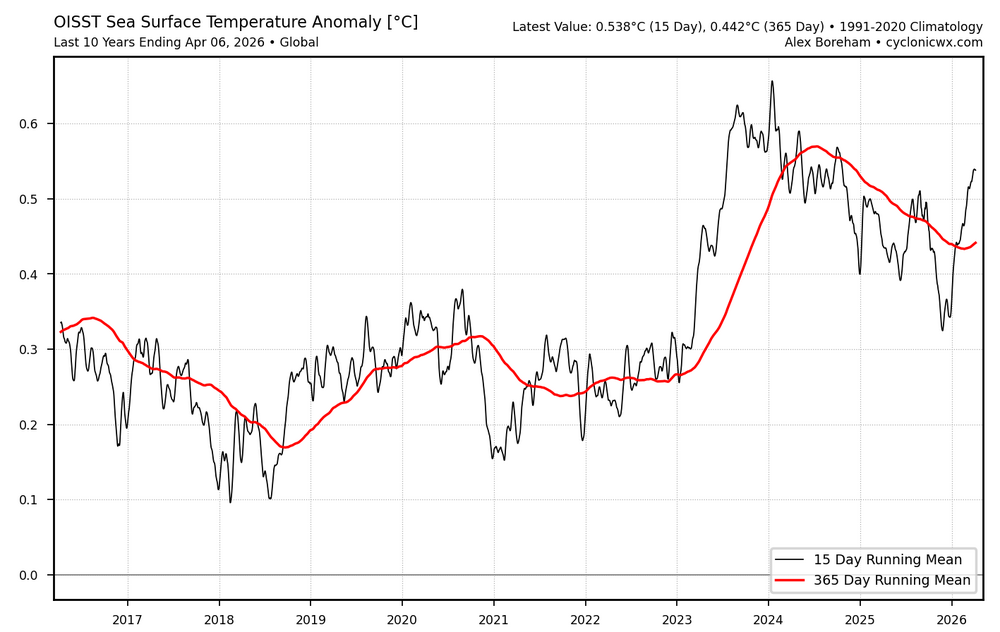
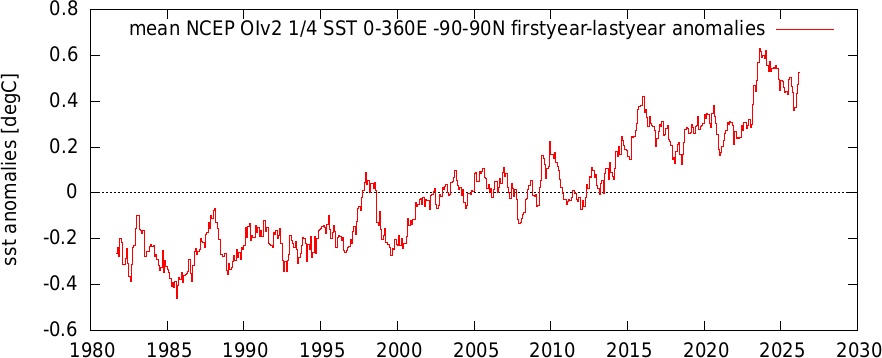
Another perspective on global oisst. So far this year looks a lot like 2023, which had a large rise in SST at the very beginning of the nino cycle. This year started its rapid rise even earlier around New Years. https://cyclonicwx.com/sst/
-
Linked the Geological Society of London's 2021 review article on climate change in the geological record. Observations from the geological record show that atmospheric CO2 concentrations are now at their highest levels in at least the past 3 million years. Furthermore, the current speed of human-induced CO2 change and warming is nearly without precedent in the entire geological record, with the only known exception being the instantaneous, meteorite-induced event that caused the extinction of non-bird-like dinosaurs 66 million years ago. https://www.lyellcollection.org/doi/full/10.1144/jgs2020-239
-
Developing consensus is key part of the scientific process. Below is the leading paragraph of the Wikipedia entry on scientific consensus. Scientists are well aware of the scientific consensus in their field. They have to know the current state of knowledge to advance further. In the case of climate change, with high impact and a wide range of scientific disciplines, there are also governmental and technical organization activity to help develop and document the scientific consensus. IPCC is the leading example but there are many others. I encourage you to look at IPCC reports (link below). Most of our debates on this forum can be traced back to a lack of awareness of the scientific consensus. Often we are arguing about things that were settled decades ago. Scientific consensus is the collective judgment, position, and opinion of the vast majority of active, qualified experts on a conclusion in a specific scientific discipline.[1] Scientific consensus results from the self-correcting scientific process of peer review, replication of the event through the scientific method, scholarly debate, meta-analysis, and publication of high-quality review articles, monographs, or guidelines in reputable books and journals to establish facts and durable knowledge about the topic.[2][3] https://en.wikipedia.org/wiki/Scientific_consensus https://www.ipcc.ch/assessment-report/ar6/
-
The entire climate sensitivity range is the scientific consensus. By excluding most of the likely range, Spencer severely underestimates climate risk. There is low and diminishing technical support for low climate sensitivity. Spencer's views are inconsistent with the temperature rise we have already experienced. Other arguments against low sensitivity include: large and increasing earth energy imbalance and the growing consensus on positive cloud feedback. The scientific consensus is that the long list of CO2/warming debits far outweigh a couple of benefits.
-
Spencer is a long time critic of the scientific consensus on climate change. Its not that hard to predict the impact of adding greenhouse gases to the atmosphere. We have warmed pretty much as expected, much faster than Spencer acknowledged or expected. The scientific consensus does not describe the warming we have experienced as slow or beneficial. Agree politics is important as is the action of powerful interest groups. Its the reason why most people don't have an accurate picture of what climate science is saying. Don't think Spencer has been helpful in that regard.
-
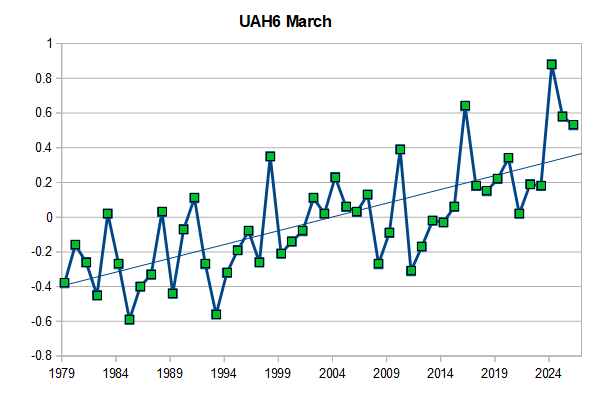
A couple of comments: 1) Yes, Roy is a long time climate dismissive 2) His dataset misses much of the warming in the early 2000s, 3) Best to look at the globe as a whole to judge warming, 4) Global UAH is more sensitive to ENSO than surface temperatures.5) Global UAH was very warm for a La Nina in March, the first La Nina well above the linear trend. We've reached the La Nina bottom in UAH. A typical nino spike in UAH from these levels would be hard to dismiss.
-
Another issue: the shelters 100 years ago were not aspirated. Inadequate or poorly sited shelter ran warm. With his number of days metric easy for one or two sites with bad data to bias the result. We saw that in the Chester county, where spuriously warm data from Phoenixville in the 1930s and 1940s biased the >95F day data, by providing the overwhelming majority of the County 95F+ days in that period. Better to show the data for every station like chart below. That way a few bad apples don't skew the data. Threadx cities plotted below have the longest climate records.
-
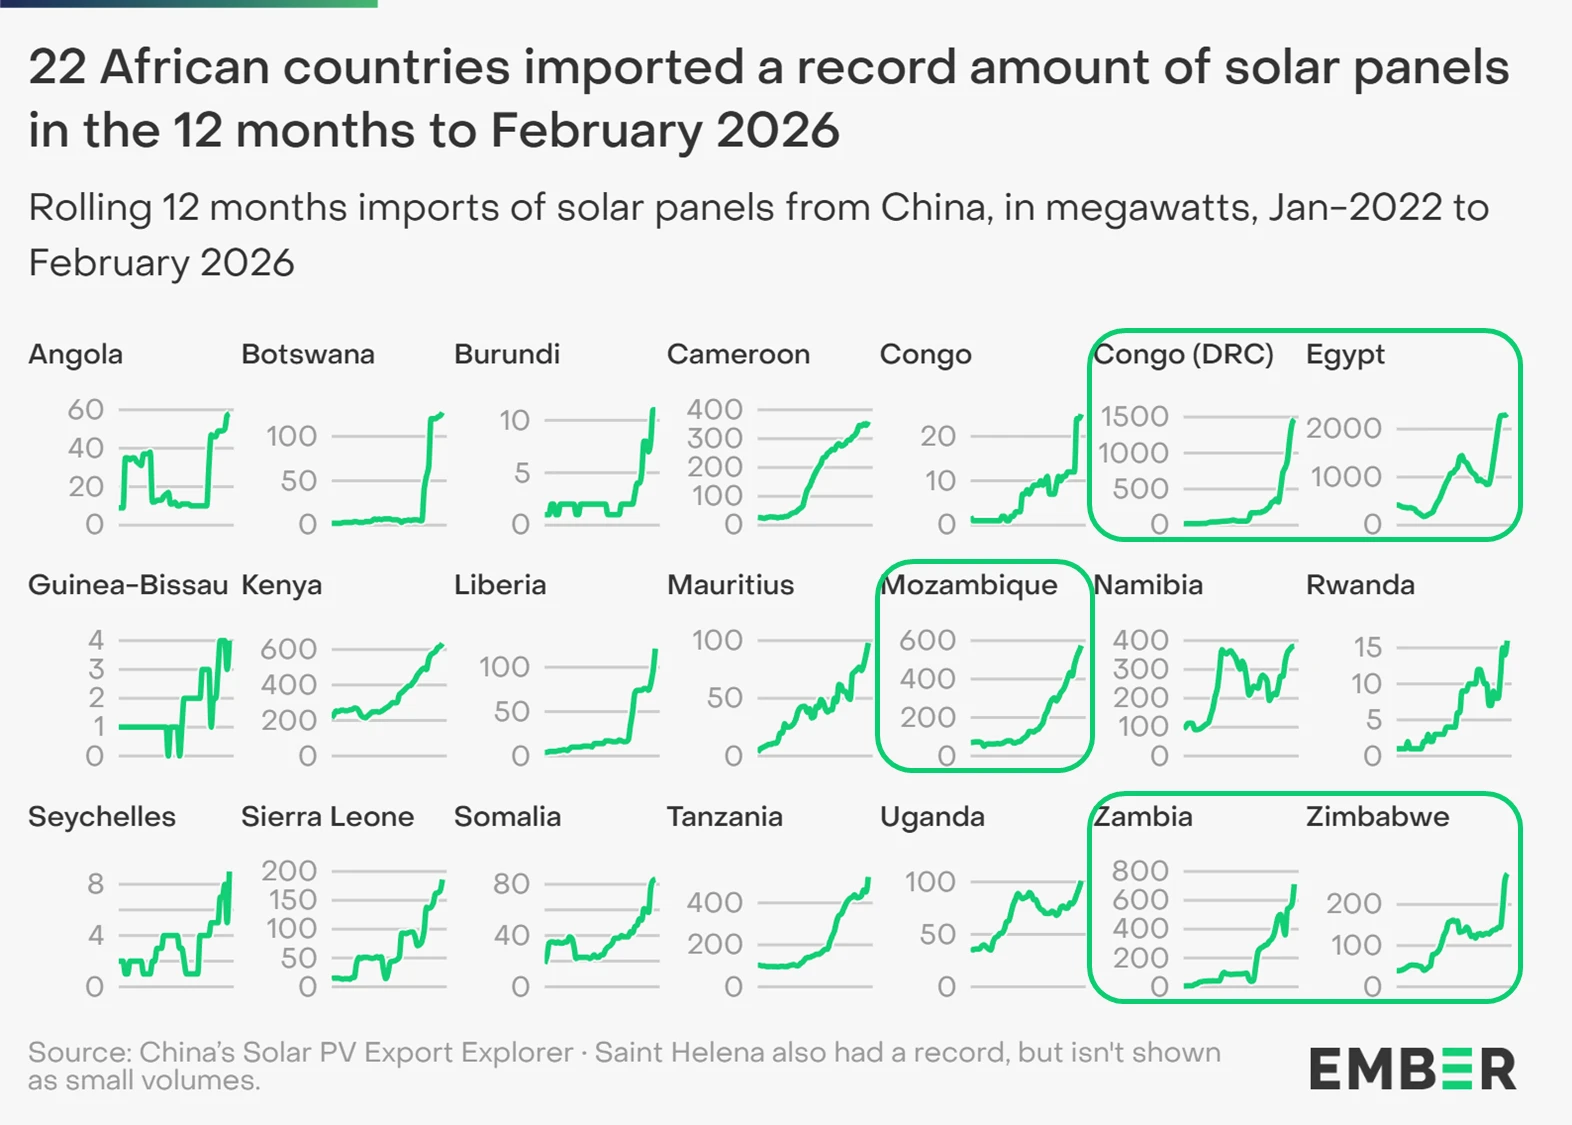
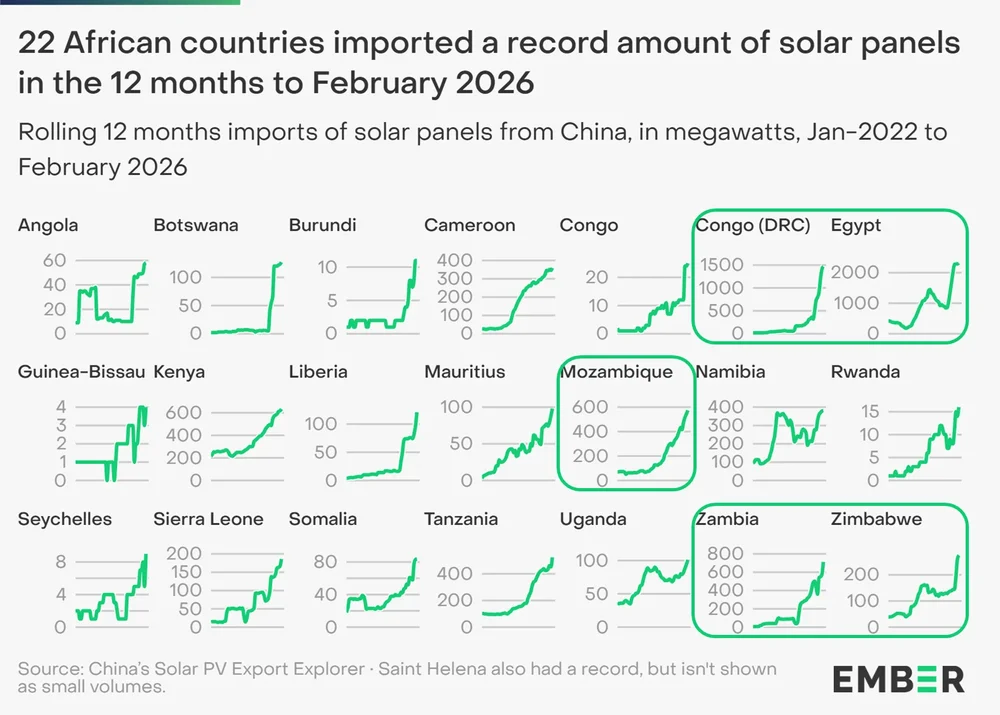
Solar uptake continued to accelerate in Africa in the last month before the energy crisis.
-
Chester County PA - Analytical Battle of Actual vs. Altered Climate Data
chubbs replied to ChescoWx's topic in Climate Change
Yes, here's a good example of cherry picking. Do you have any specific technical complaints? I'll be adding other stations; but, why would the results change?. The other stations all have much shorter record lengths. Plus the modern stations are all warming rapidly in complete agreement with the Coatesville and Phoenixville data.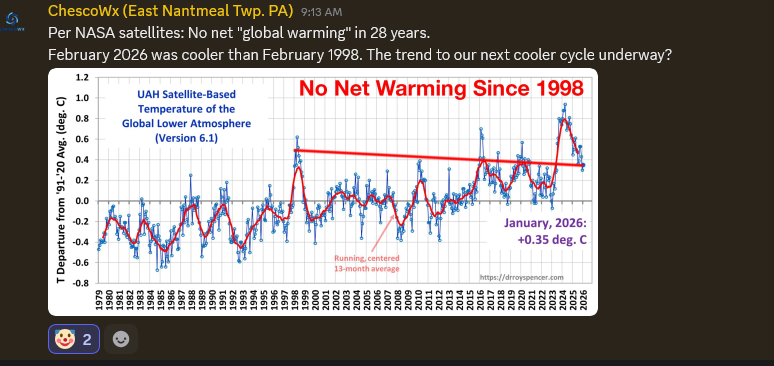
-
a Here's another perspective on the oiSST data which shows the similarity to 2023. The last data point is March to date.
-
Chester County PA - Analytical Battle of Actual vs. Altered Climate Data
chubbs replied to ChescoWx's topic in Climate Change
OK I took an initial stab at consolidating the data using Chester County's 3 long-term COOP stations. My consolidation doesn't look at all like your "analytics". Why? I only use periods without major station moves: 1949-2025 for Coatesville and Phoenixville and 1894-1969 for West Chester. I also use the 1949-1969 overlap period to take out the temperature difference between the 3 stations. While it doesn't look like your "analytics", my consolidation is a good match to the data collected at individual Chester County stations, posted above. That's gives my confidence in this approach and I plan to extend this method to the rest of the data.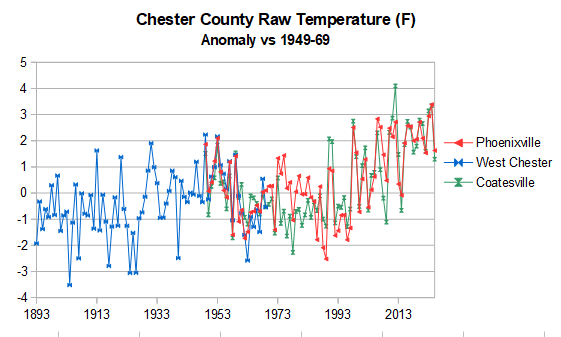
-
Daily oisst has moved into record territory, continuing to track 2023; but 0.1 - 0.2C warmer. It is likely that SST will continue to set daily records until the developing nino fades sometime in 2027.

-
Chester County PA - Analytical Battle of Actual vs. Altered Climate Data
chubbs replied to ChescoWx's topic in Climate Change
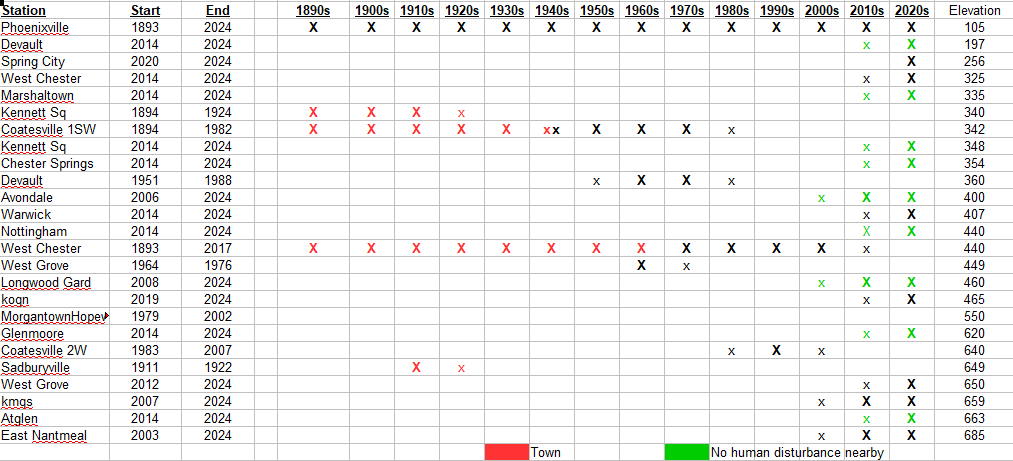
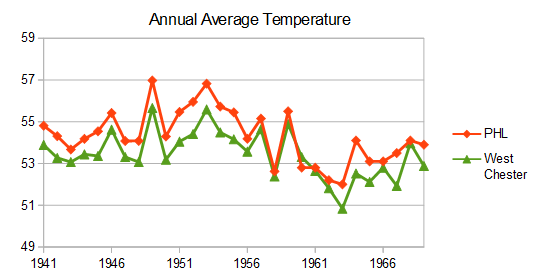
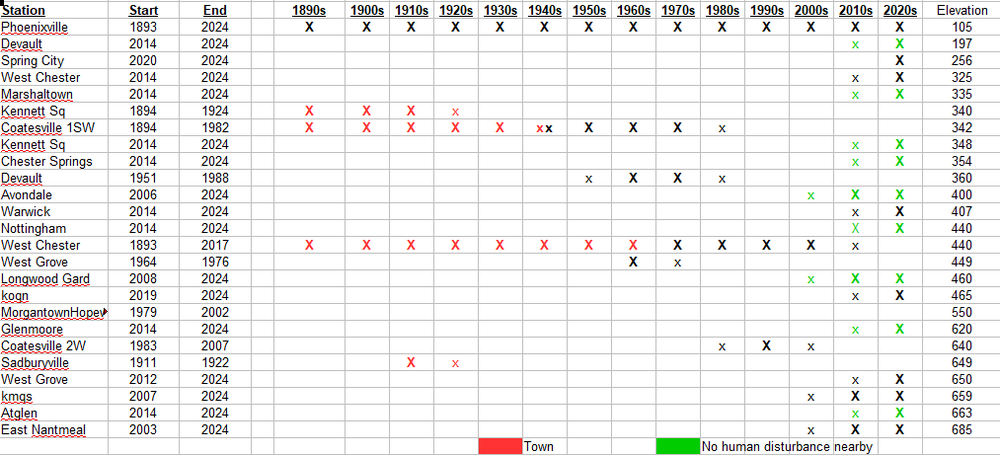
Reposting some of the charts I posted previously. Your line doesn't look anything like the raw data from individual stations. There is no significant difference in warming between individual Chester County stations and the Philadelphia Airport. Of course cooling station moves should be excluded. That's why the West Chester plot ends in 1969. Per the table below, there are big changes in the Chester County station population that you aren't accounting for. In comparison, the Philadelphia airport heat island is mature and isn't changing much from decade to decade. If heat island is important, why ignore the movement of Chester County stations out of towns after World War II?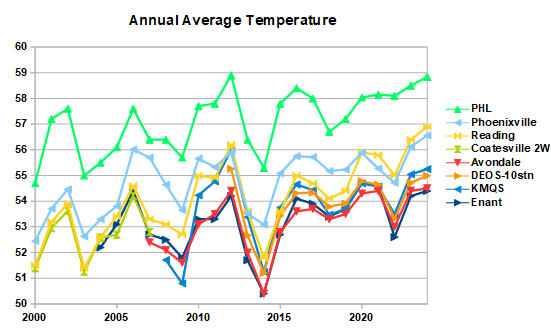
-
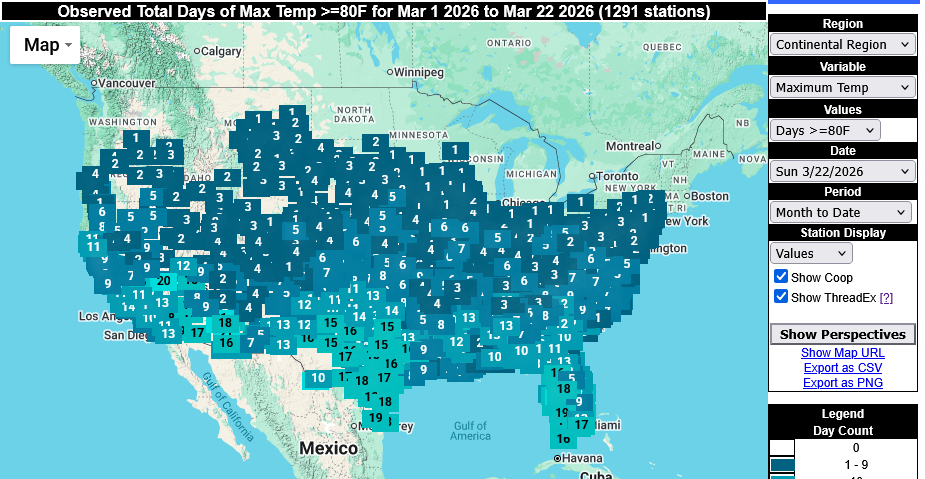
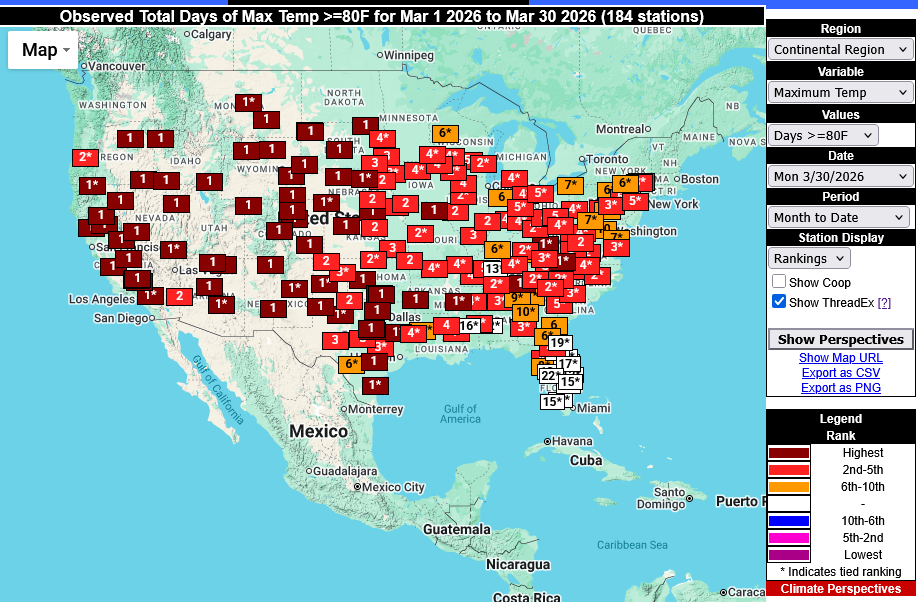
I should have been clearer. The chart I posted is the ranking of the number of days over 80, with #1 being the highest. Below is the number of 80+ days on which the ranking is based.