
40/70 Benchmark
-
Posts
78,572 -
Joined
-
Last visited
Content Type
Profiles
Blogs
Forums
American Weather
Media Demo
Store
Gallery
Everything posted by 40/70 Benchmark
-

12/20-21 Clipper/Coastal Nowcast and Obs
40/70 Benchmark replied to Boston Bulldog's topic in New England
This is why my area has struggled so much over the last 8 years or so.....big coastals are hit or miss here, but SWFE are my bread and butter, but they have been noticeably absent due to the lack of favorably positioned/timed +PP. CJs are of course 95% misses. -
December 2024 - Best look to an early December pattern in many a year!
40/70 Benchmark replied to FXWX's topic in New England
You have no snow at all? I see the grass through it, but there is at least a covering... -
December 2024 - Best look to an early December pattern in many a year!
40/70 Benchmark replied to FXWX's topic in New England
Ditto....now watch the XMAS eve snow be north of me. Like clockwork- -
December 2024 - Best look to an early December pattern in many a year!
40/70 Benchmark replied to FXWX's topic in New England
I'd be absolutely elated with 2" on Xmas eve.....been so busy lately, which is why I kind of half-assed yesterday's deal. -
December 2024 - Best look to an early December pattern in many a year!
40/70 Benchmark replied to FXWX's topic in New England
WIlly Mo Pena is another comp.... -
That would be cute with my locale sitting at 1.5" on the year. Caught in the oscillation where I'm either not close enough to the ocean or too far north, or too close to the ocean and too far south. Earlier in the season was the latter, yesterday the former and that would be the latter yet again.
-
12/20-21 Clipper/Coastal Nowcast and Obs
40/70 Benchmark replied to Boston Bulldog's topic in New England
I remember that...January 2009....we met up for the first time shortly thereafter. -
Well, its no big deal when they are this weak...
-
I will be away in the hospital and we'll probably get 3' in Methuen.
-
12/20-21 Clipper/Coastal Nowcast and Obs
40/70 Benchmark replied to Boston Bulldog's topic in New England
I have 1.5" on the season... -
12/20-21 Clipper/Coastal Nowcast and Obs
40/70 Benchmark replied to Boston Bulldog's topic in New England
.5" -
12/20-21 Clipper/Coastal Nowcast and Obs
40/70 Benchmark replied to Boston Bulldog's topic in New England
Yea, looks great in Chelsea...at least weatherwise... -
12/20-21 Clipper/Coastal Nowcast and Obs
40/70 Benchmark replied to Boston Bulldog's topic in New England
I think I look good for an inch or two...sharp cut off, though. The extra latitude from Wilmington here is almost always useless and hurts more than it helps. -
12/20-21 Clipper/Coastal Nowcast and Obs
40/70 Benchmark replied to Boston Bulldog's topic in New England
I wiped my a$$ with those models showing this area as ground zero for the CJ...I know the climo too well. -
12/20-21 Clipper/Coastal Nowcast and Obs
40/70 Benchmark replied to Boston Bulldog's topic in New England
I'll be lucky to see an inch or two....ready to bend over and grab the ankles, per usual...always either north or south. -
Snowing steadily in Chelsea, but not sticking well...sweet spot was about Everett...bit cooler and cars covered. Then hit Medford and bare ground..hardly snowing
-
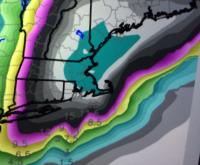
Man, I deserve a gradient like that with those just noth getting porked...inverse of what has played out so often over the past severl years.
-
Been a while with the wife 9 months preggars...
-
Wow...sit back and watch, I guess-
-
I hope for an inch or two, but I think most accumulation wilk be south of me.
-
29 with a good N breeze at home...jumped to about 34 on the ride in near rt 128. Snowing steadily now at work in Chelsea.
-
F....M.....L
-
Agree...I'd favor near a bit south of me closer to Wilmington.
-
Later that year we had 2nd most positive bust on 12/23/1997.


