All Activity
- Past hour
-

July 2025 Obs/Disco ... possible historic month for heat
ineedsnow replied to Typhoon Tip's topic in New England
Tsunami warning for Hawaii now -

July 2025 Obs/Disco ... possible historic month for heat
Baroclinic Zone replied to Typhoon Tip's topic in New England
https://earthquake.usgs.gov/earthquakes/eventpage/us6000qw60/executive
-
July 2025 Obs/Disco ... possible historic month for heat
ineedsnow replied to Typhoon Tip's topic in New England
Tsunami watch issued for the west coast -
Goodbye, Hawai'i.
-

July 2025 Obs/Disco ... possible historic month for heat
kdxken replied to Typhoon Tip's topic in New England
Which makes it a top tener all time. If the interweb is correct. -
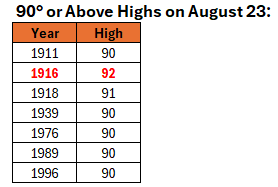
 Historic frequency of 90° or above days at New York City (Central Park): August 23 is a statistical oddity with just 7 cases on which the temperature reached 90° or above. Only June 2-4 during summer had a similar or lower percentage of 90° days. September 7 was the next day with a similar figure. Then, the next similar or lower figure occurred on September 12.
-

Chester County PA - Analytical Battle of Actual vs. Altered Climate Data
chubbs replied to ChescoWx's topic in Climate Change
Meh. There isn't a big difference in the 2000-25 warming rate between Philadelphia and Phoenixville: 1.00 deg/decade for Phoenixville and 1.05 deg/decade for PHL. The difference is only 5% of the warming rate and is probably not statistically significant.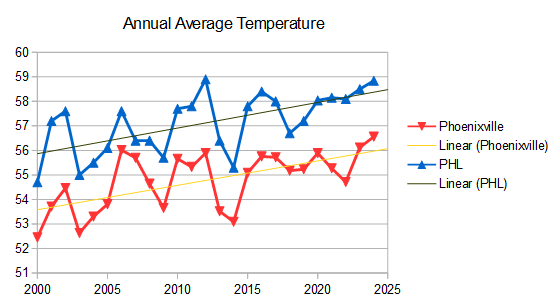
-

July 2025 Obs/Disco ... possible historic month for heat
bobbutts replied to Typhoon Tip's topic in New England
It's pretty wild how cold it is getting out of Lake Tahoe on a hot summer day with that desert dry air and consistent breeze. Been decades but I won't forget that. -
July 2025 Obs/Disco ... possible historic month for heat
ineedsnow replied to Typhoon Tip's topic in New England
updated to 8.7 -
Highs: TEB: 101 EWR: 101 LGA: 100 ACY: 98 PHL: 98 NYC: 97 New Brnswck: 97 BLM: 97 ISP: 96 JFK: 96 TTN: 95
-
July 2025 Obs/Disco ... possible historic month for heat
ineedsnow replied to Typhoon Tip's topic in New England
uttt oh https://www.ndbc.noaa.gov/ -

July 2025 Discussion-OBS - seasonable summer variability
SACRUS replied to wdrag's topic in New York City Metro
Highs: TEB: 101 EWR: 101 LGA: 100 ACY: 98 PHL: 98 NYC: 97 New Brnswck: 97 BLM: 97 ISP: 96 JFK: 96 TTN: 95 -
Chester County PA - Analytical Battle of Actual vs. Altered Climate Data
chubbs replied to ChescoWx's topic in Climate Change
Nice cherry pick among the DEOS. Per chart below, there is no difference warming between the 11 DEOS stations as a whole and the Philadelphia Airport. Some are warming faster than PHL and some slower. The warming rate for the DEOS stations in the 2012 and 2024 period, when all stations were active, is 1.17F per decade. The rate for the Philadelphia Airport is 1.15F/decade. Note that the airport had a warm sensor issue in 2022, which caused a one year spike in temperatures vs other regional station. That's not a heat island effect, since it disappeared in 2023. In any case the 11 DEOS stations and the Avondale USCRN station show conclusively that Chester County is warming rapidly in recent years, over 1F per decade. Can't blame it on heat island effects either. The stations are all remote.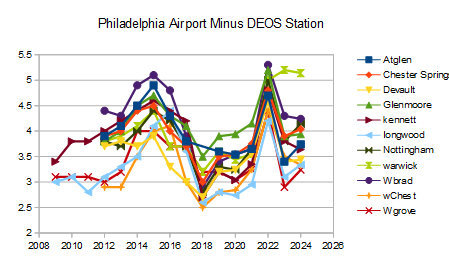
-

July 2025 Obs/Disco ... possible historic month for heat
Damage In Tolland replied to Typhoon Tip's topic in New England
Hunker in -
 Euro has it mostly out of here by midday now
 -
July 2025 Obs/Disco ... possible historic month for heat
ineedsnow replied to Typhoon Tip's topic in New England
BULLETIN TSUNAMI MESSAGE NUMBER 1 NWS PACIFIC TSUNAMI WARNING CENTER HONOLULU HI 133 PM HST TUE JUL 29 2025 TO - EMERGENCY MANAGEMENT IN THE STATE OF HAWAII SUBJECT - TSUNAMI WATCH A TSUNAMI WATCH IS ISSUED FOR THE STATE OF HAWAII EFFECTIVE AT 0133 PM HST. AN EARTHQUAKE HAS OCCURRED WITH THESE PRELIMINARY PARAMETERS ORIGIN TIME - 0125 PM HST 29 JUL 2025 COORDINATES - 52.2 NORTH 160.0 EAST LOCATION - OFF THE EAST COAST OF KAMCHATKA RUSSIA MAGNITUDE - 8.0 MOMENT EVALUATION BASED ON ALL AVAILABLE DATA A TSUNAMI MAY HAVE BEEN GENERATED BY THIS EARTHQUAKE THAT COULD BE DESTRUCTIVE ON COASTAL AREAS EVEN FAR FROM THE EPICENTER. AN INVESTIGATION IS UNDERWAY TO DETERMINE IF THERE IS A TSUNAMI THREAT TO HAWAII. IF TSUNAMI WAVES IMPACT HAWAII THE ESTIMATED EARLIEST ARRIVAL OF THE FIRST TSUNAMI WAVE IS 0717 PM HST TUE 29 JUL 2025 FURTHER MESSAGES WILL BE ISSUED HOURLY OR SOONER AS CONDITIONS WARRANT UNTIL THE THREAT TO HAWAII HAS PASSED. -
July 2025 Obs/Disco ... possible historic month for heat
ineedsnow replied to Typhoon Tip's topic in New England
Tsunami watch in Hawaii caused by a 8.0 earthquake woah -
July 2025 Obs/Disco ... possible historic month for heat
kdxken replied to Typhoon Tip's topic in New England
Self-explanatory. 23.41 38.18 47.38 58.16 68.63 73.98 M M M M M - Yesterday
-
.thumb.png.4150b06c63a21f61052e47a612bf1818.png)
July 2025 Obs/Disco ... possible historic month for heat
HIPPYVALLEY replied to Typhoon Tip's topic in New England
Sahara like? -
July 2025 Obs/Disco ... possible historic month for heat
ineedsnow replied to Typhoon Tip's topic in New England
https://mesonet.agron.iastate.edu/sites/monthlysum.php?station=ORE&network=MA_ASOS -
July 2025 Obs/Disco ... possible historic month for heat
kdxken replied to Typhoon Tip's topic in New England
What am I looking at? Did the heat get to you? -

July 2025 Obs/Disco ... possible historic month for heat
weatherwiz replied to Typhoon Tip's topic in New England
wtf is this -
July 2025 Obs/Disco ... possible historic month for heat
kdxken replied to Typhoon Tip's topic in New England
Fake fake fake fake fake. -
July 2025 Obs/Disco ... possible historic month for heat
kdxken replied to Typhoon Tip's topic in New England
-
July 2025 Obs/Disco ... possible historic month for heat
ineedsnow replied to Typhoon Tip's topic in New England
2023 32.26 29.55 35.79 49.22 55.53 65.68 74.15 68.32 64.05 54.40 35.78 36.10 2024 27.39 31.34 39.50 46.48 61.31 68.98 74.29 69.24 62.88 50.74 42.37 28.29 2025 21.02 23.41 38.18 47.38 58.16 68.63 73.98 M M M M M NCEI Climatology 23.70 26.13 34.75 46.45 57.90 66.70 72.06 70.25 62.25 50.15 39.50 29.75