All Activity
- Past hour
-

E PA/NJ/DE Spring 2026 Obs/Discussion
Birds~69 replied to PhiEaglesfan712's topic in Philadelphia Region
Drought guy may be on to something...although this seems normal to me. https://www.accuweather.com/en/winter-weather/polar-vortex-aftermath-to-bring-more-chilly-may-days-to-midwest-northeast/1886949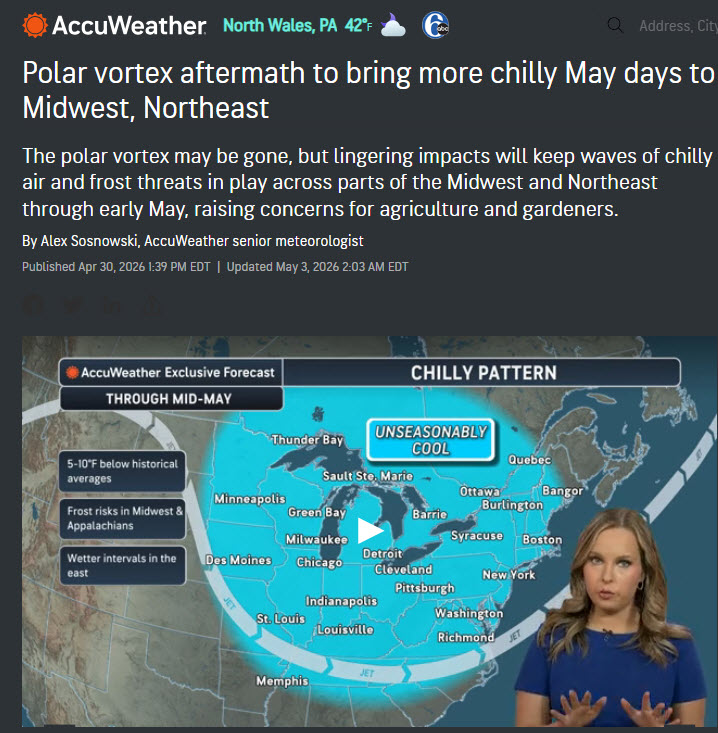
-
No AC yet here and doesnt look like we will need it for awhile.. April had a few very warm days but we also had some snow.. May will come.in below normal it looks like.. we take!
- Today
-
Must be nice not living less than 5 miles from a 45 degree ocean. Hopefully us mist weary coastal inhabitants can get some much needed relief later this week!
-

2026-2027 Strong/Super El Nino
Stormchaserchuck1 replied to Stormchaserchuck1's topic in Weather Forecasting and Discussion
Even in 23-24 the SOI didn't go very negative... it's been following the PDO in the 2020s where it's leaning positive most of the time Only 16 months of -SOI since July 2020. 77% +SOI during that time Everyone was saying early in the year where we can't have a Strong Nino so close to the last Strong Nino since ENSO is at least partially about balance. Check out this RONI streak.. we are evening this out, imo -

2026-2027 Strong/Super El Nino
jaxjagman replied to Stormchaserchuck1's topic in Weather Forecasting and Discussion
Yes,im not sure even MV does maint on his sites anymore,but i still use it,so it could be wrong for sure -
2026-2027 Strong/Super El Nino
jaxjagman replied to Stormchaserchuck1's topic in Weather Forecasting and Discussion
This has been what the JMA has been showing and the folllowing year generally leads back into a NINA the following winter -

2026-2027 Strong/Super El Nino
GaWx replied to Stormchaserchuck1's topic in Weather Forecasting and Discussion
Agreed and Jax made the correction. But it’s too bad that the monthly updates have stopped. In other ENSO news, I still find it interesting that this sharp warming is occurring without a sustained or notably strong -SOI. We’ve had only short periods of strong -SOI so far and I see no long ones over the next week or so. Some negatives sure, but.. -

2026-2027 Strong/Super El Nino
snowman19 replied to Stormchaserchuck1's topic in Weather Forecasting and Discussion
Lol No chance that this is going to be another -QBO winter. In other news, consensus on a +IOD forming over the next couple of months -
2026-2027 Strong/Super El Nino
jaxjagman replied to Stormchaserchuck1's topic in Weather Forecasting and Discussion
Seemingly or more likely we are headed towards a EQBO,i still think there would be little sample size what this winter will be,but more than likely as some of maps shown above,who knows maybe we will get suprised(ducking)..lol Edit:meant westerly WQBO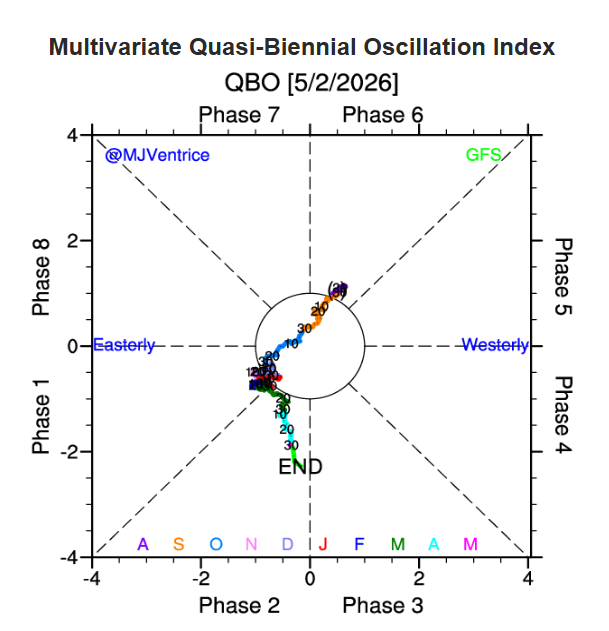
-
2026-2027 Strong/Super El Nino
Stormchaserchuck1 replied to Stormchaserchuck1's topic in Weather Forecasting and Discussion
Yeah let's see if the STJ juices up this year with cold ENSO background state probably still in effect. 23-24 Winter was very wet but Nov 2023 was extremely dry -
2026-2027 Strong/Super El Nino
GaWx replied to Stormchaserchuck1's topic in Weather Forecasting and Discussion
Ooops, Chuck, sorry, I misunderstood you in my prior post. I misinterpreted that you were saying strong STJ as opposed to strong La Niña STJ pattern meaning, the opposite, a very weak STJ. -
E PA/NJ/DE Spring 2026 Obs/Discussion
Birds~69 replied to PhiEaglesfan712's topic in Philadelphia Region
46f, 12AM...windows open, I think I heard the ice cream truck guy? -
2026-2027 Strong/Super El Nino
Stormchaserchuck1 replied to Stormchaserchuck1's topic in Weather Forecasting and Discussion
Yeah -- it was pretty close to a uniform La Nina pattern last Winter in the US. Combine that with pre-El Nino conditions for the year after, and you have about a perfect composite. -
2026-2027 Strong/Super El Nino
GaWx replied to Stormchaserchuck1's topic in Weather Forecasting and Discussion
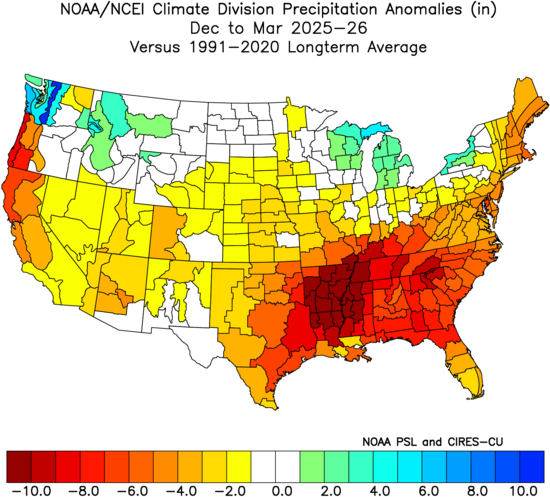
The reds are actually BN, not AN. I know, kind of strange coloring. The SE drought was/is bad due largely to the very dry winter. -
It doesn't matter if it's 134 years of climate data from Gibson County, Indiana. It is just one of the 3143 counties in the United States that you are trying to use as the lens from which to view global climate change from. You don't get the right to say that I'm cherrypicking when that is the flimsy pedestal you're standing on.
-
2026-2027 Strong/Super El Nino
Stormchaserchuck1 replied to Stormchaserchuck1's topic in Weather Forecasting and Discussion
I didn't realize it was such a strong La Nina STJ pattern -

2026-2027 Strong/Super El Nino
40/70 Benchmark replied to Stormchaserchuck1's topic in Weather Forecasting and Discussion
You can generate on these two sites using ERA 5 dataset, Chuck....only issues are that the time periods are more restricted...ie I can't do DJFM, and there are no daily options....ie March 10-25, etc... -
2026-2027 Strong/Super El Nino
jaxjagman replied to Stormchaserchuck1's topic in Weather Forecasting and Discussion
i did some research a couple days ago how a strong Nino effects our area or region.In general Dec can have some strong tornadoes which surprised me because we dont see this in NINO into winter,in Jan along the Appalachian Mountains has flooding and a freak IP/SN happens in Feb Edit:Other wise its going to be AN with with temps -
2026-2027 Strong/Super El Nino
Stormchaserchuck1 replied to Stormchaserchuck1's topic in Weather Forecasting and Discussion
Maybe I'm missing something but we still don't have H5 monthlies? -
Snow showers up here today
-
2026-2027 Strong/Super El Nino
40/70 Benchmark replied to Stormchaserchuck1's topic in Weather Forecasting and Discussion
Oh, wow...I didn't think those went past early March, like the H5 stuff.....awesome. Issue is just H5 dailies, then -
2026-2027 Strong/Super El Nino
GaWx replied to Stormchaserchuck1's topic in Weather Forecasting and Discussion
What about these? I’m going to delete them soon due to big size taking up too much of my attachments space: https://psl.noaa.gov/data/usclimdivs/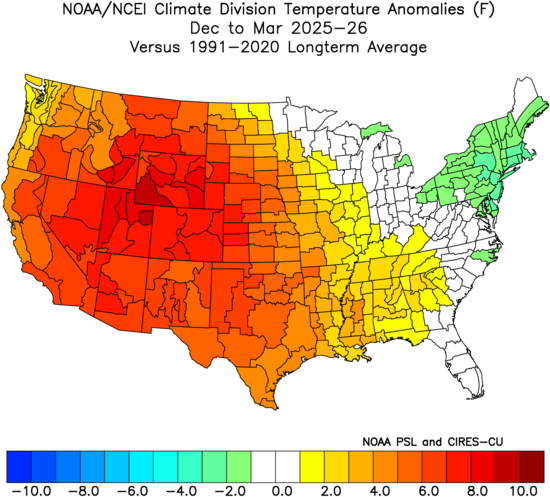
-
Officially a trace of snow at PIT today.
-
2026-2027 Strong/Super El Nino
40/70 Benchmark replied to Stormchaserchuck1's topic in Weather Forecasting and Discussion
These are the best I have for monthly composites right now.. https://climatereanalyzer.org Alternatively, you can also still use PSL by drawing upon the ERA 5 dataset, since NCAR was discontinued in March....my problem is that you can't use ERA 5 to generate daily maps here: https://psl.noaa.gov/data/composites/day/ You also can't get degrees F and precipitation in inches using ERA 5. So I am seeking an alternative to generate those maps as to now be relegated to monthly data using degrees Kelvin and measuring precipitation in mm moving forward. -
2026-2027 Strong/Super El Nino
jaxjagman replied to Stormchaserchuck1's topic in Weather Forecasting and Discussion
I understand,i'd like to see it also myself..lol