All Activity
- Past hour
-
Yes this is why our summer heat hasn't been as extreme as it was during the 1930s-1950s and during the 1990s either.
-
I know but the number of 100 degree days from the 1930s through the 1950s and the number of years with 100 degree days is far in excess of anything we had before or since so that is probably cyclical, I wonder when we will see a return to that kind of heat again?
-
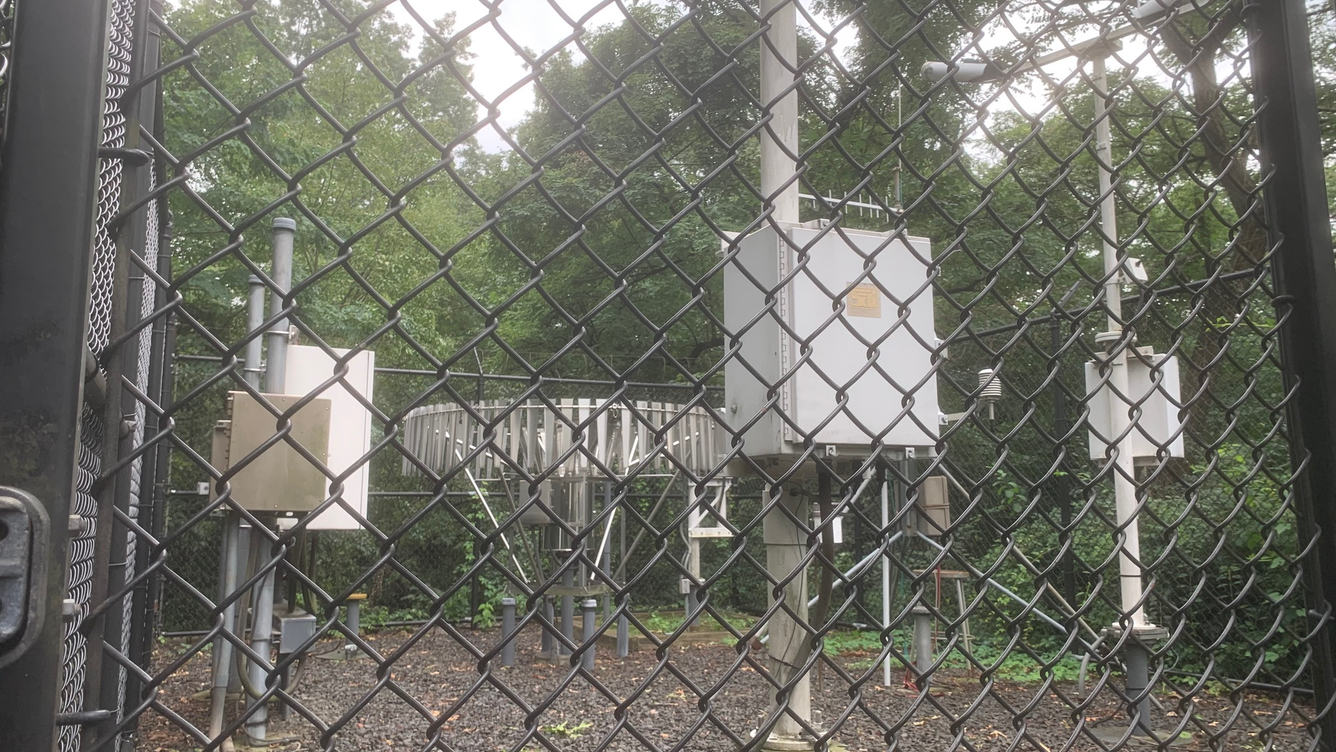
The decline of NYC 100° temperatures since the ASOS was installed under the trees in 1995 is all about the incorrect sitting and not about cycles. 2021 1921

-
They should have done a tally by decade, so I'll try to do that myself. Number of 100+ days per decade / number of years with 100+ days per decade 1880s : 1 / 1 1890s : 1 / 1 1900s : 2 / 1 1910s : 3 / 3 1920s : 2 / 2 1930s : 8 / 5 1940s : 8 / 3 1950s : 12 / 5 1960s : 4 / 1 1970s : 3 / 1 1980s : 2 / 1 1990s : 8 / 4 2000s : 1 / 1 2010s : 5 / 3 Doing this tally I'm a little shocked how many 100 degree days had between the 1930s and the 1950s and despite the enormous exception of 1966 which had 4 of them (the only 4 of that entire decade!) a big downturn in 100+ degree days began during the 1960s which only spiked again in the 1990s before resuming the downward trend. The early 2010s were an exception of course. There is obviously something cyclical going on here. No other way to explain what happened during the 1930s-1950s period. And how quiet it was both before and after that. And look at how both the 1930s and the 1950s had half of their years (5) hitting 100+ -- that has never been matched either!
-
eh to be fair Chris, 50% more is somewhat more than slight (9 to 6) 1993 had slightly more than 1949 did though (9 to 8)
-
and 1949 somehow had 8 in EWR and 5 99+ days at NYC, wow
-
For totals on 100° days 1993 had a slight edge on 2022. Data for January 1, 1993 through December 31, 1993 days reaching 100° Click column heading to sort ascending, click again to sort descending. NEWARK LIBERTY INTL AP WBAN 9 Newark Area ThreadEx 9 WAYNE COOP 5 LODI COOP 4 BELLEPLAIN STA FOREST COOP 3 TUCKERTON 2 NE COOP 3 WOODSTOWN PITTSGROV 4E COOP 3 INDIAN MILLS 2 W COOP 3 TOMS RIVER COOP 3 EWING 3 WNW COOP 3 TETERBORO AIRPORT WBAN 3 Trenton Area ThreadEx 3 Data for January 1, 2022 through December 31, 2022 days reaching 100° Click column heading to sort ascending, click again to sort descending. NEWARK LIBERTY INTL AP WBAN 6 Newark Area ThreadEx 6 FREEHOLD-MARLBORO COOP 5 SOMERSET AIRPORT WBAN 5 CANOE BROOK COOP 4 HARRISON COOP 4 SOUTH JERSEY REGIONAL AIRPORT WBAN 3
-
Warmer air will move into the region for tomorrow. The temperature will apporach or reach 80° in New York City. This week's warmth will peak on Thursday with temperatures reaching the upper 80s across the region. A few areas could reach or exceed 90°. The arrival of this warmth will mark the start of a sustained period of above normal temperatures. No exceptional heat appears likely through the first three weeks of June. However, that will likely change shortly afterward. Excessive heat is possible starting early next week. The magnitude of the heat remains to be resolved among the guidance. The ENSO Region 1+2 anomaly was +0.5°C and the Region 3.4 anomaly was 0.0°C for the week centered around June 11. For the past six weeks, the ENSO Region 1+2 anomaly has averaged +0.30°C and the ENSO Region 3.4 anomaly has averaged -0.05°C. Neutral ENSO conditions will likely continue through at least late summer. The SOI was -7.94 yesterday. The preliminary Arctic Oscillation (AO) was +1.216 today. Based on sensitivity analysis applied to the latest guidance, there is an implied 77% probability that New York City will have a warmer than normal June (1991-2020 normal). June will likely finish with a mean temperature near 73.7° (1.7° above normal).
-
Don't expect it.
-
Meso guidance all has been suggesting any rain or storms we get is after 0z. Marine wedge hangs tougher in June than it does in freaking February…
-
Here are all of NYC 100+ days. I find it somewhat ironic that the first recorded 100 degree day (in 1881) was also the latest it's ever happened, 101 on September 7th. https://www.weather.gov/media/okx/Climate/CentralPark/100DegreeDays.pdf 100 Degree Day Information at Central Park (1869 to Present) Last Updated: 1/22/25 100 Degree Facts * Highest Ever Recorded: 106 on July 9, 1936 Most Days by Month: June 3 + July 42 + August 13 + September 2 = Total 60 days Most in one year: 4 (1966 and 1953) Most consecutive 100 degree days: 3 July 8-10, 1993 & August 26-28, 1948 Last time had 100 degree day in September: the 2nd in 1953 (102) Last time had 100 degree day in August: the 9th in 2001 (103) Last time had 100 degree day in July: the 18th in 2012 (100) Last time had 100 degree day in June: the 27th in 1966 (101) 100 degree days before 1900: Sept 7, 1881 (101) and July 31, 1898 (100) All 100 Degree Days Year Date / Temperature (°F) 2012 Jul 18/ 100 2011 Jul 22/ 104 Jul 23/ 100 2010 Jul 6/ 103 Jul 7/ 100 2001 Aug 9/ 103 1999 July 5/ 101 July 6th / 101 1995 July 15/ 102 1993 July 8/ 100 July 9/ 101 July 10/ 102 1991 July 20/ 100 July 21/ 102 1980 July 20/ 101 July 21/ 102 1977 July 18/ 100 July 19/ 102 July 21/ 104 1966 June 27/ 101 July 2/ 100 July 3/ 103 July 13/ 101 1957 July 21/ 100 July 22/ 101 1955 July 22/ 100 Aug 2/ 100 Aug 5/ 100 1954 July 14/ 100 July 31/ 100 1953 July 17/ 100 July 18/ 101 Aug 31/ 100 Sep/ 102 1952 June 26/ 100 1949 July 4/ 102 Aug 9/ 100 1948 Aug 26/ 103 Aug 27/ 101 Aug 28/ 100 1944 Aug 4/ 100 Aug 5/ 101 Aug 11/ 102 1937 July 9/ 100 July 10/ 100 1936 July 9/ 106 July 10/ 102 1934 June 29/ 101 1933 July 31/ 102 Aug/ 100 1930 July 21/ 102 1926 July 21/ 100 July 22/ 100 1918 Aug 7/ 104 1917 July 31/ 100 1911 July 3/ 100 1901 July 1/ 100 July 2/ 100 1898 July 3/ 100 1881 Sept 7/ 101
-
The warm background state caused Detroit to have its first 10 year stretch of winters without any averaging under 27°. This is directly related to how warm the CONUS, North America, and the Northern Hemisphere have become. Your local winter warm records have been more impressive than the summer ones. Nobody in the Great Lakes would ever want to see a winter warm magnitude like 23-24 was during the summer. It would probably take a megadrought like they have been experiencing out West to pull that one off. But 2016 was still your warmest summer on record for average temperatures. Summer flash flooding has been a much greater risk than drought closer to the Great Lakes. So this has been preventing such high end maximum temperature heat extremes during the warm season. I am also glad for you guys that a March 2012 level extreme hasn’t happened during July. Detroit has had 6 top 11 warmest winters since the global temperature baseline jump in 15-16 . But only 4 top 11 warmest summers since then. Time Series Summary for Detroit Area, MI (ThreadEx) DJF average temperature Click column heading to sort ascending, click again to sort descending. 2024-2025 27.5 0 2023-2024 34.9 0 2022-2023 33.4 0 2021-2022 28.0 0 2020-2021 28.5 0 2019-2020 32.5 0 2018-2019 28.9 0 2017-2018 27.4 0 2016-2017 33.0 0 2015-2016 33.5 0
-
0.65” so far here. BOS is at -0.9F for the month. That will change quite a bit in the next 10 days
-
Anyone looking forward to this heat is clinically insane
-
during the early 90s when we hadn't had any big snow seasons for over a decade, I used to go to the library and read NYT on microfiche and seasons of yore like 1947-48 and 1960-61 and 1966-67 and 1977-78
-
I like reading these, thanks.
-
They’re talking about the Thursday fail for most of SNE other than the hill Billy’s in the Berks and VT
-
Maybe they can hold together at least as regular storms to the coast? The NWS said that was a possibility (Thursday that is)
-
For NYC too, check out this old NYT article https://www.nytimes.com/1993/07/11/nyregion/heat-wave-records-rewritten-as-east-bakes-and-midwest-soaks.html
-
what's the trigger tomorrow? it's CAPEy no doubt but I thought the wfront shifts N of the region and we're just sort of neutral in the pigs bum
-
Were the total number of 100+ days (9) far in excess though? A few of them must have been in June and August in 1993.
- Today
-
Yes actually in some places it lowers the chances of big heat since it affects mins much more than it affects maxes plus more rainfall makes it much harder to have record heat in the summer here.
-
The overall monthly average high temperatures for NJ in July 2022 and 1993 were fairly close. Monthly Data for July 1993 for New Jersey Click column heading to sort ascending, click again to sort descending. WAYNE COOP 93.1 Newark Area ThreadEx 92.2 NEWARK LIBERTY INTL AP WBAN 92.2 MOORESTOWN 4 E COOP 90.9 WOODSTOWN PITTSGROV 4E COOP 90.7 CRANFORD COOP 90.7 LODI COOP 90.5 INDIAN MILLS 2 W COOP 90.4 BELLEPLAIN STA FOREST COOP 90.3 Monthly Data for July 2022 for New Jersey Click column heading to sort ascending, click again to sort descending. Newark Area ThreadEx 92.1 FREEHOLD-MARLBORO COOP 92.1 NEWARK LIBERTY INTL AP WBAN 92.1 SOMERSET AIRPORT WBAN 91.5 HIGHTSTOWN 2 W COOP 91.4 CANOE BROOK COOP 91.4 SOUTH JERSEY REGIONAL AIRPORT WBAN 91.4 HARRISON COOP 91.0 NEW BRUNSWICK 3 SE COOP 90.5 New Brunswick Area ThreadEx 90.5
-

2025-2026 ENSO
michsnowfreak replied to 40/70 Benchmark's topic in Weather Forecasting and Discussion
You missed my point. Even if a warm background state is in place it does not guarantee big heat at any individual location. I mean, good for it being 26th warmest winter for the CONUS. It wasn't anywhere near that warm here. And this summer I frankly dont care how many heat records melt away in the southwest, I just worry how much heat makes it up here. -
I just learned that the latest it ever hit 100 in NYC was on September 7th at 101, it was also the earliest it ever hit 100 in NYC because it happened in 1881 lol. We all believe in climate change but it doesn't affect every location in the same way and not all times of the year are affected in the same way either and it affects maxes and mins differently too. It's a much more complex issue than a +1.5 C rise across the board.