All Activity
- Past hour
-
BULLETIN - EAS ACTIVATION REQUESTED Flash Flood Warning National Weather Service Binghamton NY 346 PM EDT Thu Jun 26 2025 The National Weather Service in Binghamton has issued a * Flash Flood Warning for... Central Lackawanna County in northeastern Pennsylvania... * Until 645 PM EDT. * At 346 PM EDT, Doppler radar indicated thunderstorms producing heavy rain across the warned area. Between 1 and 2 inches of rain have fallen. Additional rainfall amounts up to 1 inch are possible in the warned area. Flash flooding is ongoing or expected to begin shortly. HAZARD...Flash flooding caused by thunderstorms. SOURCE...Radar. IMPACT...Flash flooding of small creeks and streams, urban areas, highways, streets and underpasses as well as other poor drainage and low-lying areas. * Some locations that will experience flash flooding include... Scranton, Dunmore, Dickson City, Olyphant, Clarks Summit, Clarks Green, Elmhurst, Mount Cobb, Taylor, Throop, Glenburn and West Scranton.
-
You better tell your friend Bob.
-
Is DIT really 61/54 right now at 4pm? Yikes. 73/53 up here.
-
Hopefully the rains stay up at the Canadian border this weekend. The Lakes and white MTNs region hasn't had the revenue they normally would by this point.
-
95/74/106 currently. Should have been some sort of heat advisory/warning today. My HI has been at or above yesterday's all afternoon. MU also at 95.
-
He was right!
-
Rain has arrived in Eau Claire, its cloudy and 67, a few days ago it was 97.
-
i wonder if that has to do with the slower/further north jet resulting in these crappy shallow fropas
-
I'm driving at the moment. You can't check but something out. There is going gangbusters at the moment.
-
I'm picking up on abnormally, powerful strokes on my am radio frequency at the moment
-
It’ll be 90’s Saturday here . Wasn’t talking about rains in Maines
-
Ghost town at Hampton for this time of year https://hamptonbeach.org/beach-cam/
-
There was a considerable urban heat island in 1948, actually, you could rate it as 60 to 70 per cent of the present urban heat island. Perhaps most of its influence would be on overnight lows. But even by around 1890 to 1900 large cities were beginning to display an urban heat island. Vehicle traffic is only a small component of the cause of a heat island, the main components are altered surface albedos and escape of building heat. People were heating their houses before they had cars. Also they had transformed the urban environments to allow horse and carriage movement (thus changing heat retention). The strength of an urban heat island falls off rapidly after the first 100,000 of population in an urban area is reached and begins for towns as small as 2,000 population based on extensive research by many climatologists. You'd perhaps be surprised how quickly an urban heat island develops and how slowly it increases once developed, if you hadn't done active research or read the literature. For my Toronto data I estimated the urban heat island began in the 1881-1890 decade (rated at 0.1 C differential then) and I took an arbitrary 0.1 increase each decade to 1971-1980 (adding 1.0 then). For 1981-1990 and the past 35 years I estimated it had stabilized at 1.1 C (2.0 F) deg. For NYC data I have assumed the same pace of change except that I would expect an increase had already begun for 1869 to 1880 so if I had data as far back as Toronto's 1840 startup, I would start modifying 1861-1870 at 0.2 F or 0.1 C and adding that amount every decade so the stable period of 1981-2025 would be actually +1.3 C (+2.34 F) relative to what NYC might record in an unaltered "rural" state. Now some might instantly say, but NYC is in a megalopolis much larger than greater Toronto, would it not warm up even more? Perhaps, but as I said, past 100,000 the rate of increase is very slow and probably past 5 million it cannot increase because the environment is so substantially altered on a regional basis. The strength of the greater New York heat island is probably well over +1.5 F out into parts of west central NJ near the end of suburban sprawl. As to the urban park question and temperature reductions in hot weather, that probably washes out of data sets fairly quickly as there aren't all that many hot days and the nights in question remain more affected anyway. Urban heat islands tend to be something like 75% minimum boosts and 25% maximum boosts, an estimate of a +2.0 heat island really means +1.0 for average maximum and +3.0 for average minimum. Large stretches of cloudy wet weather show very small urban heat island effects, dry and clear months would have larger differentials.
-
Yeah beaches were empty OOB through York. Never seen anything like it
-
lol I do actually have to work sometimes and I would love to post a snow map right about now
-
You tried to tell 'em...
-
yep, someone told me few days ago to "sell" the low 60s and rn this Sat.
-
Where you been man? We've been thrashing the warmistas seven ways to Sunday. Got any snow maps?
-
no 60s though according to some
-
76 and mostly sunny
-
Providence was 94 at around noon yesterday and today around noon it was 62. I'd say that's a pretty good drop.
-
61/51 its beautiful out!! we love and we take!!!
-
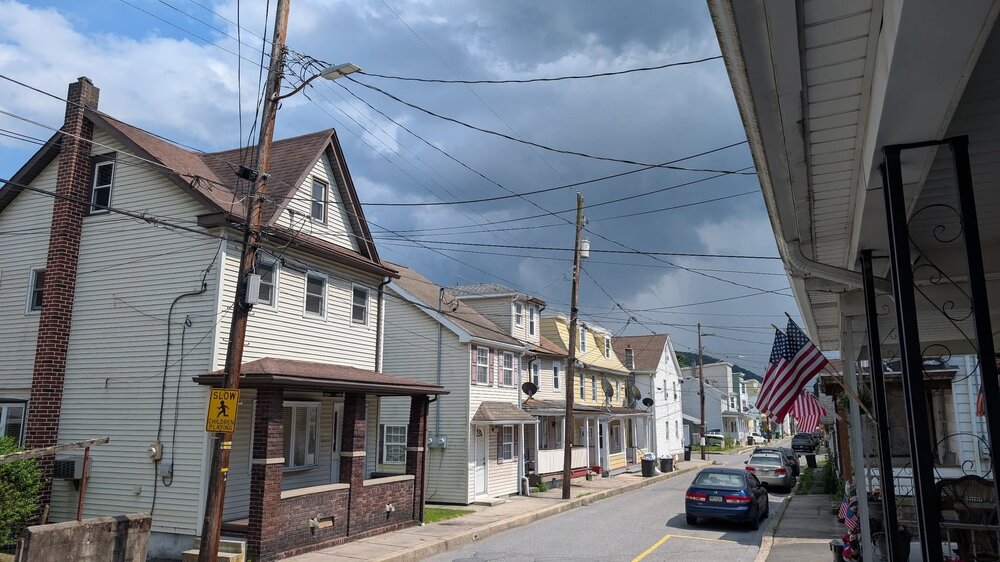
As I said. Guess which direction I'm looking....
-
Well now yes she's older. As I said she's lived there since the late 1970s. Im just going by what she says. I have never been to Texas and have no desire to go. Ive been to Florida several times with no desire to return. Like I said its all personal preference. It had been a very pleasant start to summer but all it took was a 4 day heatwave for me to say I've had enough lol. Give me arctic air anyday.


.thumb.jpg.6a4895b2a43f87359e4e7d04a6fa0d14.jpg)