All Activity
- Past hour
-
Apparently, this may be started by the NWS in 2028 I am hearing. @weatherwiz all excited but @CoastalWx MEH b/c it doesn't help w/ snow! THREATS-IN-MOTION – FACETs-Severe National Weather Service Severe Weather Warnings as Threats-in-Motion in: Weather and Forecasting Volume 36 Issue 2 (2021)
-
You forgot "LIVING IN A SHOTGUN SHACK!"
-
 https://dermatretdirect.shop/# purchase isotretinoin pills
-
21 for a low at KLKP. AirNav: KLKP - Lake Placid Airport PlyStWx need to update their station map! Add 1B9 (Mansfield MA). 4B8 (Plainville CT), 6B0 (Middlebury VT), 8B0 (Rangeley ME), and BXM (Brunswick ME)! And the biggest omission? (@CoastalWx will be mad) - no GHG (Marshfield MA)! That has been an AWOS for 20 years. Also, no IZG (Fryeburg ME). That's a cold spot! OGS Ogdensburg NY is missing, and just added? - N66 Oneonta NY.
-
I've seen it take until almost December. Nothing new. There's been more light frost this Oct than I ever remember. This area has a climate similar to central NC. We don't do cold well.
-
I do not contest the cold out W and warm in the E. but the choice of colors and the 0.5 C intervals make things look a lot more "Xtreme" than they really will be. It is a manipulative psychological thing, often done on purpose to push the extreme/crazy wx narrative. You could choose a different color table, and shows the same thing, and it would not look as "scary." For a met analysis and forecast tool it is good, but IMHO such maps, which are shared en masse on social media, do more harm than good due to the how the general public perceives them. Also, I find people do not know the difference between temp anomalies and actual air temp, the public that is. And the hype-masters out there know this. And it is taken out of context far too often. For instance, temps 8-12 C above avg DCA to BOS in early Nov is actually GREAT wx for the time of year (for most), as one example. Temps in the 70s and 80s w/ low dew points. Costs for heating are *way* down. Atypically warm in the cool season is not the same as in the warm season, not for sensible wx impact and humans. And such a pattern means little in the way of inclement wx. That is good for business and commerce. For general audience, just shows a map of actual fcst air temps, anomalies can be misleading.
- Today
-
-
http://levocarepharma.com/# buy thyroid hormone pills online
-
In the end, it all comes down to in situ observations. We can't possibly know the state of every cubic centimeter of the atmosphere at a given time. Even if we did, models would need to make LOTS of assumptions w/ parametrization and emulation b/c we still can't directly simulate many atmospheric processes. And the more complex models get, the challenge to keep things in balance goes up exponentially. In other words, tweak one little thing, and it breaks another, and sometime a big break in an unexpected way. @CoastalWx will just have to live w/ the fact he will never be able to forecast snowfall down the tenth of inch in Weymouth!
-
One message "did you see the GFS?" and you'll look!
-
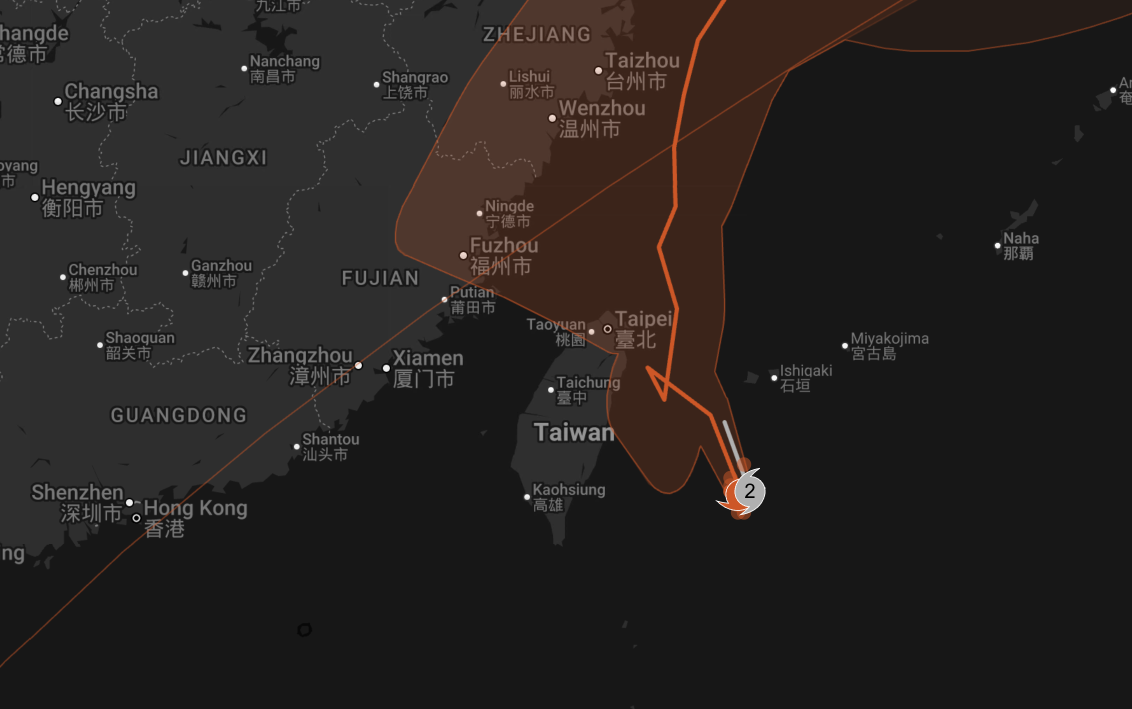
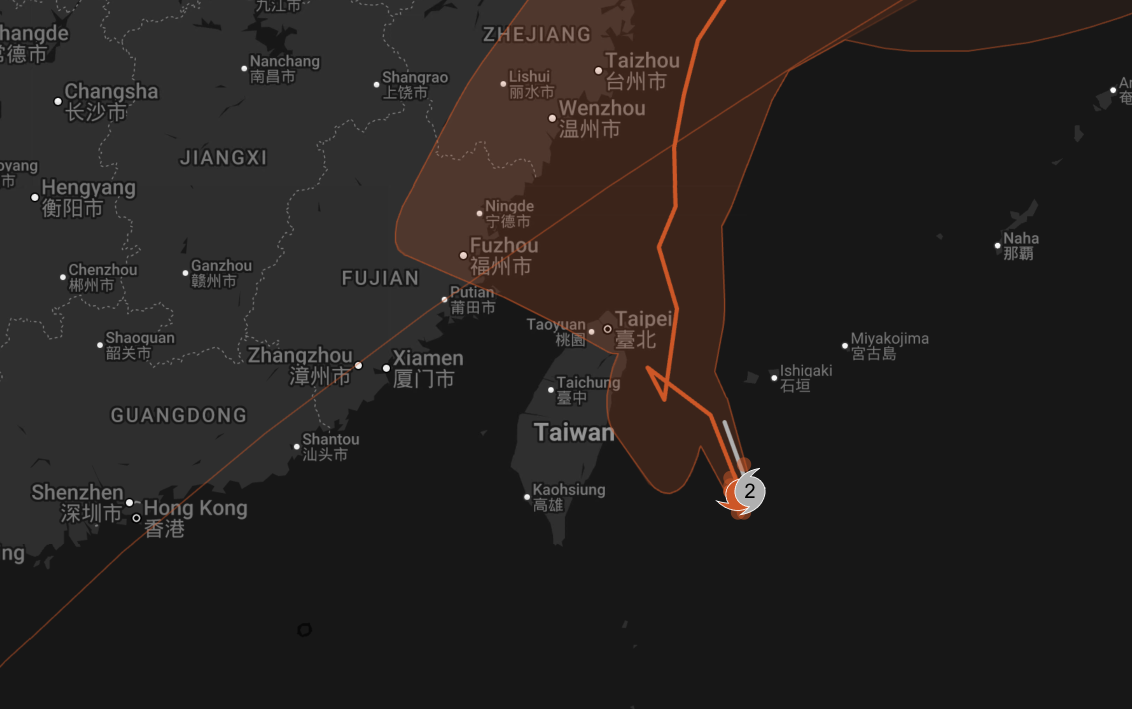
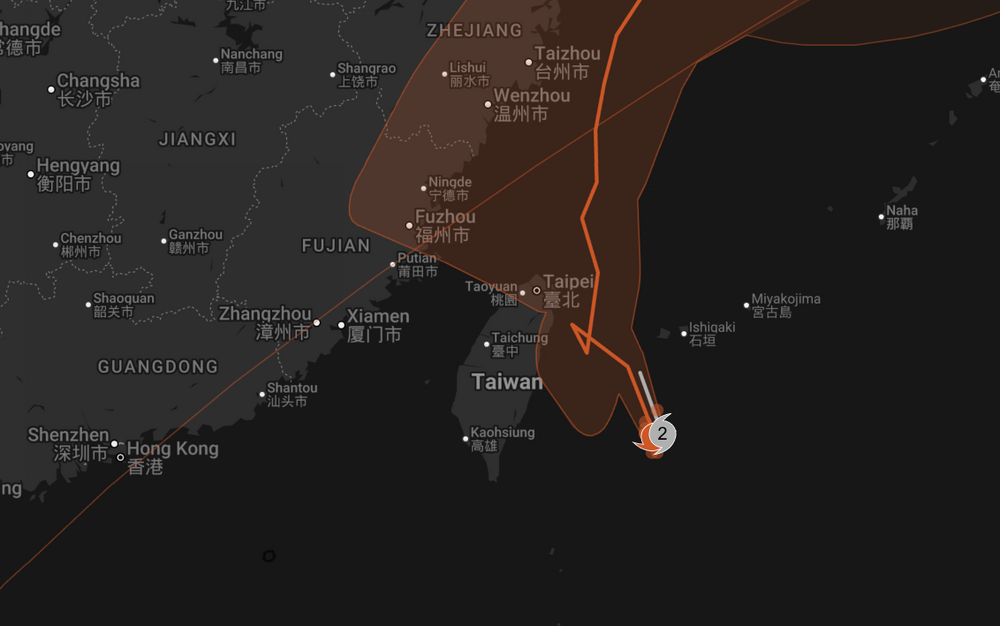
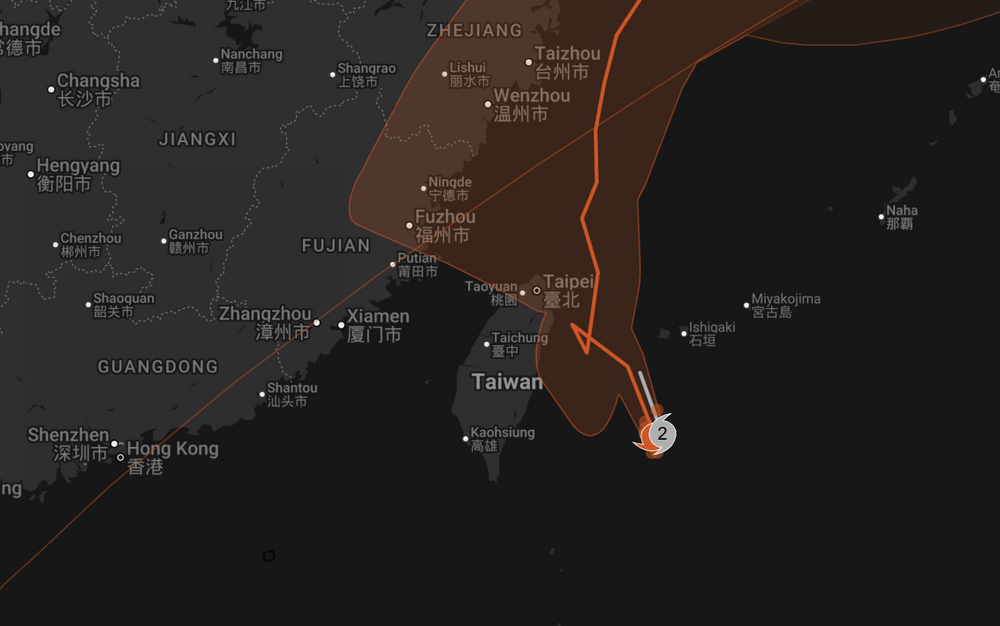
This radar loop is KEWL for Champi!
-
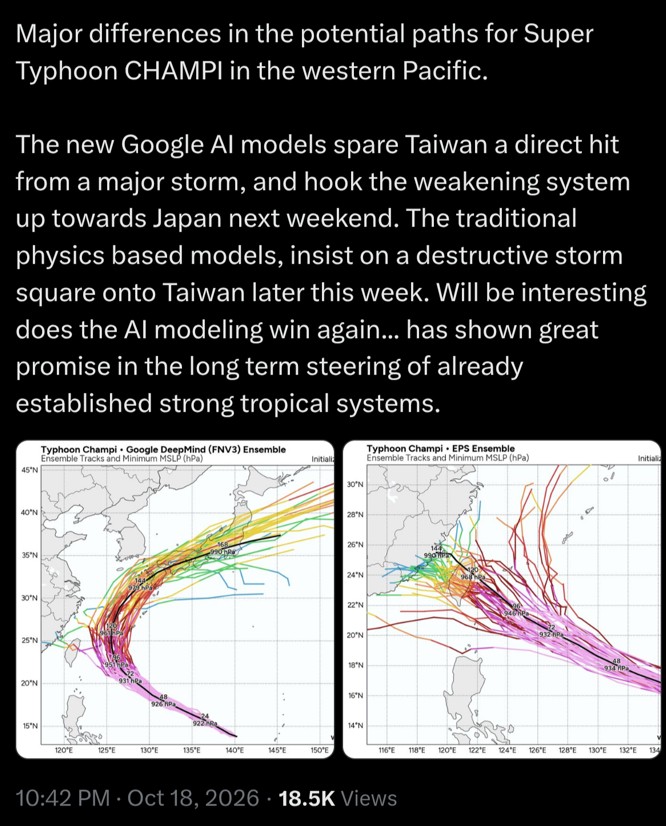
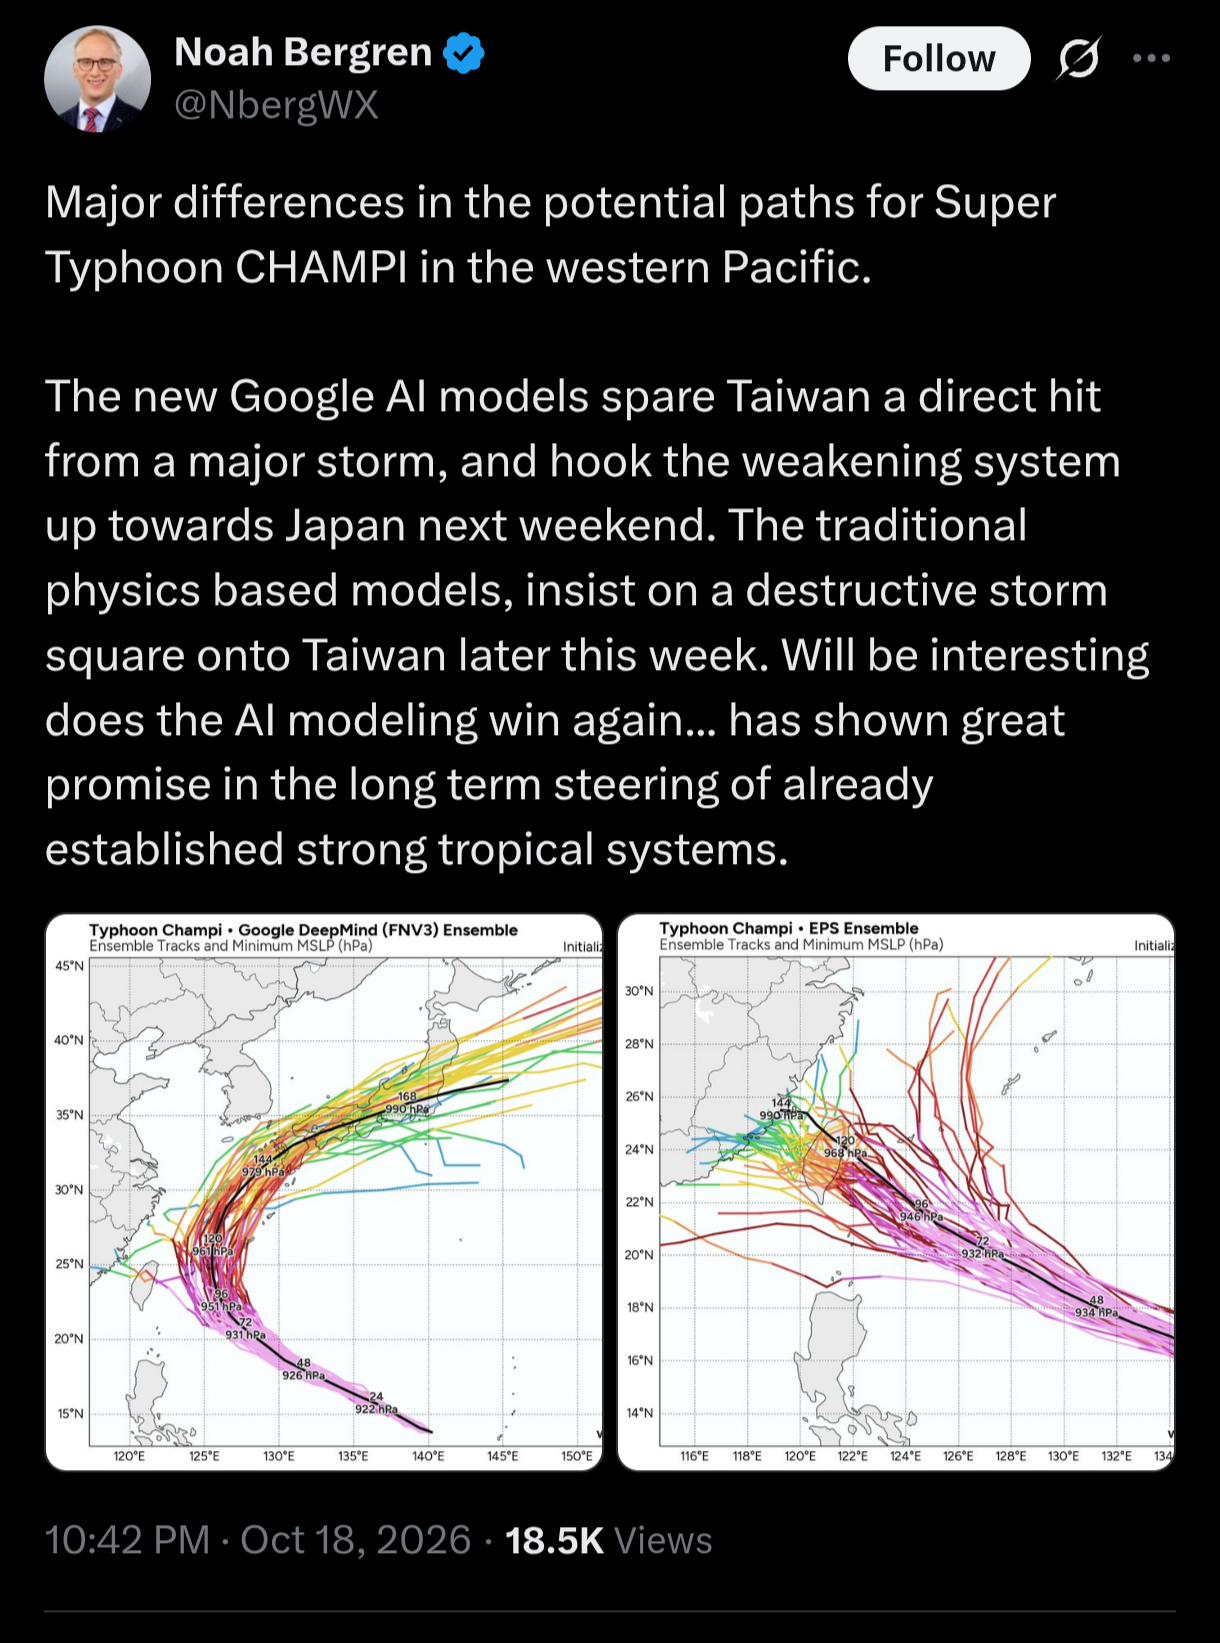
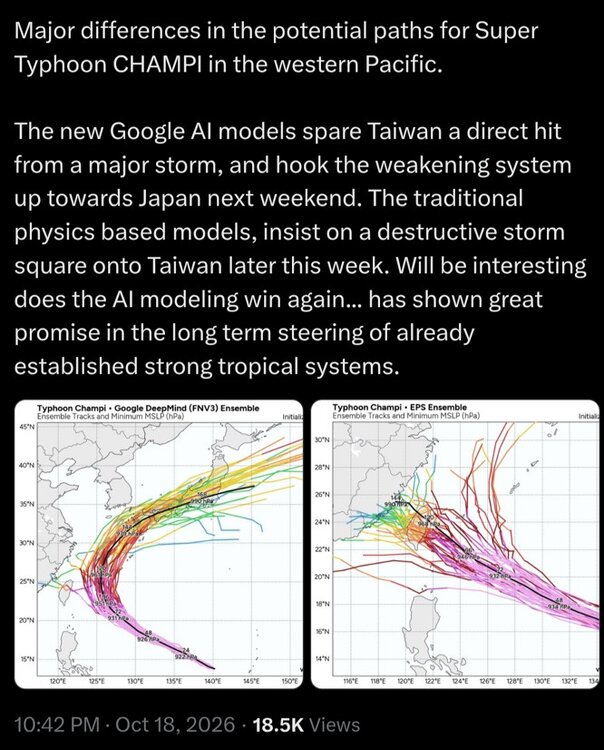
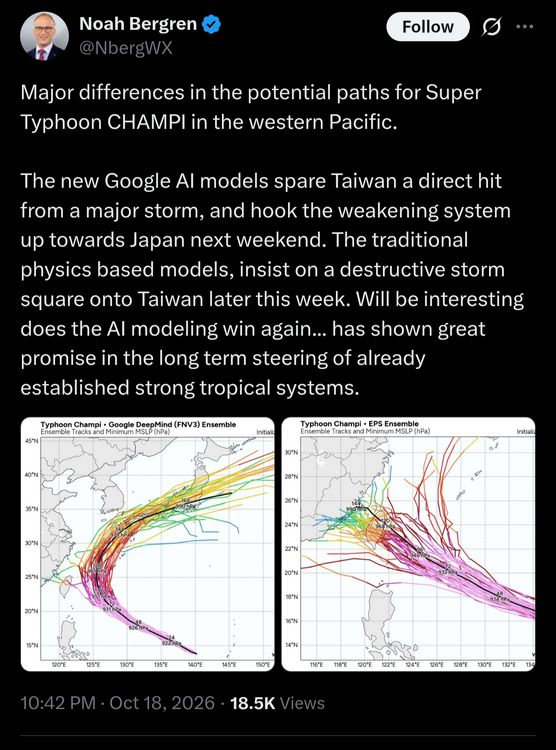
@CoastalWx needs to stop putting the 'bots up on pedestal when it comes to forecasting. Cherry-picked events skewing things, so he worships it like it is a panacea for all our fcst problems! GDMI only does well for the "easy" patterns/forecasts. Follow climo basically! Here's what GDMI had vs. EPS on 10/18. And the EPS also handled the loop/odd motion many TYs have when the approach Taiwan. You need physics-based models for terrain factors, among other things. These kinds of details count and the ante is high. Outlier cases are often the biggest impacts, like a Sandy, and not enough cases for GDMI to draw from.
-
A landfalling HU or whatever you want to call it that strong and large coming in from the SE to the NJ coast? That in itself was by far the outlier. It is so rare for any tropical system to it first U.S. landfall on the NJ coast in the first place, let along having such strong NW motion N of Hatteras' latitude. So you knew the storm surge was going to epic. It was a no-brainer. Sandy was the first time I noted a model (ECMWF) more than a week out has a record event forecast and it verified. It shows modelling had got to a point where the real biggies were forecastable w/ good detail so far out. The Bliz of 93 was forecast well a week out, but its strength, esp. so far S while still in the Gulf, and its record pressure of 960 mb later was not forecast early one. I recall the ECMWF showing Sandy as low as 927 mb just E of NJ one run! Not off by too much...940 mb!
-
zithromax azithromycin or can i buy zithromax over the counter zithromax cost uk https://www.google.com.vn/url?q=https://zpacksupply.com purchase zithromax onlineor https://kigalilife.co.rw/author/bcgjzpuadh/ can you buy zithromax over the counter in mexico [url=http://intra.etinar.com/xampp/phpinfo.php?a[]=Viagra+generic]azithromycin zithromax[/url] zithromax couponor [url=https://brueckrachdorf.de/user/rnccitfajo/]zithromax 250 mg tablet price[/url] zithromax 500
-
Last night's 0z GFS had the low temperature in the AM here at 42F. We hit 28F. That is not a small miss, and very little of that was due to radiation cooling since it was already at 32F at 1 AM. So I'm starting to wonder if the GFS is overstating the urban heat effect from Boston for the suburban areas? They are consistently overstating temps whether during the day or evening.
-
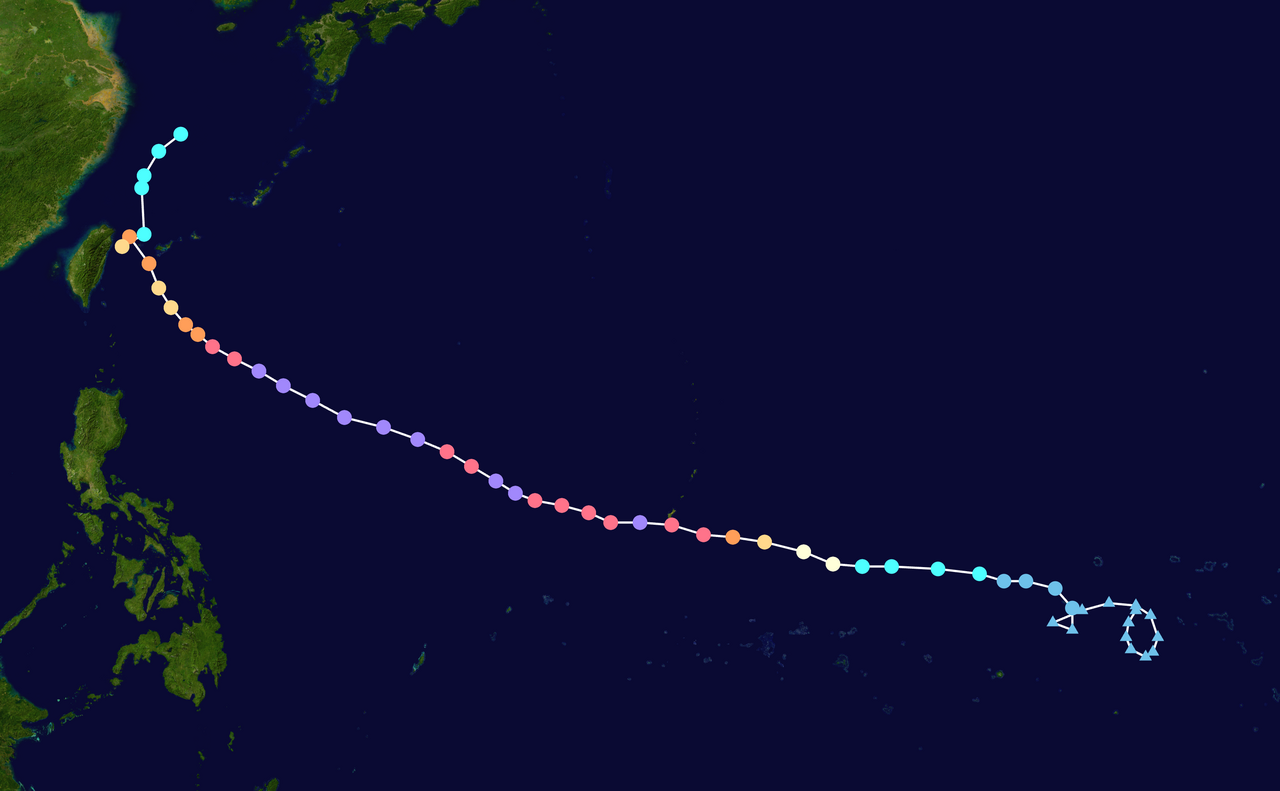
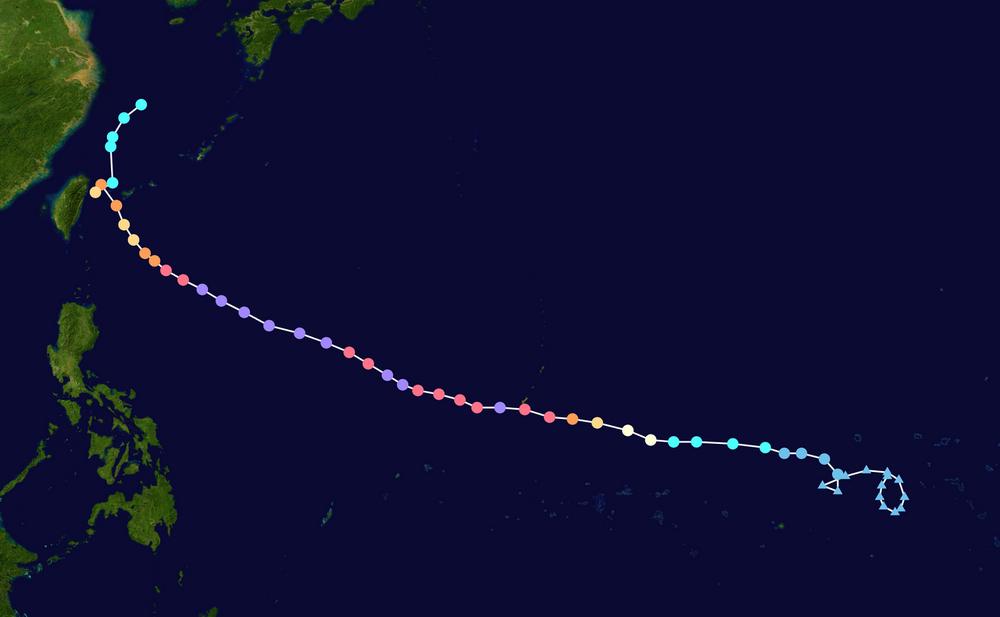
 Yes, so this is a lesson about AI models. They are not infallible and can be off quite a bit. Just I see some putting them up on pedestal and worshiping as to having the final say. And look at what a physics-bases model (ECMWF ENS) did. It even caught the odd motion from terrain influences so common for when a TY approaches Tawain!
-
Avg annual global ACE is 787. 1000 have been exceed 6 times. Max is 1163 in 1992. 1992 E/CPAC total was 27 NS and they go to the Z storms for the EPAC. But POR is only 1990-present since fully geostationary coverage for the IO was not established until 1989 (the SIO is #2 for avg annual ACE contribution). The previous record ACE for the EPAC 2018 and 1992, those were only weak El Nino years, so the very strong El Nino is not a prerequiste.
-
looks like the growing season for the urban areas along I-95 should continue well into November at this point.
-
order synthroid overnight LevoCarePharma generic synthroid for sale
-
2026 Atlantic Hurricane Season
vortex95 replied to Stormchaserchuck1's topic in Tropical Headquarters
There is no reason why a subtropical storm cannot have min hurricane force winds. I've seen 60 kt ST storms, so does something happen at 65 kt that suddenly makes it more tropical? The atmosphere does not work on such sharply defined small changes. Winds in an STS are dependent on many factors, like how fast it moving, how high the SSTs are (for better mixing), environmental pressure gradient around the storm, and how strong the ET low was initially for max sustained winds, which can be all over the place from far from the center to a continuous 65 kt + max right to near the center. ET storms can have winds as high as 105 kt sustained, so when it deeply occludes and winds come down, they can still be 65 kt when they go ST. I think NHC wants to avoid the confusion of a "subtropical hurricane" b/c of the of the media. Well. you have subtropical storm, so the next terminology step? But ET/PT lows have HU-force winds often, so what is that problem here? And storm #1 in 1979 was 65 kt. There is another case that had even strong winds as ST from those days I cannot recall it though. Either way, this should be irrelevant. A storm is what it is. You can't force it to be something it is not b/c it is not nice and neat from a public knowledge standpoint or does not fit into current policy! That Jan 2023 system off the mid Atlantic that was completely ignored operationally by NHC when it clearly was a hurricane. They included that as a 60 kt STS post-analysis, but Dvorak got to 4.5 (77 kt). and the ring of convection was remarkably solid and cold for a Jan atmosphere. Plus it was over 21-23 C water and a clear warm core. So given less than ideal mixing from lower SSTs, 65 kt is completely reasonable. When it passed Sable Island just to the W, they recorded sustained winds of 49 kt, and this was over much cooler SSTs (6-7 C), so easily 65 kt much further S over the Gulf Stream! See loop here. What would you call this thing??? (5) Deelan Jariwala on X: "I decided to make a loop of the unnamed system because I figured that with the late ATCF designation, there isn't much imagery from the usual sources (NRL, RAMMB, FNMOC, etc). This video runs from 00z on the 15th through 20z on the 17th. https://t.co/28L0zZlwhG" / X (5) Tomer Burg on X: "Among notable factors that helped Invest 90L form its very unusual structure for this time of year are its track almost perfectly following the Gulf Stream - which at ~21-23C is warmer than average - and low tropospheric stability beneath an upper-level trough. https://t.co/P2LKNihn7v" / X -

Winter 26-27’ Speculation Thread
KakashiHatake2000 replied to Carvers Gap's topic in Tennessee Valley
Saw this posted on another form and also all over social media but we will see about this . -
From a weather enthusiast perspective this has been an extremely boring month of weather, but this has been an exceptional stretch of weather to be sure.
-
Looks like 1982-83 to me...totally reasonable.
-
Volcano is a non-factor...it was NBD.