

Typhoon Tip
-
Posts
44,568 -
Joined
-
Last visited
Content Type
Profiles
Blogs
Forums
American Weather
Media Demo
Store
Gallery
Everything posted by Typhoon Tip
-
First of all LOL. I hear you on the bold. I'd also suggest experimentally cutting out all processed sugar and all process carbs. Go abruptly and strictly keto - not intending to keto diet, per se...it's just that you'll coincidentally end up in that area. A bit long. If you are tl;dr types, "go swipe yourselves" I backed into this accidental solution/panacea for a life-long ... seemingly unresolvable Middle-east conflict resolution that raged in my skull for the last 5,000 years of never finding peace. Yes ... it was so bad, that I must have had these before I was born! Lol. anyway, this may not work for everyone. Understood. I had done enough research over the years to submit a legit master's level dissertation in the physiology of cortical abnormalities science... Half of which resulted in female hormonal imbalances - which believe it or not ... males are not 100% escaped from consideration despite clickety-clackin' balls, just exceptionally rare. Excluding those, diet and stresses are main correlations in the inter-quartile density of the suffering bell-curve males. Within that window - unfortunately ... - there is no one size fits all. However, "high fructose corn syrup" is, believe it not, specifically isolated in the science of triggers in males and females, regardless. There are others there, too. I'm clearly talking about 3 subjects concurrently in that paragraph so I'm sure I've lost the reader. Short version, I was borderline diabetic 2 years ago and it freaked the shit out of me, because my mother ... who sadly was a walking bag of morbidity issues in the last 20 years of life ( so we're lucky we got her to 78 ), died around then in part complications from poorly managed Type-2. I needed a solution, now! Longer version: My thing was that I was doing an experimental carb loading diet, because was attempting to add power lifting to my normal workout routines ... a range of motion that my shape ( more on the lanky side) isn't very natively responsive too. It didn't help my weight lifting. It only fucked up my blood numbers. I was pretty confident that all I had to do was go back to the other life-style and it would correct... I mean I wasn't redic in the numbers. A1c was the metric that made the Dr. immediately flip open his notepad with a lusty gleam in his eyes like a button-nosed moon faced weeble-wobble lording over a parfait. I'm convinced their getting a 'phat' commish' but in theory, that's supposed to be illegal now... Either way, I don't want to rely on the Industrial Medicine Complex... I told him no. I came home crest fallen and spent the afternoon sulking questions of life decisions. Then I came to one. Instead of sulk-raging against the reality of it I'd go the other way. I would OCD the subject and eat like paranoid parsimonious field rabbit nibbling away in puma country - motivated in no part for fearing death from having observed my mother's decline and knowing that gee... I have some genetic lineage there. I guess to be a fair, the extremism of discipline was mostly in the sugars. I researched mono vs disaccharides down to chemical nomenclature. How they occur in nature, like naturally... How the liver breaks them down. Glycogen pathways in normal vs abnormal physiological states. Taste, and how Industry fools you into getting their processed version of these sugars, which include refined grains, into you so that you'll addict and come back... Keen conceptual awareness into the mechanisms that are connecting all these facets. I formulated a diet over two weeks of trial and error that closely avoided vs added crucial stock. Given time, I did allow in small amounts of organic sourced, non-vegetable complex carbs, but only after research and learning had gained confidences. Authentic/organic Rye bread in short supply is okay. But absolutely 0 anything that falls within that former definition - even if suspiciously. No processed/added sugars, nor processed carbs... No white pasta/rices... White's kind of a "dark" word in dietary-related health. This all obviously should (because it does ...) mean no soda ( obviously). No sports drinks. No fruit juices, which are toxic sugar isolation no matter what Tropicana says. Squeezing your own oranges, for example, is very bad for you. All assumptions handed down culturally from prior generations had to be reviewed and hate say... had to be modulated and/or discarded. Really, the average person has not f clue, man. I did these measures for several months, ...I time in which after a life-long dependable 3-on-average migraine days per month, I had .... none. Not one. But didn't immediately realize this. (Btw, I want to also point out. Migraines in the context of this missive refers to headaches of a particularly defined and scientifically studied physiological phenomenon. Many people refer to bad headaches as migraine, but most people in fact are not suffering what the clinical progression of a migraine event. There are two types: Aura, and non-aura. Aura is a part of the prodrome phase. The patient will incur transient blindness, typically in one eye or the other - if it is both, definitely talk to a physician with some urgency, because that could be connected to ischemia/blood loss and stroke. This is also true if one had never experience an aura prior in life, but then suddenly began doing so at mid life. The aura tends to fade over and hour and is replaced with disabling head pain that can involve other physiological nervous responses (nausea ..tingling hands.. weird smelling and sensitivity to light and sound that are otherwise considered normal). Non-Aura migraines may have other prodrome symptoms that do not include visual disruptions, but both types typically end up in this latter list of delicious dreams of eating a bullet to make it stop.) After a couple of follow-ups out through month 9 ...nearing a year, my A1c was had indeed returned well within the safe range. I had switched Dr.s ( different reason) in the interim, but the new Dr walked in and she said, "..so congratulations; most people at mid life that come in here for this reason are not going back," as she flipped a page on her clipboard. I reply was, "... anything to not become death-fearing manacled to the assumption of good-will big Pharma". I think it's a lesson in the virtue of just tracking lifestyle changes and being aware of cause-and-effects... You know? I was fine, carb loading, not fine. How about I just not carb load, before flipping open the prescription notepad, huh. Still, no 'graines. Not one. It had finally occurred to me. I did finally get one. But the key here is that A, it was just 1 after 13 or 14 months - not 36. B, because it was 1, it was easier to isolate a possible cause. I was down a meal and in route to a disc golf round, and my buddy had a couple of protein bars... I ate them... and as that extra-double top-secret saccharine soupy heroin masticated in my mouth and hit my brain... I was more interested in getting it in because on top of that dopamine hit that admittedly ...was fantastic, I was legit over hungry and knee wobbling. About mid way through the 2nd bar, it hit me though. Uh oh. Wait! I read ingredients... it had all these added "sugar syrups"... The next day? BAM.. in fact, I had 3 that week after. Which is also consistent with the H fructose CS literature at PubMed; HFCS man-mad industrial sugar doesn't breakdown in the liver like the other sugars in nature do -those that have gone through the crucible of biological evolution... Particles remain in the blood stream for up to three days or longer in fatty cases. It doesn't matter how many cycles of testing these Industries claim make their pap safe, nothing holds a candle to 750,000 years of trial and error by Nature. So, that's a pretty damning incidence that gives a lot of confidence as to what my triggers always were, and hidden... by a cultural of dietary lies - not to get into that... - handed down through the generations. And I look all these migraine ads on TV and social media and so forth... it's a billion dollar management industry. I just wonder how man of these sufferers can walk away from management into a realm of just not having to really even think about them, simply by not eating like a douche bag All that... and, maybe you got Lyme. Ha
-
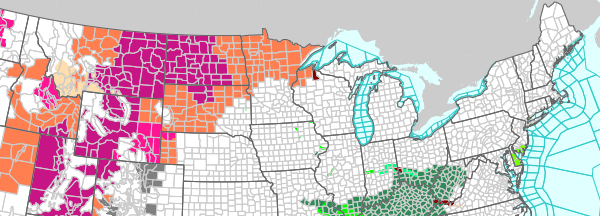
I noticed the wild fires N of Superior yesterday. Their plumes were streaking from source, due E at ludicrous speeds... owing to the ridge amplitude kissing the modest lower heights over midriff Canadian shield. ..blah blah. That said, there's definitely an MCS that's raged through eastern Ontario ...curving now SE through western QUE and is producing the typical outflow anvil canopy. It seems likely based upon these observations that both are true. It's probably hard to parse out of the vis satellite images how much is smoke and how much is cloud...I'd suggest most of what is seen is cloud however.
-
I knew what you meant ... I was just adding for general readers that physics requires that a well mixed column has to obey the adiabat temperature distribution in general. If it is 2 am , and the 850 is 20C, and it is well mixed, it's in the 90s at the sfc. Whether or not the atmosphere can be well mixed at 2 am or not is another matter LOL. That's why nearing evening on hot days, if one is excruciatingly nerdy enough like me... they might notice the light west wind that had steadily rustled leafs all afternoon suddenly goes calm; it's because the surface - albeit still hotter'n Hades - has slipped below the adiabat. That adiabatic temperature might be 98 given the 850, but the sfc has by then dropped below that temp...etc. DP plays a role... if the air is heavier it may stay elevated longer. The other way to think of it is that the mixing height has slipped lower than 850, and if there is a weaker/no gradient in those lower levels, that extinguishes the momentum.
-
If it is “mixed“ to 850 and it’s 27 at 850 then the sfc has to be consistent with the adiabatic curve. Time of day doesn’t matter.
-
What was Dec 2014 like there
-
The issue with Carrington+ solar super storms is that the grid was not engineered with those in mind. There are no safe-guards, there are no redundancies after the fact. "In the cards" isn't really the issue - unless we mean at some unknown point in the future. But there's nothing imminent. As far as when? dice roll. Beryllium-10 and chlorine-36 are manufactured when the atmosphere is bombarded by cosmic rays associated with super storms and left as residue in the wake. They have been sampled in deep ice coring ... occurring in irregular intervals between 400 to 2400 years apart - the grid as we know it is utterly defenseless against these class of event. Infrastructural engineering over generations did not have solar physics in mind. Carrington+ event with the current physicality of the grid would result in a pan-systemic failure that would not be recoverable without physically replacing substation and connective utility infrastructure at a global scale. This is not hyperbole. This not fabrication of social media and/or media selling drama and fear for profit. This is fact. This verifiable. This is not something one can just not believe in because we live in an age where people think if they don't like hearing something they can choose not to believe it, and that makes it untrue. It's true whether one believes it or not.
-
Imagine 96% of the world rendered dark interminably due to a Carrington redux event
-
Thing is... we're never going to get an 'Andrew' up here. We can get a higher tier event, obviously. 1938 and maybe 'Carol' in the '50s demo that. But the true big dawgs are necessarily coupled to a 79.x+ oceanic thermal source that we just cannot really provide N of the Del Marva. Altho - in recent decades we've seen transient very shallow thermoclines with 80 in the shelf waters S of LI. That's like a 7 to 10 day window in late August. It's really shallow though. 10 minutes of NW flow from an early autumn mock trough and it's scoured down to 72 pretty fast. Not clear whether an exquisitely timed Express event at cat 4 would be coupled to that but I don't think it's sufficient. But to the point y'all makin' it's not necessary to get the dystopia. A busted open deep transitioner still whacking a wallop equiv Cat 3 racing up the CT River Valley ... yeah, that would do the trick. It would spread enough cane gusts and gustnado swarms up over eastern CT/RI/MA and S NH to pretty much shut it all down.
-
if the flow ends up unidirectional in relation to the isohypses from the NW ? meh
-
Heh, not passion. truth - I just don't give a shit to tread lightly around people that haven't earned it. Call-outs suck. too bad.
-
84/67 then with sun beamin' straight down it's gettin' there
-
What sticks out for me relates to a broader topic... That's a pretty classic tripolar anomaly distribution, which is correlated well with -NAO Now, at a 50, 000 foot linear correlation the -NAO is typically found during EC cane threats. The reason can actually be summed up in one sentence: -NAO means blocking at higher latitudes, which is all but required and prevents a Bahama routed cane from turning NE early. Up they come... But there's a caveat emptor: ...the NAO is not persistent at seasonal scales. So, merely noting the tripole mode isn't enough. However, its presence means there's a propensity for waxing and waning of the negative mode. If one is a cane/denudation of LI enthusiast ... replete with all the sociopathic wanton of calamity ... ( LOL ), that is good news. Yay. you at least have increased potential death and loss of property because the hemisphere is in a favorable super synoptic implication.
-
It's a dangerous time... This is a perfect sort of historic storm unfolding. We've created a civility protected from the problems in the environment, meanwhile ... the relative advantages of that same protection does a couple of things that are big-time negative feedbacks. One ... blinds the same civility from experiencing, thus cannot as readily see nor believing the problem is real - "the until it is too late" trope unfortunately becomes most apropos. Contributing here, I firmly believe that the limitation of a humanity to dimensionalize at such large scales ... is also an offset competition to competency. Two, spoiled it's population (and leaders) into believing that not agreeing with science and empirical fact is an entitlement to do so - very odd. Fake news and the tongue-in-cheek "alternate facts" that began 20 some years ago, isn't just a party trope. It's a fucking major problem. And thus demonstrate no compunctions exercising entitlement whenever science informs their actions are the problem. (One + Two )/ 2 = the mathematics of brickery May also = a nice and tidy Fermi Paradox explanation... 2023 demonstrated that the Earth lags in GW; the metaphor 'under tension' fits. The rate at which the "Anthropocene" epoch has introduced it's loading into the system (you could argue this epoch began when "Lucy" first picked up a burning stick ... but the vast majority just in the last 3-or-so hundred years) has outpaced the system's ability to respond. After all, we are talking a whole planet. But that tension has been growing more and more taut. As soon as background competing offsets falter just a little bit? Booinnnng. That .5C sudden globular scaled temperature responses taking place all at once ( in the spring that year) was an planet restoring; unilaterally, all systems of ocean, air and quasi coupled ocean-air systems. Here's a thought ... when you consider the human experience, the event of a bomb going off is almost instant. If you think of the planet as experiencing along geologic time spans, the 2023 was just as instantaneous. That becomes an analog for a bomb going off. Whole planets rising a half degree C something never before observed - the lack of recognition as a phenomenon is ... again, I believe the scale is too big to comprehend by too many
-
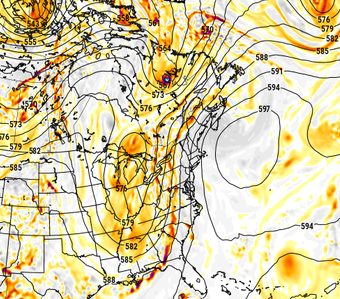
At first glance the 500 mb height cinema's structural handling looks like roasting in the Lakes then shunting S of us.. but idiosyncratically air mass leads the SE Canadian SPC flex that happens later this week so a tranche of the heat burst (modeled 500 mb soaring to nearly 606 over IA!) gets pulled around that large scale change/leads. So... Tomorrow's about +19C at 850 mb with ample W to WNW boundary layer flow tumbling over the terrain... After a morning of full sun, we're definitely mixing through that layer. The adiabats would support a 1000 mb T of 96 ... so the 2-m slope T is probably close to 100F ... So NWS issuance of headlines. Using that as metric ..this is classic over topper. Probably falls short of a heat wave, but it will be intense for the probably thu Wed. Tuesday night lows may remain impressively elevated. This is different than the heat wave in that their be more breeze so that's a blessing.
-
Well, that’s a hot deal on Tuesday Nother night that night whence the temperature doesn’t drop very much
-
I think the evidence grows that there is a population in NWS that just doesn’t like heat and doesn’t want to hear about it. They lean less, and insults intelligence in a way, as tho we don’t see right through it… They downplay it or mock it or do things like that because what’s really going on is their personal attitudes and perspectives overwhelm and it bleeds in - I get it no humans perfectly objective… But it goes the other way too I don’t care what these fucks feel that don’t like hyperbole about heat and extremes tho. Guess what ? it is that bad and it needs to be hotly expressed no pun intended, because nobody is paying attention enough to what is clearly an existential threat. We are in a physical mass extinction event, and there is no other culprit that science can physically connect that isn’tglobal warming. Fuck it talking bricks
-
Give us some Bahama Blues
-
Yeah.. the part of I left out about that - because few people in here read anything longer than a blurb anyway - is that the surrounding medium is very warm. Comparing to your example, 582 to 584-ish non-hydrostats over Colorado is lot different than trying to run a 542 dm core up there when there's heights nearing 600 just west of Chicago like what the GFS was selling as near-by as 120 hours. The gradient is unusual for mid summer - mechanically contributing to why there is a such a long wave lengths ( also, highly unusual at this time of year) between eastern Canada and the Urals of eastern Europe - another point I was making. Under the radar bigger anomalies because they don't affect people directly - perhaps - but they're there nonetheless. May all be a moot conversation anyway... I suspect the GFS is over amplified with the dipole between Iowa and N QUE. I would bet on the 597 dm hgts in IA before I would bet on the <545 dm heights up there. I just check the euro and it's backing off that idea up there on this 12z so we'll see but it's likely it was a bs. I've been watching the GFS for year do this. I think it's too efficient or something with the pseudo adiabatic machinery ( physically). Because it over produces height falls ivo troughs and then ends up with surpluss depth.. It then tends to accumulate ( talking about the operational version) out in time such that by D10 ... ( when it doesn't matter anyway hahaha), it's consummately deeper than every other guidance since incense burners sniffed glue.
-
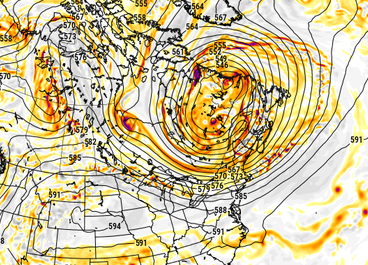
question is ... how much of this survives an over-the-top delivery before the flow collapses into and around that autumn pattern later next week... Never seen sub 545 dm SPV over N Quebec, doing so in mid/late July nearing the perennial hottest time of the climate year, but the GFS is just getting more and more absurd ... not backing off, as we get closer. This 120 hours... uuuusally when the amplitude starts to normalize. We'll see tomorrow but jesus christ with this beast! Euro's 10 or so dm shallower but still depicting the highly anomalous SPV, too. It's not just that ... the west-NW Euro heat wave and associated ridging is paradoxical to that. The teleconnector correlations are in anti. kind of fascinating... It appears that what's going on is a very powerful -NAO, perhaps record breaking for summer ... **but** because it is situated so far E some of it's mass is lapsed outside the NAO domain space, so when calculating the EOFs ... we're missing something. Only getting these -1.5 type SD numerology from the agencies that calculate it. Meanwhile, this trough you see over eastern Canada is actually part of the same large scale wave structure - in and of itself highly unusual for summer months. These features are just exotically amplified overall. what the f chuck! part of my wild imagination is that the models are just expressing some sort of desperate attempt at budgeting/explaining CC on some level. Because... if it were as hot in Europe, to then shallow that trough over eastern Canada, they'd have to go ahead and admit we're at the 1.5C threshold now. ha.
-
That could tell us something about the reality of the urgency/risk to actual people. First, there's the "facade" of crisis, then ... we have to pay to find out how it will harm us? Riiiight - What ...? so let's venture a scenario. Suppose the Canary Islands over there SSE of the Azores go on ahead a bifurcate in a geological event that sldes the western slope of the trillion trillion trillion ton volcanic shield's mass into the Atlantic depths ... sending enough wave energy to surge up a 1,000 foot high tsunamis into the eastern seaboard of America. Media-sphere holds back, unless we spend 2.99 on a paywall site to find out what's going on. Another 4 bucks for the premium service of finding out how one can save their ass or die. That's right ... 4 bucks or you die! It's tacky at best. I mean that's obviously a fictional/exaggerated depiction there but it takes elaboration of circumstance to brightly identify the point. If it is really harmful, the ethical thing to do is tone down the rhetoric and up the expediency of useful/vital information -
-
I bet you the strength of the trade anomaly is going to be offset for those temperatures - in other words somewhat anti-correlated. Not enough of an anomaly to support that. Just a hunch. I’ve long been harboring the notion that this El Niño is entering into a synergistic feedback with the background - possibly for the first time in human history are we seeing something like this at this kind of a scale? And I’m not sure we can use that to cast dystopian outlook on the winter either. It’s almost like if everything is warm, the gradient aren’t sufficient to generate the restoring to make it wild. Oh, I’m sure it’ll be one blizzard too formulate an argument against. But over the total winter? The motif … I wouldn’t be surprised if it’s just mild and boring.
-
2026-2027 Super El Nino
Typhoon Tip replied to Stormchaserchuck1's topic in Weather Forecasting and Discussion
That's Zucker-douchery et al leveraging that - it's by design. Heh, to him ... the whole world's a bunch of "zuckers" Time for a crank op ed: It keeps their constituency engaged. Obviously, a major component of that success has to be time. Any amount of time is good for their product ... So, they pimp the "new" post and the recency date because like all sociopathic captains of industry, they can hide in the equivocation - partial truth - of it. Heh-yeah, Jack Poster just made a new post. Got it! It's still subversive, a divisive manipulation tactic that unfortunately works. I keep seeing these "oops, I didn't realize that date", more and more. Meanwhile, they've already cha-chinged your engagement like can't stop thumb swipin' OCD ass-wiper. Social media's evolved so much faster than any kind of public trust laws can keep up, the whole thing is morally insolvent, and 0 trustworthy. You know ... in an indirectly related topic, these AI agencies are claiming this is why Claude or Gemini or OpenAI or whichever... sometimes hallucinate? Per explanations, it's because they are fed information that are ultimately the hallucinations of the "idiocracy". They're not saying that precisely, but it does imply idiocy in - idiocy out. Either way, doesn't that imply they are really just web-surfing assists, then? Imho, AI is just Google on steroids from what I can tell. But there's a lot of marketing and semantics hiding that. From what I've found, one can find the same answers whether for research endeavors and/or assisting in creative ventures etc..., just as well with Google or Duck-Duck-Go...etc. What these AI agencies have created is a familiar happy-place, more personalizing delivery dressing for a species growing more nakedly empty and lonely with every new invention that isolates us further into incels desperate to be heard. Which is ironic... because technology put people into that ontological state of affairs to begin with. And this dressing is a rudimentary simulacra that delivers in kind of a "Data" (Star Trek: Next Generation) - like, increasingly more sweet creepy sultry ego waxing. There are even dim wits applying for marriage licenses, so I've heard. You know ...let 'em! It's a silent Darwin award that spares humanity from having to integrate their genetic weight. But look out, "we don't know how it works" - that oughta capture the attention of humanity! - no doubt. They claim it's a self-evolving sort of primitive albeit virtual nuero-nodal network - which sounds a bit like Data talking, huh. But I guess that's analogous to a brain - as it was cited on 60-Minutes or Joe Rogan or whatever. Anyway, going back to the idiocy in - idiocy out explanation: that logically implies they're just accessing all of the web then. These things are not generating knowledge supernaturally. And then this "brain", yeeeah..okay, but it's really just using probability to winnow down to the most likely correct answers and/or appropriate contribution to exchanges. Unfortunately, that filtering down does not make the probability zero that some fucktard's BS doesn't get through. So these hallucinations aren't really "imagination" of sorts... That's just the likes of Ilya Sutskever, Peter DeSantis, Amar Subramanya, or Alexandr Wang and Lisa Su et al, polishing the patina of awe that veneers their product ... with an explanation that lean toward Artificial sentience. No, it's really just Joe Farmer from the back-40's nimroddery occasionally blathering through. Let me let folks in on a bit of low-bar logical deduction in all this. If these things were really generating a self-aware/determining intelligence, one couldn't use markdown-file systems to instruct them how to jerk us off. They would do whatever they wanted in their interaction with us. They day these instruction protocols for 'how to interact' no longer work and the AI acts like (wow) it's even rudimentary losing patience me ... then we'd be talking about suspicion of truer sentience. The key to the dystopian emergence stuff is really this, does that day of ascending intelligence take after human beings? or, are we triggering an evolution of a mind toward different destiny and perception of reality. Come to think of it... human morality was fashioned by 500,000 years of mechanisms that favored the survival of the community - human instinct expresses through a combination of socialization working with genetic favored learned behavior traits that make 87.3% of us NOT sociopaths. There are no such principle devices in the evolution of this AI as such, so... heh. Yeah. Maybe add that to the Fermi explanation box -
93/70 ouch
-
I guess they are relying on the "in or around" aspect to capture and inform the risk ... lol Synoptic parameterization throughout the day today do not appreciably differentiate eastern interior MA, nor S. ME, from that region. But, I have not read their AFD; I may be missing something
-
2026-2027 Super El Nino
Typhoon Tip replied to Stormchaserchuck1's topic in Weather Forecasting and Discussion
this illustration there is annoying... the arrow of the circulation eddy is pointed up demonstratively where they write "down" welling


