

Typhoon Tip
-
Posts
42,356 -
Joined
-
Last visited
Content Type
Profiles
Blogs
Forums
American Weather
Media Demo
Store
Gallery
Everything posted by Typhoon Tip
-
December 2025 regional war/obs/disco thread
Typhoon Tip replied to Torch Tiger's topic in New England
hahahaha.... damn! thought I got one past you. That part of it's a chode tug just cause I was being a dick, but I do see similarities among these years whether we/you/I want to see it or admit or not - and... I don't claim that it is CC outright. I am open to that being the case but more seriously, there was a speed/velocity saturation in the flow every one of these years that is/was/still is near the top of the geophysical ceiling during winter core. There's a reason all these air-land airline speed records have been set in the last 10 to 15 years, for those intercontinental flights over the N Pac and Atlantic. It's because they're traveling in the slip stream of mega jets, where they have to open the throttle and fly very fast to maintain lift ... which requires near sonic speeds relative to the stationary E... It's 200 kt 300 mb wind flow ... you gotta move the 60 ton vehicle at 600 mph to maintain the air-relative 500 whatever mph it is they need to stay fuel efficient ...etc. So regardless of the reason ( CC or the CD ) ... It's probably going to be observable in January ...again. It's based upon persistence for now. -
December 2025 regional war/obs/disco thread
Typhoon Tip replied to Torch Tiger's topic in New England
ooh ooh I can help. Image a rope, and your snapping one end ... you'll see a wave move along the rope? that is the linear function/wave propagation. Now imagine that there are multiple wave functions propagating at once. You might have seen this experience in science... but what happens is the waves organize into a patterns that so long as the input force is proximal to steady, will then enter what is called 'resonance' - that resonance is a predictable standing wave event. What we are seeing in the Pacific northern arc out there is a remarkable case of resonance occurring at very large synoptic scale... the NAO that downs stream of that as a secondary resonance node on the "rope". -
December 2025 regional war/obs/disco thread
Typhoon Tip replied to Torch Tiger's topic in New England
Agreed. I added this sentiment to that missive, " It resulted cold loading into the N/A either way so ... who's quibbling. " But also, the Pacific --> N. America total wave signature is what creates the NAO btw. Not you per se, but folks may save some frustration if they finally get their minds wrapped around that. It's the mechanics downstream from the PNA domains idiosyncratic wave distribution. One of the reasons it's so difficult for the models is because it's largely driven to emergence through non-linear function - those that are applying forcing in a transitive interference, which are not visible. Just sayn' -
December 2025 regional war/obs/disco thread
Typhoon Tip replied to Torch Tiger's topic in New England
Pistol to head? this January will be very close to: ...quite specific to that range, too.
-
December 2025 regional war/obs/disco thread
Typhoon Tip replied to Torch Tiger's topic in New England
right, not an SSW -
December 2025 regional war/obs/disco thread
Typhoon Tip replied to Torch Tiger's topic in New England
it wasn't a canonical SSW behavior in the sense that there was no propagation for one. But, we had a near or at historic solar storm around then. I'm entertaining the possibility that the models were caught off guard by the solar flux arriving around the time they were modeling an intrusion event, and irradiating/breaking up crucial ozone densities - ozone is an important thermal conductor in the physics. The other aspect ...as I pointed this out at the time, it was not very clear in the modeling whether it was emerging above 50hPa level. It appeared to actually to be a punch up from the below from the topospheric bulge associated with the ( at the time) still being modeled N. Pacific height anomaly - they certainly did a good job with that ... just fantastically persistent feature. It resulted cold loading into the N/A either way so ... who's quibbling. I think there was some interpretation misuse going on at the time et al. -
December 2025 regional war/obs/disco thread
Typhoon Tip replied to Torch Tiger's topic in New England
It's pathway to getting to this scalar layout is suspect tho. just sayn' -
Whaaaa cluttering up a thread that’s 244 pages long? how the hell can you tell LOL
-
Occasional Thoughts on Climate Change
Typhoon Tip replied to donsutherland1's topic in Climate Change
-
Occasional Thoughts on Climate Change
Typhoon Tip replied to donsutherland1's topic in Climate Change
https://phys.org/news/2025-12-climate-misinformation-national-threat-canada.html -
December 2025 regional war/obs/disco thread
Typhoon Tip replied to Torch Tiger's topic in New England
Will, it's a sneaky bomb potential .... concealed in the indexes. -
December 2025 regional war/obs/disco thread
Typhoon Tip replied to Torch Tiger's topic in New England
Low probability/non-zero potential but this should monitored, neverthelesss ...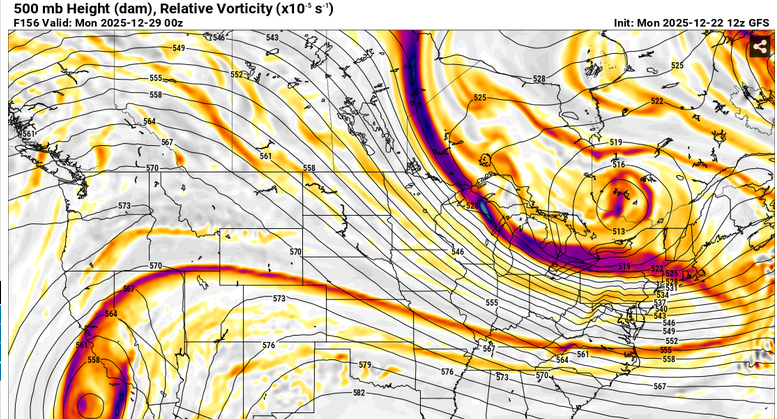
-
December 2025 regional war/obs/disco thread
Typhoon Tip replied to Torch Tiger's topic in New England
26.5th coming S of 12z fwiw- -
White Christmas Miracle? December 23-24th
Typhoon Tip replied to Baroclinic Zone's topic in New England
You know the way that ridge bulges in the midwest like that and this thing comes down out of the northwest along the 540… starting as a zygote plume in N IL then strengthening E before diving southeast … it looks like an MCS in the summertime riding the thermodynamic gradient in this NAM solution -
December 2025 regional war/obs/disco thread
Typhoon Tip replied to Torch Tiger's topic in New England
I'm testing the AI cluster with this 23rd thing ... Firstly, they're remarkably similar - which I find interesting, actually. It makes more questions for me. How is AI GFS and AI Euro, non-dispersive relative to each other? that's a weirdness. I still don't know more precisely how these models are constructed. What is actually processing. Until I do, it's voodoo ... Are they just probing the 'cloud' ( ugly pun) for the mean of a billion minds of both machine and man? If that's the case, of course they are always more encouraging for snow nearing Xmas, because it's tapping into the hopes and dreams of the latter. Heh. Or are they processing actual fluid and thermodynamic equations in the propagating of wave mechanics through a matrix. Something in between? I tried researching this question but I'm hit with a typical smoke-screen of marketing and promotional speech - or at least too much and losing patients.. Comes off a bit Wizard Of Ozian and the "don't pay attention to the man behind the curtain". Typical of the web though. The entire degenerative irony of the greatest invention of modern industry is that it's usefulness is run down by capital interest and greed. It's like just answer the fuckin question! no, you're not getting any money you petty f*n c*ts I digress. Merry Xmas. LOL -
December 2025 regional war/obs/disco thread
Typhoon Tip replied to Torch Tiger's topic in New England
It can split NNE and SNE ( not sure i think you're in VT ?) anyway, the storm track can end up flopping like an unmanned fire hose because both tracks are supported ... sort of ending up between cutters and transfers... SNE rolls dice ending up shafted or SWFE 50/50 .. while mix gets to PF, and then it's powder snow up in CAR ... It's not impossible for easterly NAO's to even swash a warm sector or two. No coincidence we're seeing the operational runs flopping around as they have been. -
December 2025 regional war/obs/disco thread
Typhoon Tip replied to Torch Tiger's topic in New England
The blocking that has been consistently depicted isn't really the type that backs warmth down into the Maritime and Maine if it helps. This is clearly favoring the eastern limb of the NAO domain. In that regime, if anything, you're likely to be in a mean WNW to at times N flow around the Maritime train-wreck low that is sourced by intermediate polar air over midriff Canadian Shield.. -
December 2025 regional war/obs/disco thread
Typhoon Tip replied to Torch Tiger's topic in New England
I'll double up on this sentiment, ... knowing that posting the way I do has eroded popularity to the point where I'm on people's probation and/or ignore list at this point. Ha! I'm "slightly" younger than you but I've been there now for ... shit, 10 years probably. Seeing 100" in 10 minutes in 2015 was like dad making you smoke a whole carton of cigarettes - it might actually work. LOL. But, I think the real reason for escaping the d-drip addiction is the repeating bad years since. Just unrelenting, and being that way regardless of all intents and purposes between the Joe D'aleo's, the NCEPs ... Bastardi 'n' cokes, Rays of sun reflecting of snow pack, or Death sentence to snowstorms just get Margrave to post anything about it. No matter who or what is predicted, ...god, just find something, anything better than doing these winters. I realize there's been a-b-c month here and there but using that clouds the reality of abuse. It'd be like Tina Turner's relationship with Ike. I still enjoy anticipating interesting Meteorology - but that goes for the entire spectrum of weather -related subject matter. I'm in the minority in the summer in here. I get it. But when I say I think it would be spectacular to see the complete shock-and-awe ( which is possible as CC continues gaining momentum, just a matter of time - ) retraction of the polar boundary and sustaining green lawn warmth in winter months, that's just the amazement of nature talking. There's 0 give a shitness for snow anymore over here. When and if there is an interesting weather event that is freezing or frozen in nature, that's just academic to me. -
December 2025 regional war/obs/disco thread
Typhoon Tip replied to Torch Tiger's topic in New England
Do you think CC is playing a roll there lol -
December 2025 regional war/obs/disco thread
Typhoon Tip replied to Torch Tiger's topic in New England
actually pretty awesome if you like warm days. There's like 3 of them across that span ticklin' record taint -
December 2025 regional war/obs/disco thread
Typhoon Tip replied to Torch Tiger's topic in New England
that operational Euro's extended only achieves one thing and one thing only ... why you should never look at an extended range Euro solution -
December 2025 regional war/obs/disco thread
Typhoon Tip replied to Torch Tiger's topic in New England
This could be a great icing/mix scenario with only minor synoptic adjustment
-
December 2025 regional war/obs/disco thread
Typhoon Tip replied to Torch Tiger's topic in New England
Kind of a vague SWFE look to the GFS too -
December 2025 regional war/obs/disco thread
Typhoon Tip replied to Torch Tiger's topic in New England
Frankly ... no social media should be preferential for information source people. None, or very little of it, regardless of the outlet, has been reviewed and adjudicated. You may have some social media spaces that are less corrupting - unfortunately, even the best, well-intended sources are still prefiltered subjective stews of untested, perhaps well-articulated "accidental gaslighting". This is a beautiful expose' going on, right here, right now, demonstrating the perils of creating a faux reality constructivism that is unguided, and is thus more of a destructive force in the common threading that holds a society together - by believing the social media is better than verified, refereed and/or adjudication, shows a break down in the common trust that is vital to former health of civility. There is also an element of not knowing any better - 50% of the population density is just stupidly naive and for lack of better word, gullible to believe whatever jerks their strings. Social media is at best a tongue in cheek distraction from the pacing of the real, which exists outside of blue screen technology's frenetic button pushing chode tugging. But groups of humanity are apparently, morbidly, substantiating it all; and their beliefs caught up in the fuckery and baseless because of it. -
December 2025 regional war/obs/disco thread
Typhoon Tip replied to Torch Tiger's topic in New England
6z operational GFS looks winter friendly at 500 mb/evolution into the first days of Jan ( night and day to the 0z run, actually - ). However, the sfc evolution left something to be desired. I figure if its evolution in the deep layer is closer to reality, that's correcting most likely. The problem is, it's every other run with these guidance. It's the same shit as the last 6 days of guidance peregrinations, frankly. No sense even reacting to the cinema ...people still will though. Big parked remarkably persistent mega height node, all ensemble systems, smack between the WPO and EPO domains in the N. Pac., while the easterly biased NAO pulsates ...it's leaving almost no pattern signal in between. So we're probably in the worst predictive hole we've been in in years.


