

GaWx
-
Posts
18,158 -
Joined
Content Type
Profiles
Blogs
Forums
American Weather
Media Demo
Store
Gallery
Everything posted by GaWx
-
Is the SV color scale off on AI Weathernext2, too? How would we know?
-
Keep in mind that phase 3 has on average been the coldest phase during the 20 La Niña Februaries since 1975. Note that the upcoming snowstorm threat period of Feb 22-23 centered on the Mid Atlantic is forecasted to be in or very near phase 3 fwiw all the while fighting the making it a challenge progged strong -PNA.
-
6Z SV AI Weathernext2: 8” DC
-
You set up a good example of what I was referring to in my last post. If someone from Lincoln County, which has gone well over climo this winter with 11”, had moved to NYC for more snow this winter, he/she despite getting double that as of now (21.2” vs 11”) might end up mad if that were to be about it for the winter (that’s very doubtful though as this next storm could give them a lot but that’s beside my point). Why not be happy they got 10” more to enjoy as a result of moving? That’s why moving north often doesn’t work like one expected.
-
Today’s Euro Weeklies are cooler but only in the shorter term (week of 2/23-3/1), which covers the latter portion of the expected storm that’s being heavily discussed: Yesterday’s 2/23-3/1: Today’s 2/23-3/1 has a colder signal:
-
They seem to because they actually do as they have much snowier climo, of course, and thus get much more on average. Some there, just as seems to be the case in most subforums, are almost always mad. If they don’t reach climo they’re mad, which keeps them from enjoying what they do get. Thus in their own minds, they almost always “need” more. Some southerners move north for more snow. But then many of them feel the need to get much more in order to be as content. When despite getting more snow than in the S they don’t reach climo, they’re often no happier than they were in the south and sometimes madder! Why can’t they just enjoy the higher amounts vs what they got before? It might be better if they didn’t know climo.
-
Great point except that isn’t usually at least til Mar or April for even the strongest oncoming ones. And lots of times it isn’t till summer or even early fall, especially for the weak ones. In summary, it’s too early for a predominant -SOI even assuming El Niño is on the way in 2026. March is typically the very earliest. —— Edit: @LakeEffectOH is your avatar pic Mrs. Slocombe from “Are You Being Served?”
-
Interestingly, the MJO forecasts of the major models are centered on phase 3 for Feb 22-23, the period of this snow threat. Based on Baltimore’s daily temperatures, phase 3 has by a good margin been the coldest MJO phase there during the 20 La Niña Februaries with it on average being 4F colder than the overall Feb Nina avg. Second coldest is phase 8, which has averaged 2F colder than the overall Feb Niña avg. In Feb of 1996, Baltimore got 8.2” during phase 3. In addition, forecasts have both a -EPO and a -WPO for Feb 22-23, two other favorable indices for cold. OTOH, the models have a moderate to strong -PNA for then, a potential negative factor for cold. So, MJO phase 3, -EPO, and -WPO would be favorable. But would a -PNA hurt?
-
Thanks for posting that. Will it get the dip right this time? It busted with those runs having it very weak around 2/10-15. So far this month the weakest has been down only to 19 m/s.
-
AI Weathernext2 (from Google DeepMind), which has done pretty well overall this winter, gives DC ~10” per the 6Z on SV though this is likely overdone since it is 10:1:
-
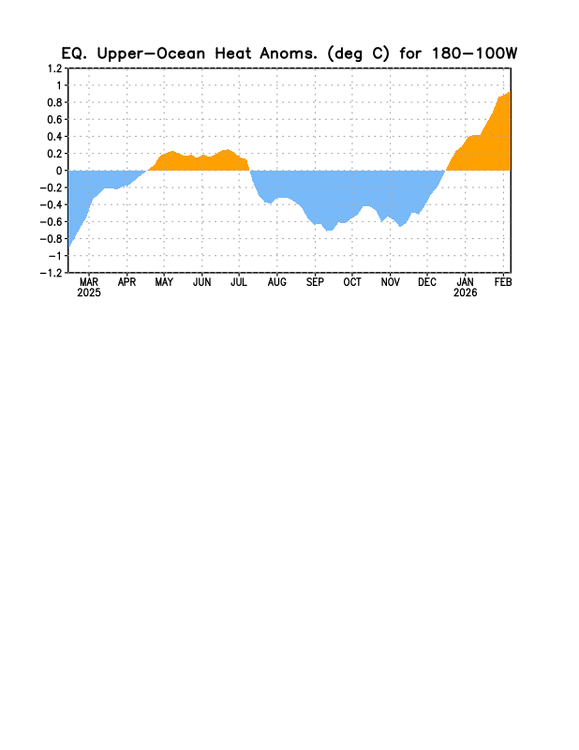
Thanks Chuck. Based on this OHC anomaly chart already showing ~+0.9C, I think your idea of a fast transition is quite believable as of now. However, keep in mind that this isn’t adjusted downward for relative (as in the RONI idea) purposes:
-
This WB 6Z Euro AI op run based on 10:1 has 19” at DC! Of course the 10:1 is way overdone because it has temps 33-35 for the first half of the storm. And the WB Euro AIFS has issues as many of us know with too high snowfall in general. However, the WB 0Z CMC and 6Z GFS do have a big hit per Kuchera of 9”! That’s probably a more realistic scenario for the upside potential imho. If DC were to get 9”, it would be their biggest since the 10.3” of 1/12-14/2019!
-
Although today was AN mainly due to the low, it felt a good bit cooler, especially closer to the coast with a steady breeze off the cold ocean and most noticeably later in the afternoon. Looking forward to a chilly walk this evening.
-
The official record has the following for phase 8 in Dec and Feb this winter: Dec: 3-7, 15, 17-19. Was cold in E US overall. Feb: 1-7 (coldest phase 8 in Feb La Niña recorded MJO history (per Baltimore), which goes back to 1975) MJO phase each day: https://www.bom.gov.au/clim_data/IDCKGEM000/rmm.74toRealtime.txt Baltimore daily temperatures: https://www.weather.gov/wrh/Climate?wfo=lwx
-
Actually, phase 7 has on average (using Baltimore as a representative) been the coldest phase in March (1.7 BN) following La Niña winters with phase 8 second coldest (0.7 BN). But regardless, those are just averages with wide variances and the MJO seeming to have less influence in March vs Feb. Also, the combo of the progged -PNA, +AO, and +NAO would strongly favor mild in early March.
-
I just completed my study of La Niña March temperatures by MJO phase at Baltimore (as a geographically centered rep. of the E coast). Before I show Mar, here’s a review of what I found for Feb Niña by phase: 1: +2.1 (near Niña Feb climo) 2: +4.4 (2nd warmest) 3: -1.5 (coldest) 4: +3.3 5: +3.1 6: +5.5 (warmest) 7: +2.2 (near Nina Feb climo) 8: +0.7 (2nd coldest) AVG: +2.5 Range: 7.0 ————— Now, here’s the just completed March Niña by phase: 1: +1.0 (near Niña Mar climo) 2: -0.1 3: +1.8 4: +0.3 5: +2.1 (2nd warmest) 6: +2.6 (warmest) 7: -1.7 (coldest) 8: -0.7 (2nd coldest) AVG: +0.7 Range: 4.3 ——————— So, how does March Niña compare to Feb Nina? -phase 6 warmest on avg for both -phase 7 coldest on avg for Mar vs phase 3 for Feb -avg anomaly for Mar (+0.7) not as warm as that for Feb (+2.5), which is intuitive for La Nina -Range of variation of averages by phase in Mar (4.3) not nearly as large as that of Feb (7.0), which is somewhat intuitive since temperature volatility tends to drop as we head into met. spring from the most volatile season, winter. This also may indicate that MJO, itself, as a factor may not have quite as much of an influence in March as it does in winter -It’s important to always keep in mind that these are just averages of a wide range for each individual case from MB to MA temp. anomalies. Thus, whereas averages are informative, they don’t tell us how any one case will actually turn out. —————— Sources: MJO phase for each day: https://www.bom.gov.au/clim_data/IDCKGEM000/rmm.74toRealtime.txt Baltimore daily temperatures: https://www.weather.gov/wrh/Climate?wfo=lwx
-
Thanks, Chris. I’ve followed Florida orange production closely since the late 1990s. The 2 main negative factors since then have been Citrus Greening and increased major hurricane frequency during 2004-2024. The hurricane damage was made worse by many of the groves migrating further south to S FL vs C FL being the heart of it earlier. Ironically, they moved further south because of the many devastating freezes of the late 1970s-1980s! This leads me to say that you left off a major positive factor related to CC: sharp drop in major freeze damage events. During the late 1970s-1980s there were many major freezes including Jan 1977, Jan 1981, Jan 1982, Dec 1983, Jan 1985, and Dec of 1989 (30% losses from this one, alone!). Since Dec of 1989, there has been nothing even close to these devastating FL orange crop freezes thanks in large part to CC, which you didn’t even mention. As a side note, major Brazilian coffee freezes have also dropped in frequency and severity since the 1990s thanks in part to CC.
-
Even the short range of the Euro AI has bogus snow. Check this stupidity out: The bogus 18Z Euro AIFS ens member 7 on WB gave Valdosta, GA, a foot of snow for the 6 hours ending at 7PM last evening lmao:
-
I look (or more accurately laugh) at them mainly on WxBell. Are the Euro AI snow maps flawed on Pivotal and other places, too?
-
Chuck, Even the short range of the Euro AI has bogus snow. Check this stupidity out: The bogus 18Z Euro AIFS ens member 7 on WB gave Valdosta, GA, a foot of snow for the 6 hours ending at 7PM last evening lmao:
-
My forecast has low 80s for Thu/Fri highs…yippee!
-
I got ~0.75” of rainfall from showers mid to late this afternoon with some heavy for a short period. This is the most I’ve gotten in a day since at the very least Jan 18th. The new mini-drainage system that was set up in the back portion of MBY seemed to do pretty well although the real tests will probably not come til spring and especially summer.
-
Thanks, Don 1. I felt that at a minimum that the wording wasn’t the best, possibly due to haste. I may follow up with him on that to get better clarification. 2. He did mention the effect on crop sizes from the variable of climate/wx being hard to separate out. Doesn’t that include the variable of temperature?
-
Thanks, Charlie. Here’s Mike’s response to your reply: These people remind me of MAGA, seriously. It's complete fake climate crisis RELIGION. CO2 below 1,000 parts per million is a massively beneficial gas. To compare it to when CO2 was numerous times higher that this [sic] is a strawman attack (assigning a position that doesn't exist and attacking that position instead of the REAL one). And to keep projected CO2's increase for another 100 years and to keep insisting that the residence time for today's CO2 in the atmosphere is hundreds of years lacks critical thinking based just on how we watch it DROP during the Northern Hemisphere's growing season every year. Ignoring the fact that fossils fuels are finite and will be running out well before then and the chances of us ever getting over 900 ppm, the optimal level for life/plants/crops is minuscule. So what if CO2 was X thousands of parts per million in the past???? That is NOT what will be happening from CO2 increasing this time. The highest reasonable projection is still BELOW the optimal level of 900 ppm. Regarding all the articles from so called authorities that climate change is already cutting back on food production: 100% nonsense. It's the exact opposite. With crops, we can't tell how much impact is from CO2, climate/weather, genetics, fertilizers, use of pesticides/herbicides(technology). When you change numerous variables at the same time, like we do with crops, it's impossible to separate the impact from each one on the outcome. However, we have 2 ways to address that with OBJECTIVE data which clearly speaks for the impact of photosynthesis by itself and for photosynthesis +climate change. 1. The impact of JUST adding CO2 and not changing anything else: Here is irrefutable evidence using empirical data to show that the increase in CO2 is causing a huge increase in crop yields/world food production. We can separate the CO2 effect out from other factors effecting [sic] crops and plants with many thousands of studies that hold everything else constant, except CO2. Observing and documenting the results of experiments with elevated CO2 levels tell us what increasing CO2 does to many hundreds of plants. Here's how to access the empirical evidence/data from the site that has more of it than any other. Please go to this link: http://www.co2science.org/data/data.php 2. But other human factors impact soybeans, including climate change that we can't separate out. That's ok because we have something that looks almost exclusively at the increase in CO2 and climate change as the main factors. Planet earth has been a huge open air experiment the past XX years. The objective results are striking. The impacts have been mostly from changes in photosynthesis and changes in the climate. Carbon Dioxide Fertilization Greening Earth, Study Finds https://www.nasa.gov/technology/carbon-dioxide-fertilization-greening-earth-study-finds/ In addition: Earth greening mitigates hot temperature extremes despite the effect being dampened by rising CO2 https://www.sciencedirect.com/science/article/pii/S2590332223005584 ++++++++++++++ Importantly, the indisputable science tells us that increasing CO2 allows plants/crops to be more drought tolerant(not the other way around). The reason is that plants open their stomata to get CO2 and while doing so, they transpire(lose water from their roots that get it from the soil) As CO2 increases, the stomata don't need to open as wide and this REDUCES water loss from their roots. It's rock solid agronomy/plant science. CO2 Enrichment Improves Plant Water-Use Efficiency https://www.masterresource.org/carbon-dioxide/co2-increased-water-use-efficiency/ +++++++++++++++= Despite me just PROVING the points with indisputable science above, this is what the very predictable response will be from people that posted to you previously with the same response they gave the first time: "Those are denier sources" NASA's satellite study showing the greening of the planet obviously can't be put in that category but CO2 Science and Dr. Craig Idso, an elite authority on plants and the impact of CO2/climate change, has been labelled a denier. Never mind everything he shows is backed up with empirical data and rock solid scientific principles, which is why I use that source(as an atmospheric scientist for 44 years). If he or anybody else, including me, contradicts the mainstream view on the climate crisis.........they are discredited as deniers no matter us [sic] using 2+2=4 science to prove that 2+2 is not 5.
-
CO2 is not “pollution” from my perspective. I never agreed with using that term for CO2 despite fully believing in AGW.


