

GaWx
-
Posts
19,226 -
Joined
Content Type
Profiles
Blogs
Forums
American Weather
Media Demo
Store
Gallery
Everything posted by GaWx
-
2026-2027 Super El Nino
GaWx replied to Stormchaserchuck1's topic in Weather Forecasting and Discussion
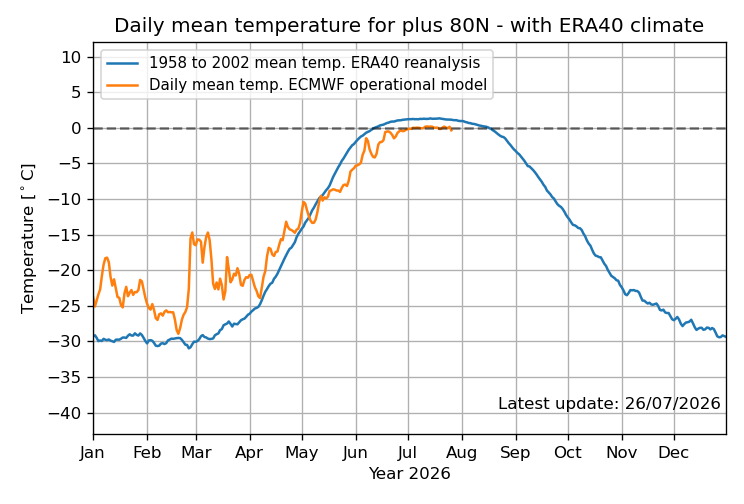
Arctic ice area currently isn’t doing bad at all vs the avg for 2013-24, perhaps helped by the relatively cold 80N+: -
Indeed, much of NC improved. But SE SC still is in pretty bad shape for now as they hardly changed:
-
2026-2027 Super El Nino
GaWx replied to Stormchaserchuck1's topic in Weather Forecasting and Discussion
Darwin has had 21 straight days of 1015+ mb pressure. Based on records back to to 1991, that’s a new record long string breaking the old record of 20 days set in Aug of 2015. -
2026-2027 Super El Nino
GaWx replied to Stormchaserchuck1's topic in Weather Forecasting and Discussion
The hot summer of 1991 was an exception. -
Tornadic waterspout is the answer: A tornadic waterspout is a true tornado that forms over water or moves from land to water. It develops downward from a severe thunderstorm, bringing high winds, large hail, and lightning. [1, 2, 3]
-
"Tornadic waterspouts", also accurately referred to as "tornadoes over water", are formed from mesocyclones in a manner essentially identical to land-based tornadoes in connection with severe thunderstorms, but simply occurring over water.[22] A tornado which travels from land to a body of water would also be considered a tornadic waterspout.[23] Since the vast majority of mesocyclonic thunderstorms in the United States occur in land-locked areas, true tornadic waterspouts are correspondingly rarer than their fair-weather counterparts in that country. https://en.wikipedia.org/wiki/Waterspout
-
I think it is counted as a “tornadic waterspout”.
-
Scattered convection (moving ESE just like 3 days ago) has been occurring throughout the area since ~7:45PM. I’m away from home and so have no idea how much I got there. The cooldown from today’s 99-101 in the area has been dramatic! Edit on 7/30: I only got 0.1” yesterday (7/29), which puts me at 4.4” MTD.
-
It already hit 99.5 at 2:15PM at my place! The highest so far this season that I’ve seen here is 101.1, which was at 2:35PM on July 12th. Winds are from the SW, keeping the seabreeze away. Skies are mostly to partly sunny with an ugly haze. ——————— *Edit: 100.5 at 2:30PM! Since I don’t have RH, I don’t have a heat index. However, based on surrounding stations, it’s likely ~113! ————— *Edit: 100.9 at 2:46PM! *Edit: 101.1 at 3:22PM, which ties with my hottest of the summer to date on July 12th!
-
2026-2027 Super El Nino
GaWx replied to Stormchaserchuck1's topic in Weather Forecasting and Discussion
-July’s -SOI, which is headed toward sub -25, is going to end up the strongest on record by a wide margin. The current record July -SOI is 1965’s -21.0. The next lowest are at -19.8 (1905 and 1882). This will at least give support to the progged record rate of warming of 3.4 within 30 days being shown by several models between the means for July and Aug of 2026. -The avg of June and July is also headed to a record low. The current record is the -23.8 of 1905. -The beauty of the SOI is that it apparently isn’t biased to any significant degree in any direction by CC. Thus, this measure is one of the most objective ways to measure the strength of ENSO without having to worry about GW/looking at relative vs raw. -
2026-2027 Super El Nino
GaWx replied to Stormchaserchuck1's topic in Weather Forecasting and Discussion
Going back to when I started following the CFSv2 AAM forecasts in Nov of 2023, the latest release (7/28/26 0Z) easily has THE strongest CFSv2 ensemble forecasted mean AAM of any I’ve ever seen/saved. The mean exceeds +2.5 by day 8 (Aug 5th), +3.0 by day 16 (Aug 13th), and +3.5 by day 20 (Aug 17th)! Although days 1-7 are a little shy of the strongest for week one of the forecast, all of the days day 8 to the end (day 32) are THE earliest periods in the forecast to get that strong of those that I’ve saved. Granted these have a notable +AAM bias starting ~day 15 that rises further with time as I’ve noted a number of times. But regardless, this one is very strong by day 8, which is early enough to be fairly reliable, and this run is as I said the strongest of any run that I’ve seen as a whole, which bodes well for the chance for a very strong +AAM dominating at least through the 1st 1/2 of August: -
WPAC, Indian Ocean, and Southern Hemisphere Tropical Cyclones
GaWx replied to 1900hurricane's topic in Tropical Headquarters
“Typhoon Dolphin is expected to strengthen into a violent storm as it moves towards Japan's remote Minami-Torishima Island, the Japan Meteorological Agency said on Wednesday.” https://en.wikipedia.org/wiki/Minamitorishima -
INLAND CHATHAM- INCLUDING THE CITIES OF GARDEN CITY, POOLER, AND SAVANNAH 707 AM EDT WED JUL 29 2026 ...EXTREME HEAT WARNING IN EFFECT FROM 11 AM THIS MORNING TO 7 PM EDT THIS EVENING... TODAY MOSTLY SUNNY. A SLIGHT CHANCE OF SHOWERS AND THUNDERSTORMS THIS AFTERNOON. HIGHS IN THE UPPER 90S. HEAT INDEX VALUES UP TO 112. WEST WINDS 5 TO 10 MPH. CHANCE OF RAIN 20 PERCENT.—————————INCLUDING THE CITIES OF WILMINGTON ISLAND AND TYBEE ISLAND 707 AM EDT WED JUL 29 2026 ...EXTREME HEAT WARNING IN EFFECT FROM 11 AM THIS MORNING TO 7 PM EDT THIS EVENING... TODAY MOSTLY SUNNY. A CHANCE OF SHOWERS AND THUNDERSTORMS THIS AFTERNOON. HIGHS IN THE UPPER 90S. HEAT INDEX VALUES UP TO 115. WEST WINDS 5 TO 10 MPH. CHANCE OF RAIN 30 PERCENT————The low so far today at KSAV is 82! Will they get convection and/or outflow from nearby convection to get below that by this evening? Not likely but possible. If not, the 82 would tie a record high low.
-
The extended GEFS and more-so the EPS are suggesting a pretty robust monsoon (wetter than normal) getting established early to mid-Aug and staying pretty active though diminishing some near the start of Sept on the EPS. What period is the heart of the Monsoon climowise?
-
2026-2027 Super El Nino
GaWx replied to Stormchaserchuck1's topic in Weather Forecasting and Discussion
Well, as the comparison to cyclonicwx RONI graphs have been showing, NOAA seems like it could be 0.3C too low. Regardless, BoA does seem a bit high. I just figured out that they're very likely using the warm biased (by ~0.2C) Coral Reef Watch SSTs instead of OISST, which is ~0.2C cooler than CRW: CRW: was ~+1.94 for the avg of the week ending 7/26/26…so that almost has to be the reason: The average of the 2 may be closest to reality. @snowman19 -
2026-2027 Super El Nino
GaWx replied to Stormchaserchuck1's topic in Weather Forecasting and Discussion
Holy Moses! That has relative 3.4’s latest weekly averaged value way up at +1.94 vs NOAA’s +1.4! What the?? -
2026-2027 Super El Nino
GaWx replied to Stormchaserchuck1's topic in Weather Forecasting and Discussion
The latest BoA continues to suggest a new record rate of one month’s warming of 3.4 for ANY month (back to 1950) with August ~1.1C warmer than July, similar to the CFS. Look at that steep slope!! So, now through August will need to really perform or else progged peaks would likely come down somewhat. Model consensus has had mid to late summer as the most rapid rate of warming for quite awhile. The record summer -SOI certainly gives it a fantastic level of support: -
Thanks for the info on the current RDU station going only back to 1945. But that article did miss July 1991’s 10.27” at RDU: https://www.weather.gov/wrh/Climate?wfo=rah
-
2026-2027 Super El Nino
GaWx replied to Stormchaserchuck1's topic in Weather Forecasting and Discussion
Ray, Please explain why you think the NOAA monthly PDO data that I quoted is overrated. What do you think about JB’s choice of a cross between. 1957-8 and 1965-6 as analogs (warm Dec except NN SE, colder Jan with BN S 2/3 of US, even colder Feb (cold most of US), and chilly Mar) making overall NDJFM avg cold concentrated in S 1/2 of US and JFM avg cool to cold most of US)? They are similar to the CFS fwiw. -
RDU has had THE wettest July 1-26 on record with 11.13” with records going back to 1887! See more about July in the Tweet quoted below. This first 26 days of the month is the 2nd wettest 1st 26 days of any met. summer month with only Aug of 1908 wetter (13.63”)! https://www.weather.gov/wrh/Climate?wfo=rah “1.17 inches of rain just after midnight today at @RDUAirport now has the monthly total at 11.13 and 4th wettest July on record.. We are just 1.23 from equaling the wettest July on record..” https://twitter.com/SERCC/status/2081740186287849851?
-
2026-2027 Super El Nino
GaWx replied to Stormchaserchuck1's topic in Weather Forecasting and Discussion
What in the heck is going on with the recent NOAA weekly releases for Nino 3.4? The week centered on July 22nd was only barely below +1.75 per the cyclonicwx.com OISST graph! 01JUL2026 2.7 1.5 1.2 0.5 08JUL2026 2.6 1.6 1.3 0.5 15JUL2026 2.8 1.6 1.4 0.4 22JUL2026 3.0 1.8 1.4 0.3 -
2026-2027 Super El Nino
GaWx replied to Stormchaserchuck1's topic in Weather Forecasting and Discussion
The Arctic N of 80N since late May has been the coldest per the DMI graphs since 1958! Keep in mind that variances in summer are quite small and thus this is all it has taken to easily be the coldest. IF this were to continue through late August and especially Sept, it’s going to get my attention more as that’s generally when anomalies have started to be warm in most recent years after a near neutral summer: -
2026-2027 Super El Nino
GaWx replied to Stormchaserchuck1's topic in Weather Forecasting and Discussion
Joe Bastardi’s current primary analogs for this winter are 1957-8 and 1965-6. He showed on Saturday that the avg temperature of those 2 in DJF is close to what recent CFS means have had. But his basis of using those 2 is that they’re both 2 very strong El Niños with a -PDO. What the? Whereas I hope we get something like what the CFS has been showing, I can’t figure out why he’s counting them as -PDO analogs: -1957-8 had +1 to +2.4 PDO every month from June through Feb! -1965-6 PDO was neutral in July and then +0.7 to +1.4 Aug-Dec. Then it fell only to borderline -PDO in Jan/Feb (-0.3, -0.2). https://www.ncei.noaa.gov/pub/data/cmb/ersst/v5/v6/index/ersst.v6.pdo.dat -
It’s interesting that both the Arctic and the Antarctic have been cold the last 2 months relative to the past. The Arctic N of 80N since late May has been the coldest per the DMI graphs since 1958! Keep in mind that variances in summer are quite small and thus this is all it has taken to easily be the coldest. IF this were to continue through late August and especially Sept, it’s going to get my attention more as that’s generally when anomalies have started to be warm in most recent years after a near neutral summer:
-
From an Evansville, IN, pro-met These were the observations at Evansville, IN for 4-5-6pm on July 26, 2026. The dew point readings were 80-80 and 81. The 81 deg. F dewpoint tied the record for highest dew point in history at this location. It happened on 4 previous occasions.


